CodeJumps
Overview
CodeJumps are popups (1) shown in the source code editor, that provide detailed information about the relations between functions, classes, variables, etc: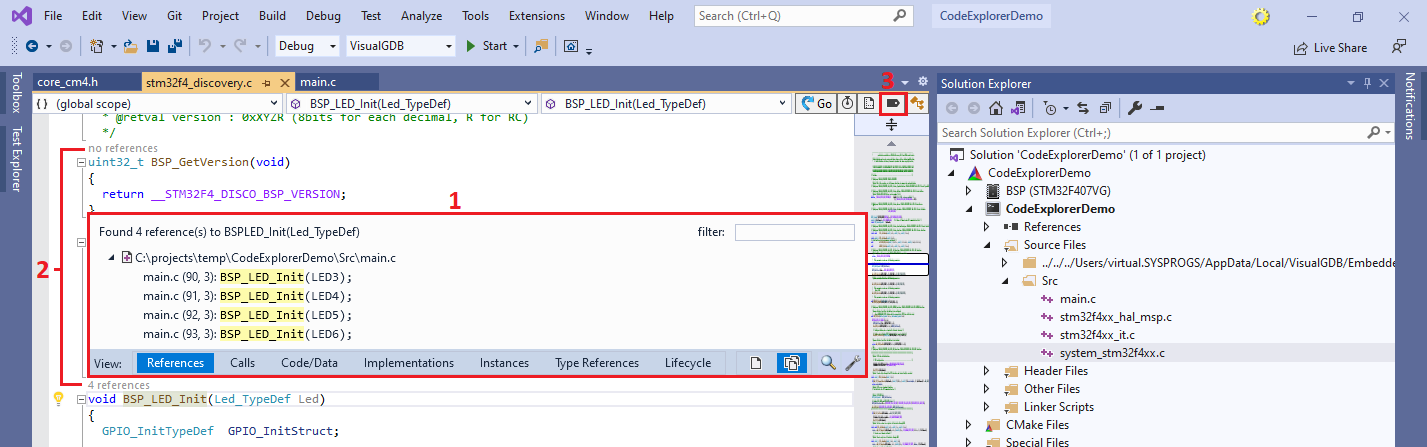 The popups can be opened by clicking on the CodeJumps annotations (2) above the function and type declarations. You can quickly turn the CodeJumps annotations on and off via the CodeJumps button in the top right corner of the editor (3).
Note that CodeJumps are provided by the Clang IntelliSense engine and will not appear for projects using the regular VC++ IntelliSense.
Tweaking
CodeJumps can show a variety of different information:
- All references to a specific symbol
- Incoming/outgoing calls to functions
- Variables read/written by functions, and functions accessing variables
- Implementations of pure virtual methods and function pointers
- All instances of a specific type
- All functions creating/deleting instances of a class/struct
You can select the specific view at the bottom of the CodeJumps popup (1): 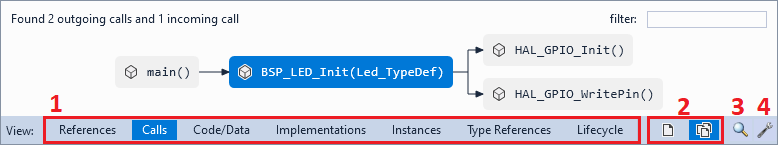 Normally, CodeJumps show information from the entire solution, however you increase performance by restricting them to the current project only via the scope selector (2).
If you would like to view multiple symbols at once, flag them for further review, or find common roots in call trees, use the Code Explorer button (3) to open the selected entity in Code Explorer.
You can customize various CodeJumps settings via the “Settings” button (4) or by opening Tools->Options->Text Editor->C/C++ (VisualGDB)->CodeJumps: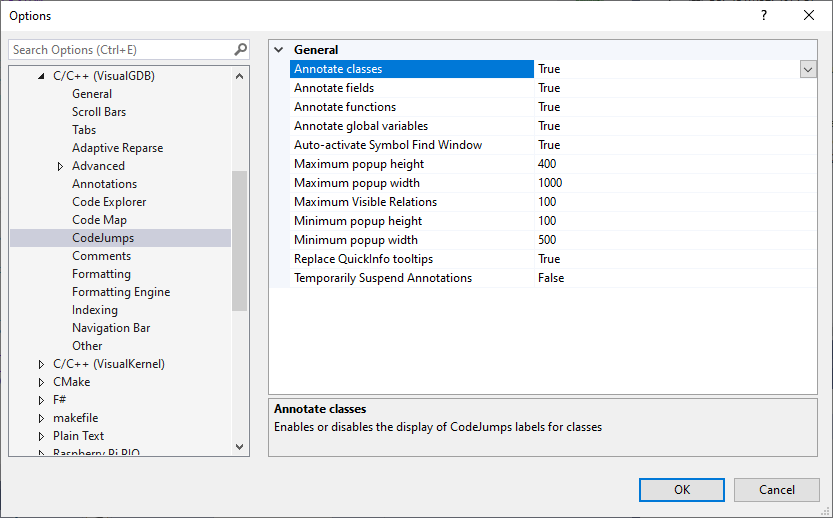
QuickInfo
CodeJumps popups can be shown instead of the regular QuickInfo tooltips. Simply hover the mouse over the QuickInfo popup and click “Switch to Advanced View”: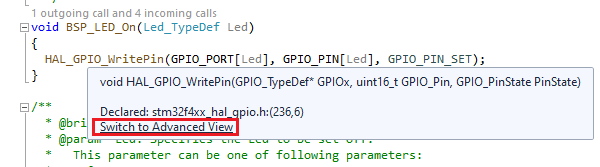 This will display an equivalent of the CodeJumps popup instead of the regular QuickInfo tooltip:
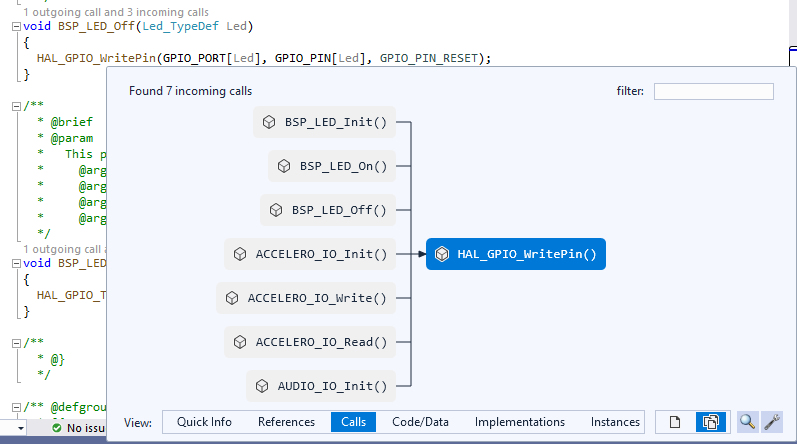 VisualGDB will remember the last view used in the QuickInfo tooltips, and will show it next time you hover the mouse over another symbol. You can switch back to the simple QuickInfo view later by selecting “Quick Info” in the view selector.