Using Static Code Analyzers with VisualGDB
You can use the Advanced Clang IntelliSense engine included with VisualGDB to automatically check your code for common errors.
Once static code analysis is enabled, VisualGDB automatically run the Clang Static Analyzers on the source files you edit and will display the analysis messages in the Errors window.
You can configure the enabled analyzers via VisualGDB Project Properties -> Code Analyzers: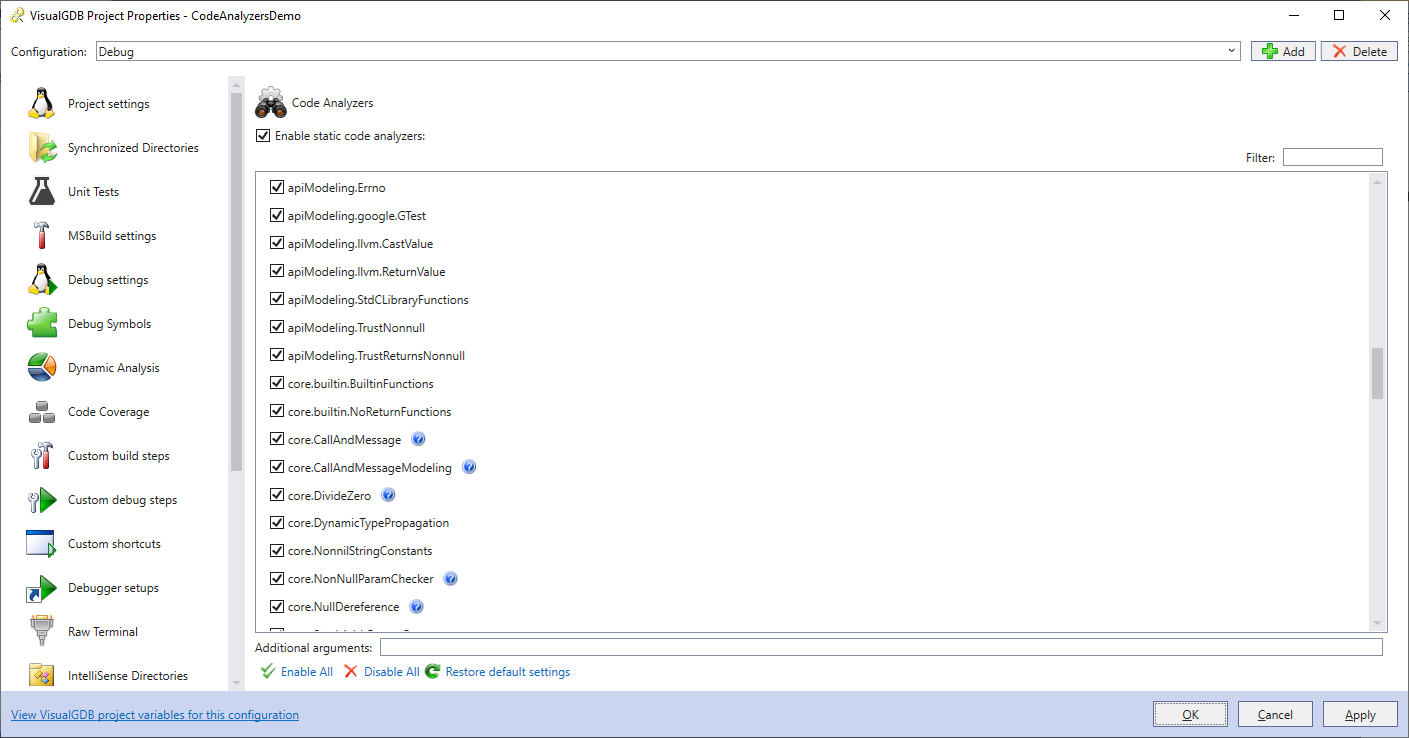 The messages from the analyzers for the current file will appear in the Error List window together with the regular errors and warnings:
 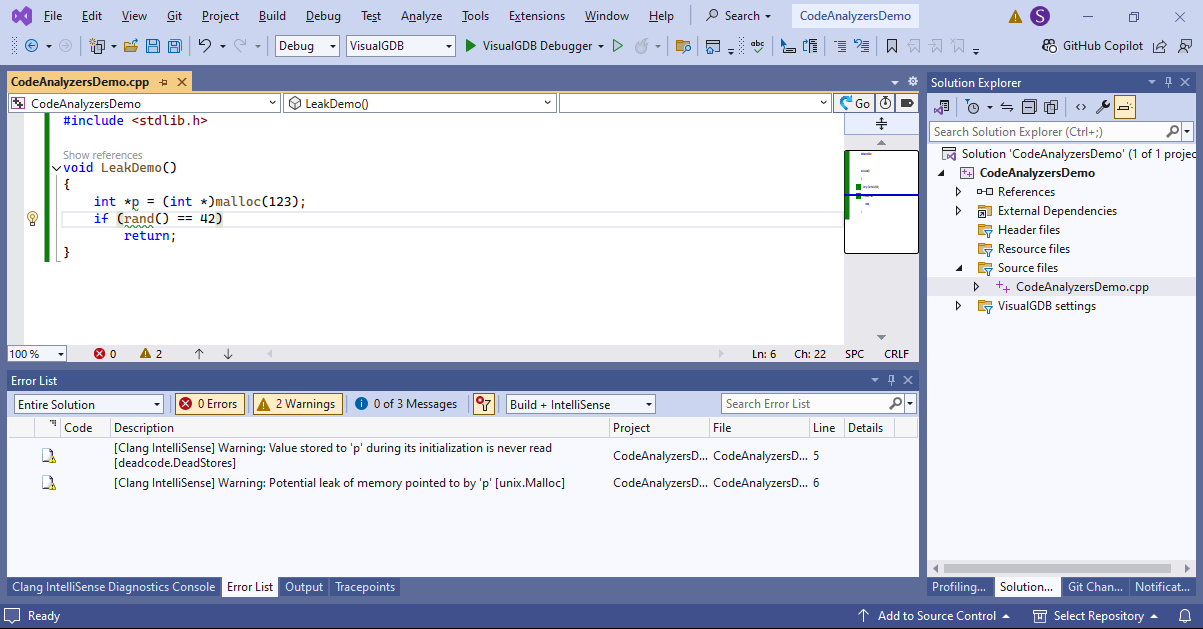 You can quickly check if the analyzers are working with the following code example:
#include <stdlib.h> void LeakDemo() { int *p = (int *)malloc(123); if (rand() == 42) return; } |
If the messages from the code analyzers do not appear, make sure the currently edited file is handled by the Clang IntelliSense engine by checking the buttons in the upper right corner:
If not, see our IntelliSense documentation for instructions on enabling Clang IntelliSense.
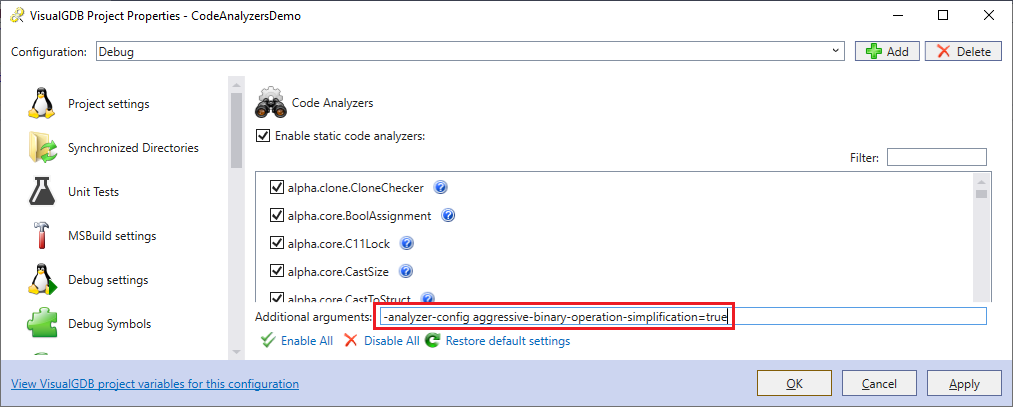
Also, enabling some experimental analyzers (alpha.*) may stop the analyzers from working due to missing option: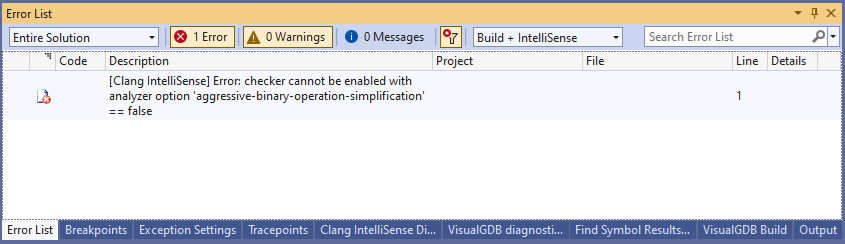
This can be fixed by adding the following option to the additional arguments field:
-analyzer-config aggressive-binary-operation-simplification=true