Tracking Separate Callers when Profiling
VisualGDB can record profiling information for Linux projects in one of 2 modes:
- One entry per each function
- One entry per each unique call stack
The first option generally requires less overhead and allows quickly pinpointing the slowest functions. However if those functions are called from multiple locations, it doesn’t easily allow locating the call stack associated with the most consumed time. We will illustrate this with a basic example.
Consider the following program:
void delay(int iter) { for (int i = 0; i < iter; i++) asm("nop"); } void fast() { delay(1); } void slow() { delay(10000000); } int main(int argc, char *argv[]) { fast(); slow(); return 0; } |
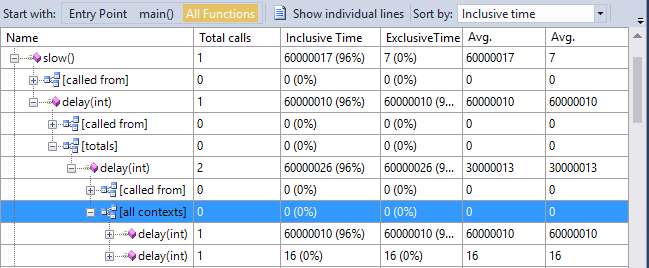
Most of the time will be spent in the delay() function called with an argument of 10000000 from the slow() function. However the regular profiling report will only show that the function was called twice consuming ~ 60M cycles:
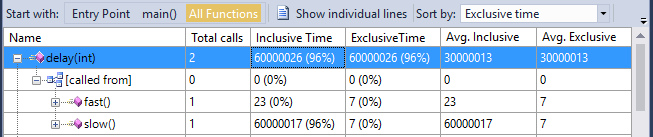
In this example it is obvious from the inclusive time of fast() and slow() that most of the time comes from the slow() function, however if those functions would call other functions affecting the runtime, or were themselves called from different locations, tracking down the critical path for the delay() function could be tricky.
To track the individual contexts of each functions responsible for the most delay, enable the “Distinguish up to <…> parent frames” option: 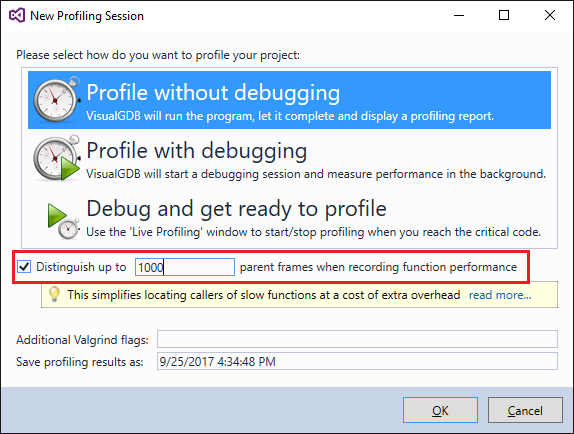 This will change the way the profiling report looks. You can now view all contexts of the ‘delay’ function (i.e. call stacks) by expanding the “[all contexts]” node:
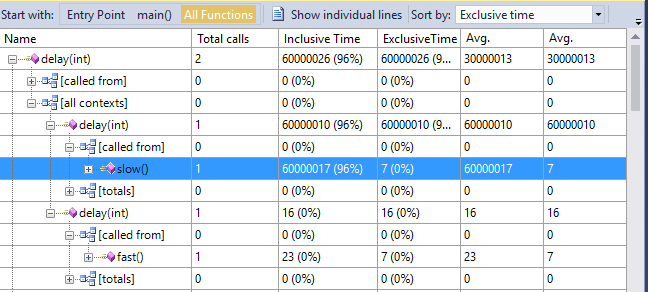
See how the slow call from slow() is now shown separately from the fast call from fast().
If you now look at the functions called from the fast() or slow() function, VisualGDB will be able to distinguish different instances of delay() and will show them correctly (e.g. the call to delay() from fast() won’t be confused with a much slower call from slow():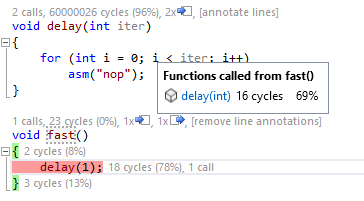 You can view the sum of all execution times for all contexts of a certain function by expanding the [totals] node in the report viewer. It will also let you see other contexts via expanding the “[all contexts]” node: