Diagnosing Problems in Imported Projects
This tutorial shows how to diagnose problems in projects imported into VisualGDB from other IDEs by comparing the command lines used to build the projects with VisualGDB and in the other IDE.
Normally, the steps described in this tutorial are not needed because VisualGDB can automatically import commonly used settings from most popular project formats. However, sometimes, overridden values of rarely used settings can trigger behavior difference between the projects built with VisualGDB and other IDEs and this tutorial provides detailed steps on diagnosing such differences.
In this tutorial we will do the following:
- Create a project with the Keil uVision IDE that will trigger a stack overflow unless full optimization is used.
- Override the optimization in Keil project properties.
- Import the project into VisualGDB using the basic Keil importing plugin. This will handle the source files and common settings (e.g. include search path and preprocessor macros), but will preserve the default optimization settings, triggering the stack overflow.
- We will then compare the 2 versions of the project, showing how to quickly locate the differences between them and to adjust the settings accordingly.
Before you begin, install VisualGDB 5.4 or later.
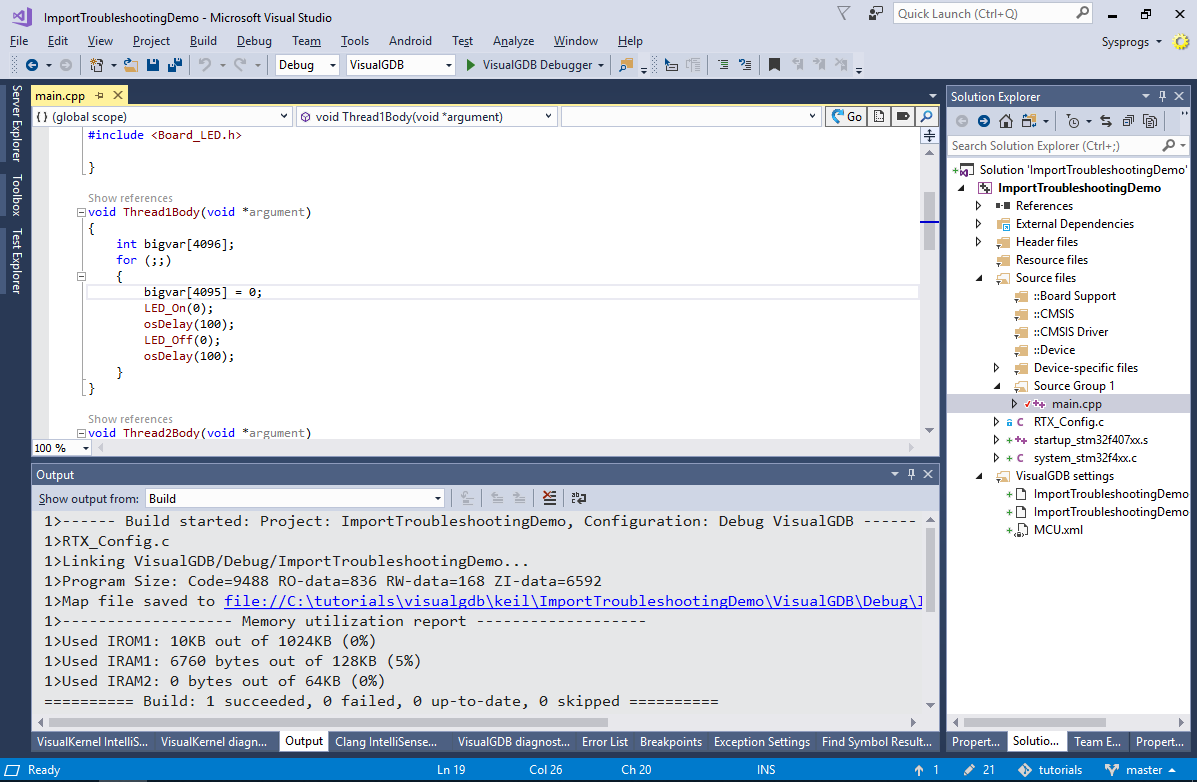
- Start the Keil uVision IDE and create an RTX-based project with the following code in one of the thread functions:
void Thread1Body(void *argument)
{
    int bigvar[4096];
    for (;;)
    {
        bigvar[4095] = 0;
        LED_On(0);
        osDelay(100);
        LED_Off(0);
        osDelay(100);
    }
}
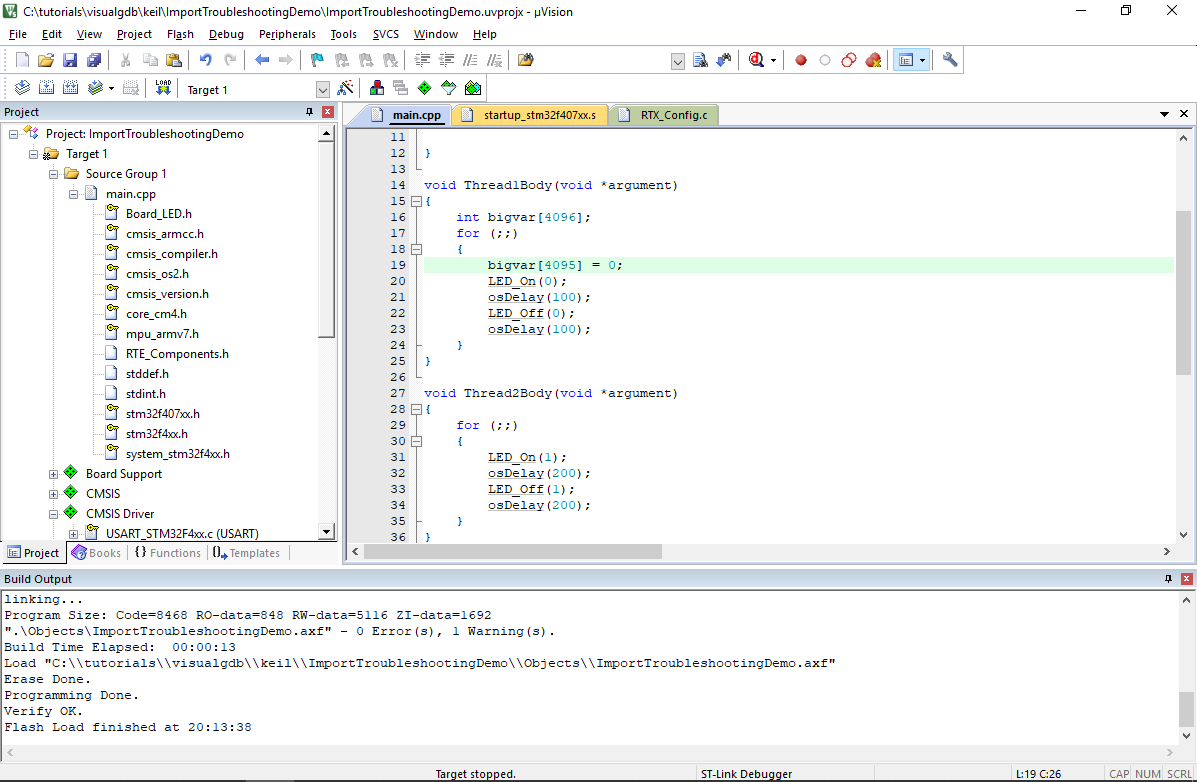 This will trigger a stack overflow unless the bigvar variable is optimized out.
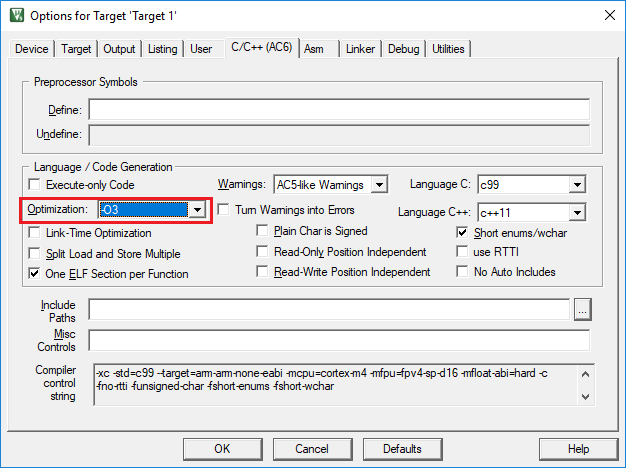
 - Build the debug configuration of the project and ensure it crashes. Then change the optimization level to O3 and ensure that the project starts working as expected:
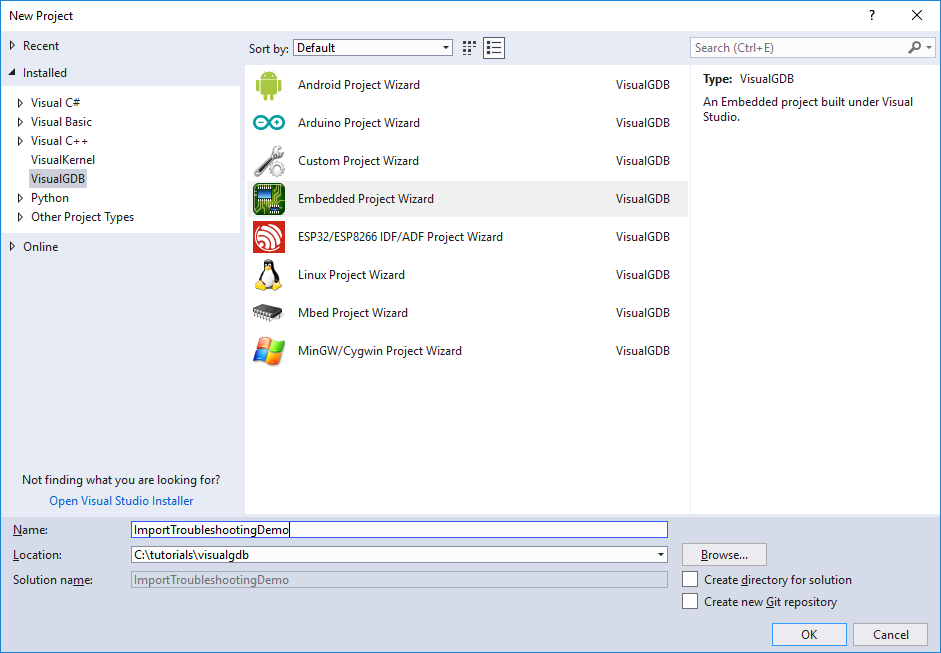
- Now we will import the project into VisualGDB and will build it using the Keil compiler. Start the VisualGDB Embedded Project Wizard and enter the name and location of the project:
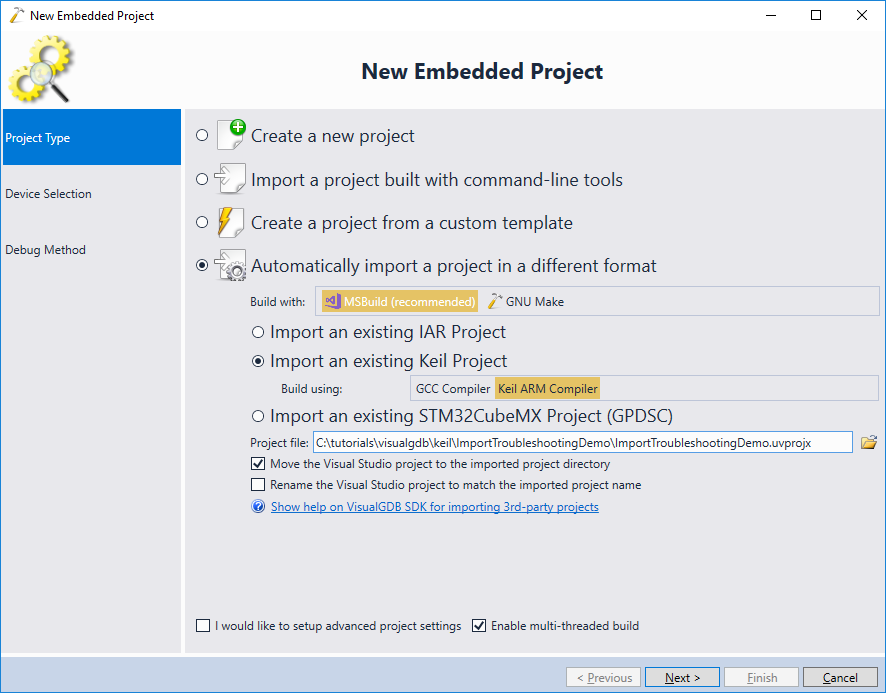
- Then choose “Automatically import a project in a different format” -> “Import an existing Keil Project” -> “Keil ARM Compiler” and check the “Move the Visual Studio project to the imported project directory” checkbox:
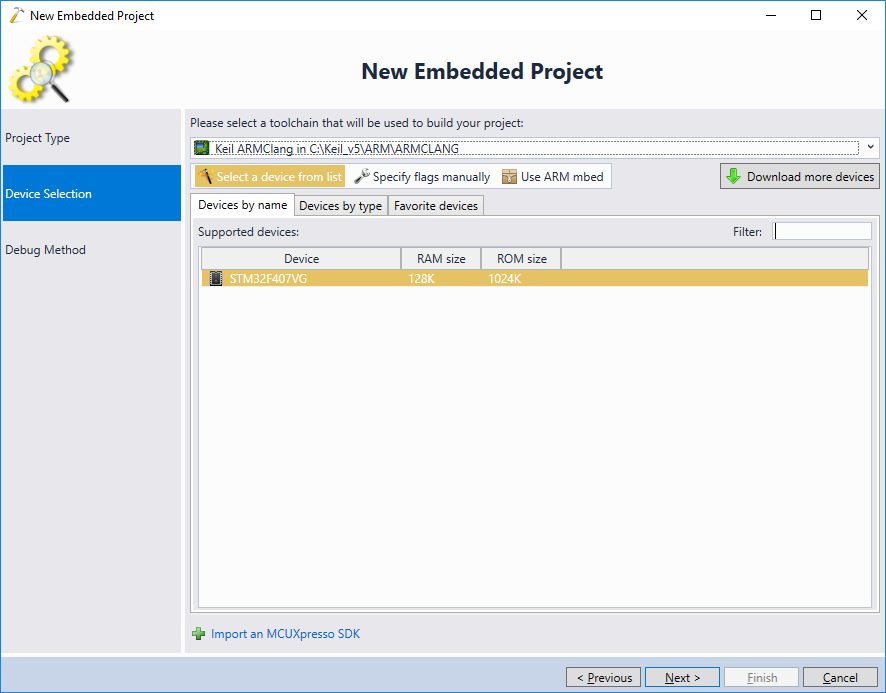
- On the next page of the wizard select the device to use:
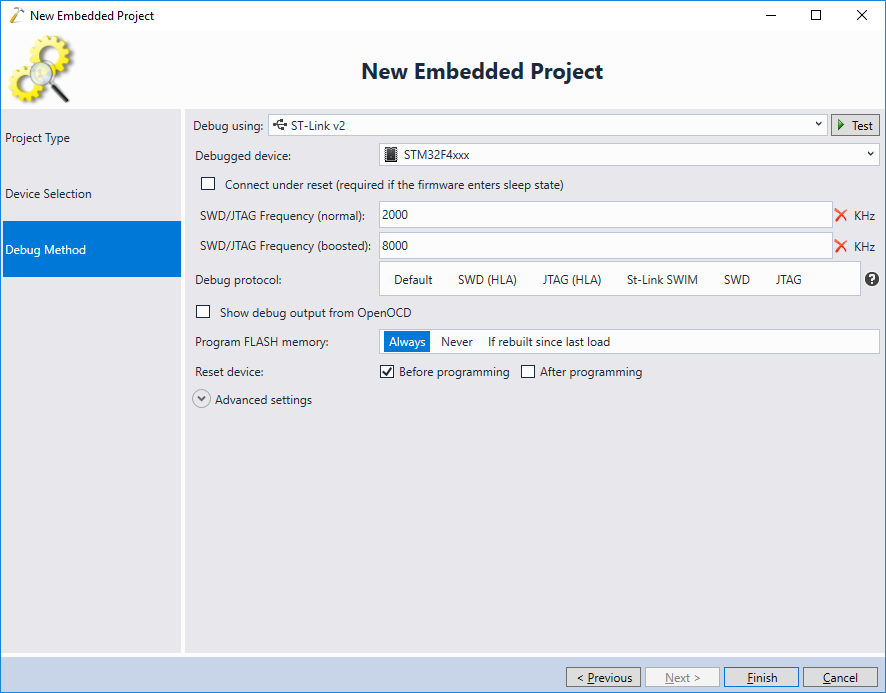
- Finally select the debug settings that will work with your setup and click “Finish”:
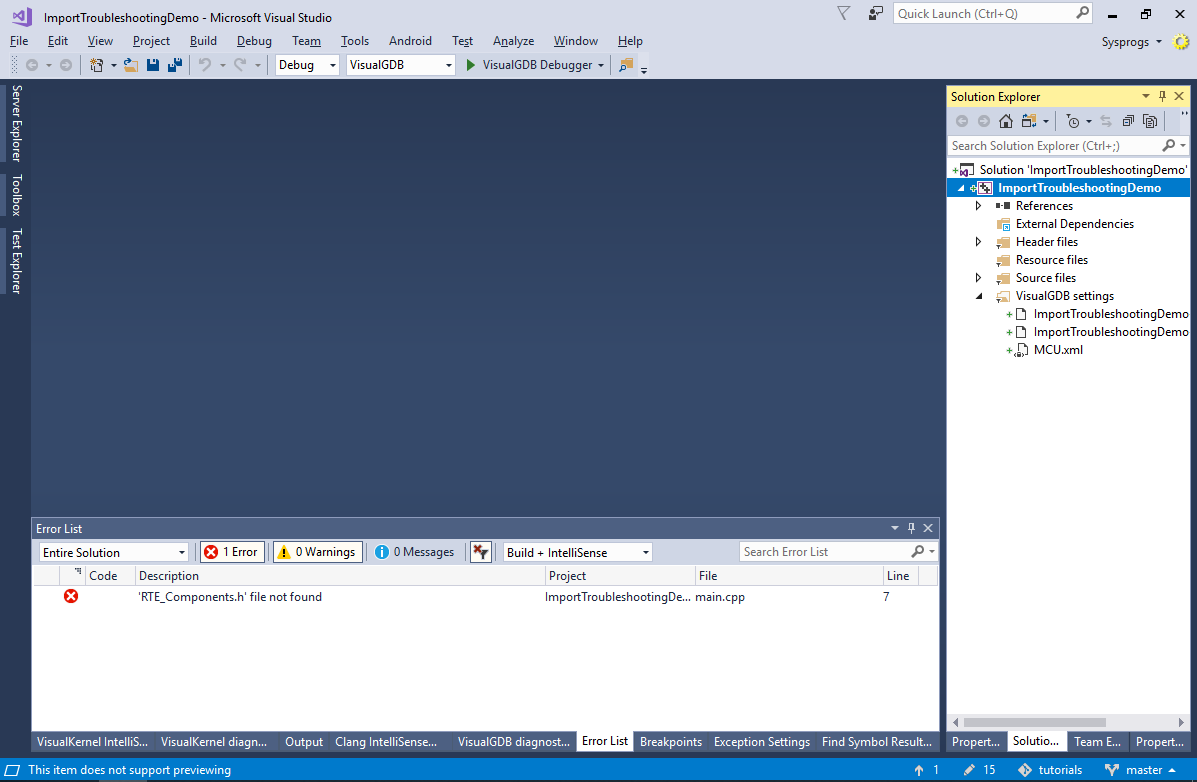
- As of version 5.4, VisualGDB will import the basic project structure, including the project-specific source files, preprocessor macros and header search directories, however it will not automatically import advanced compiler settings, or the Keil packs:
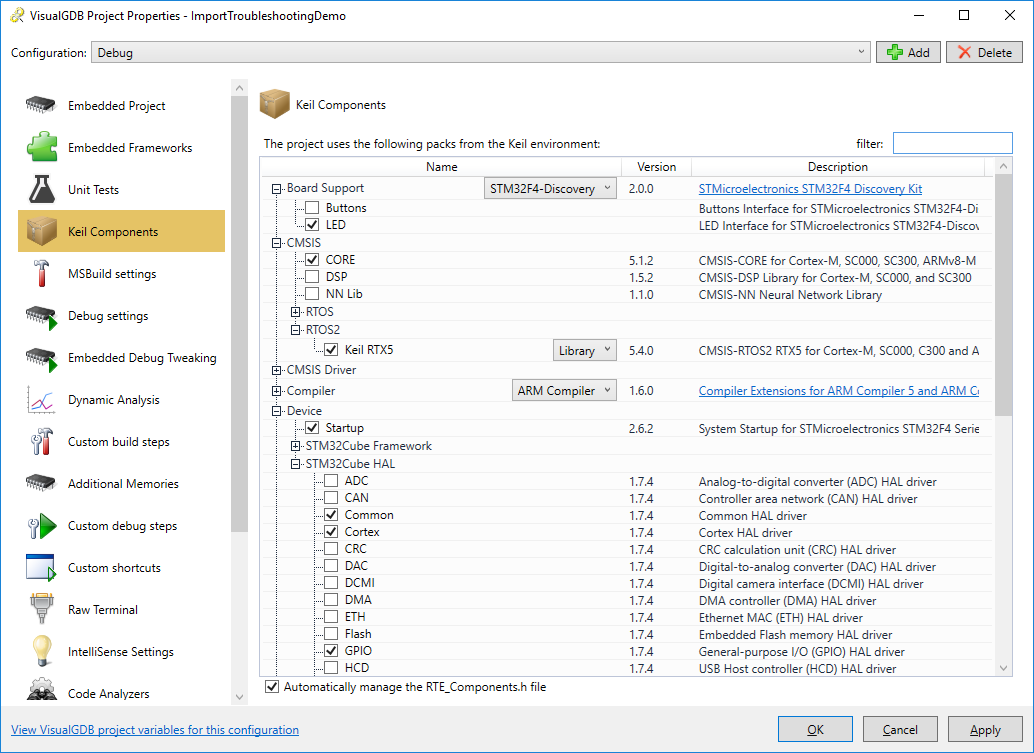
- To fix the Keil Packs, open VisualGDB Project Properties -> Keil Components (Custom edition and higher) and select the packs to reference:
- Build the project and ensure that it triggers the stack overflow (i.e. the on-board LEDs will not blink as expected):
- Now we will begin troubleshooting the project. First of all, open the Embedded Memory Explorer and try comparing the ELF file built by VisualGDB against the ELF file built by Keil (typically the .axf extension):

- Then, switch to the detailed view and sort the symbols by the size difference:
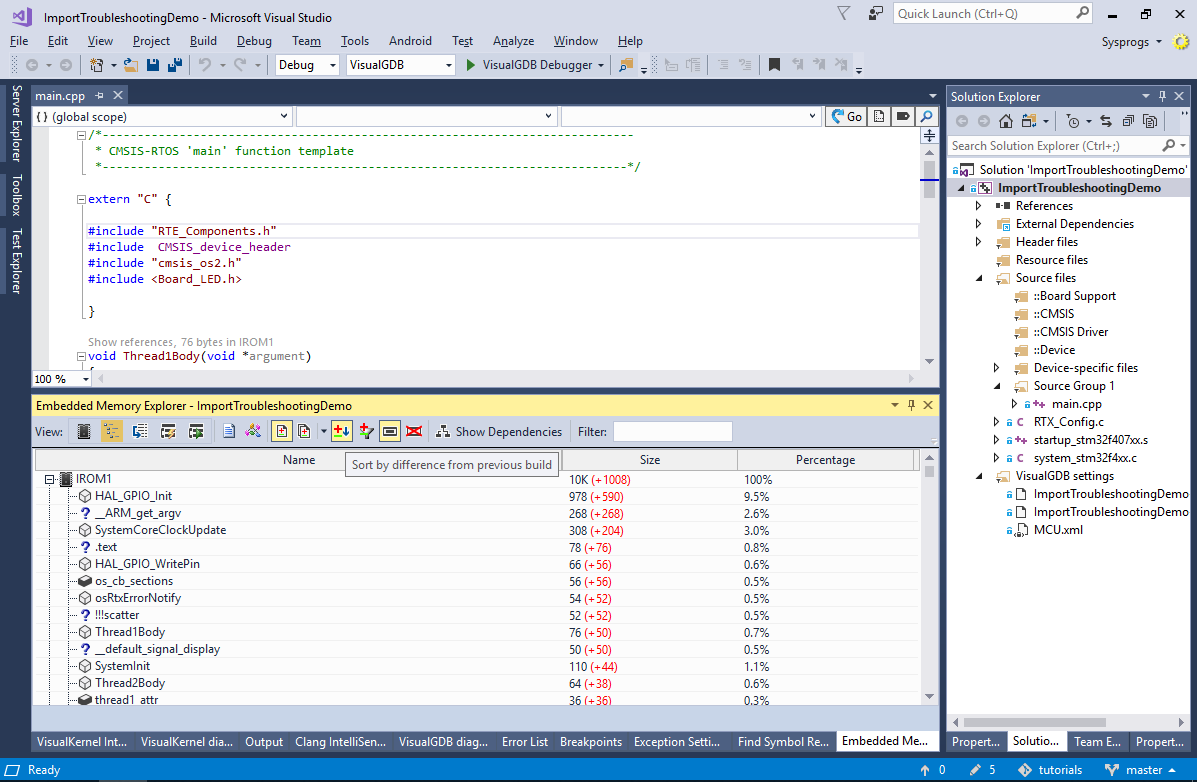 In many cases this will provide clues about the root cause of the error. E.g. if the VisualGDB-built file is missing some sections, the difference could be caused by the linker script/scatter file. Multiple symbols being considerably larger would suggest an optimization level difference.
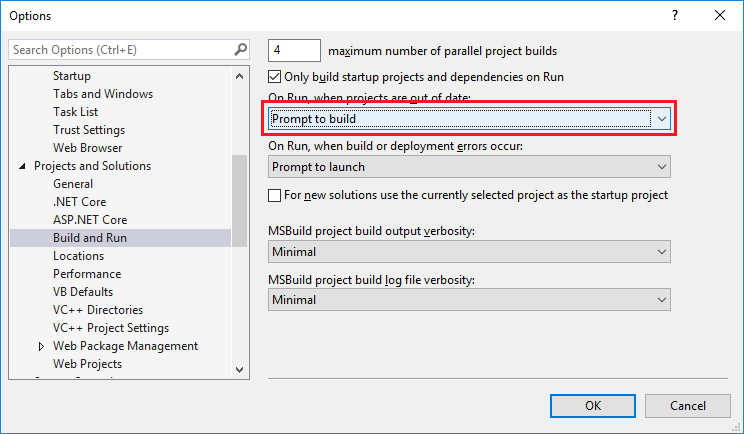
 - The next step would be to verify that the difference is caused by the build-time differences, not debug settings. Replace the ELF file produced by VisualGDB (typically VisualGDB\Debug\<Project Name>) with the ELF file produced by Keil (typically Objects\<Project Name>.axf) and disable automatic project rebuild via Visual Studio options:
 If the ELF file built with Keil uVision runs successfully under the VisualGDB debugger, the problem is caused by build-time settings and the rest of the tutorial will show how to quickly narrow it down.
 - Enable batch file generation in the Keil IDE and build the project:
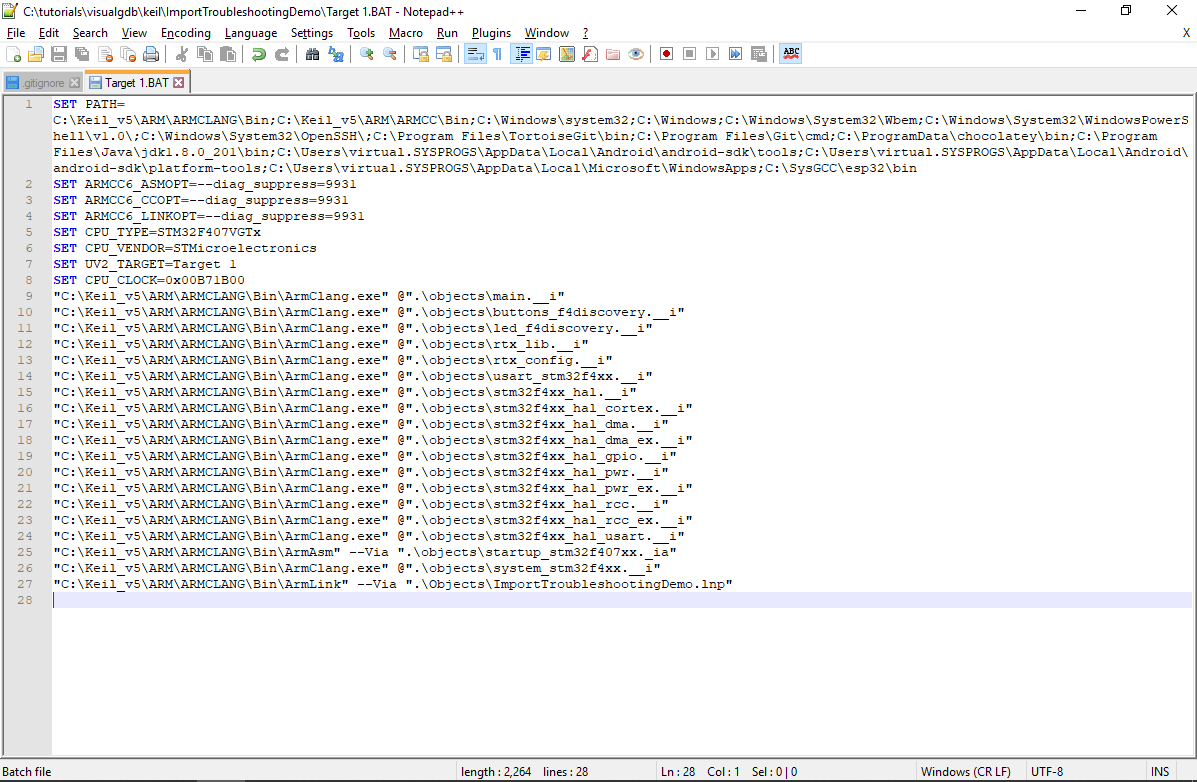
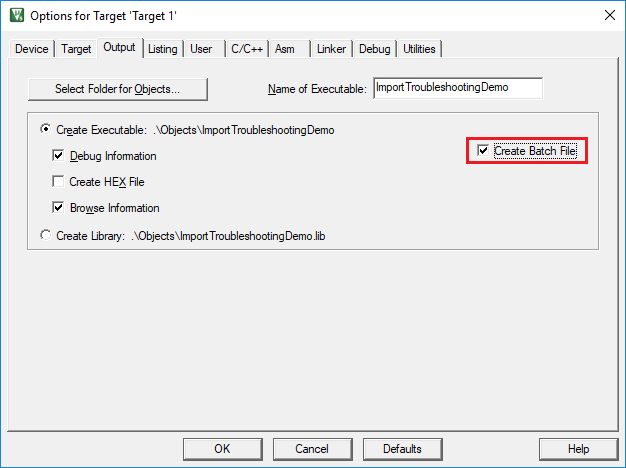 This will dump all command line arguments used by Keil to text files with the .__i or .lnp extension and will generate a .bat file invoking the Keil compiler and linker.
 - Locate and open the .bat file generated by the Keil IDE. See how it contains compiler/assembler command lines (lines 9-26) followed by a linker command line (line 27):
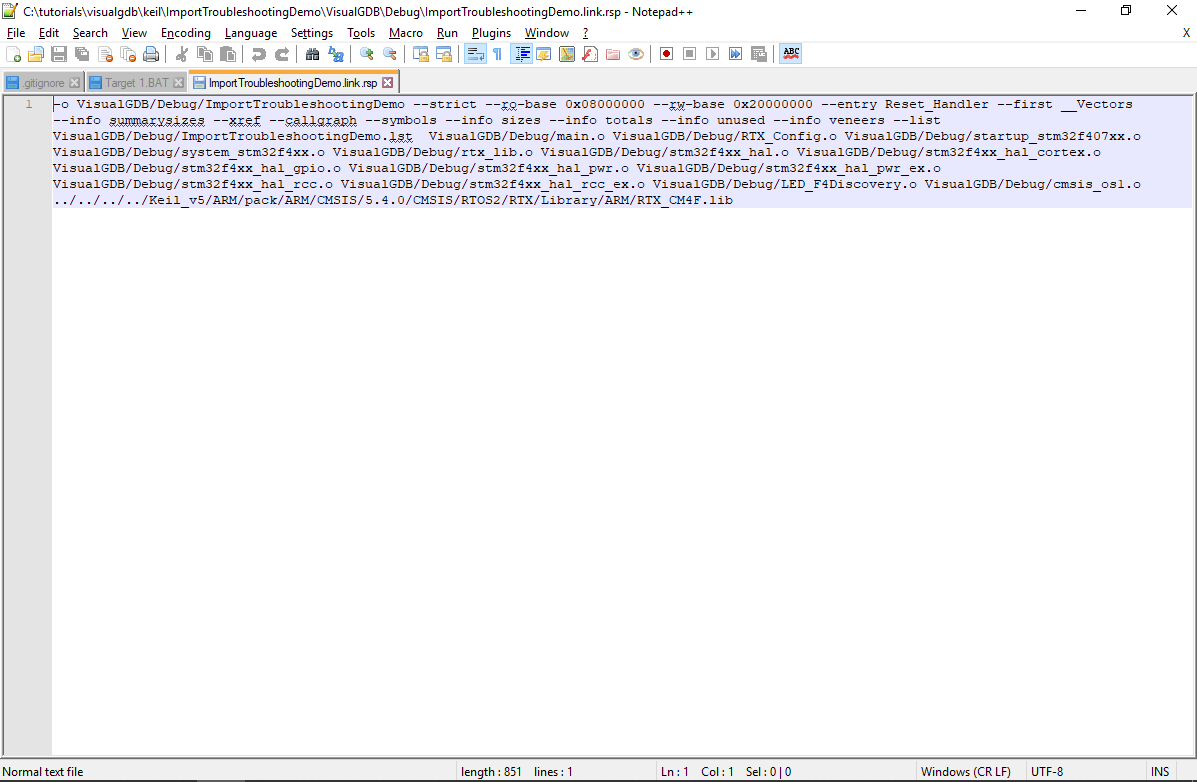
 E.g. The command “C:\Keil_v5\ARM\ARMCLANG\Bin\ArmLink” –Via “.\Objects\ImportTroubleshootingDemo.lnp” means “run the ARM linker with command-line options taken from the ImportTroubleshootingDemo.lnp file.
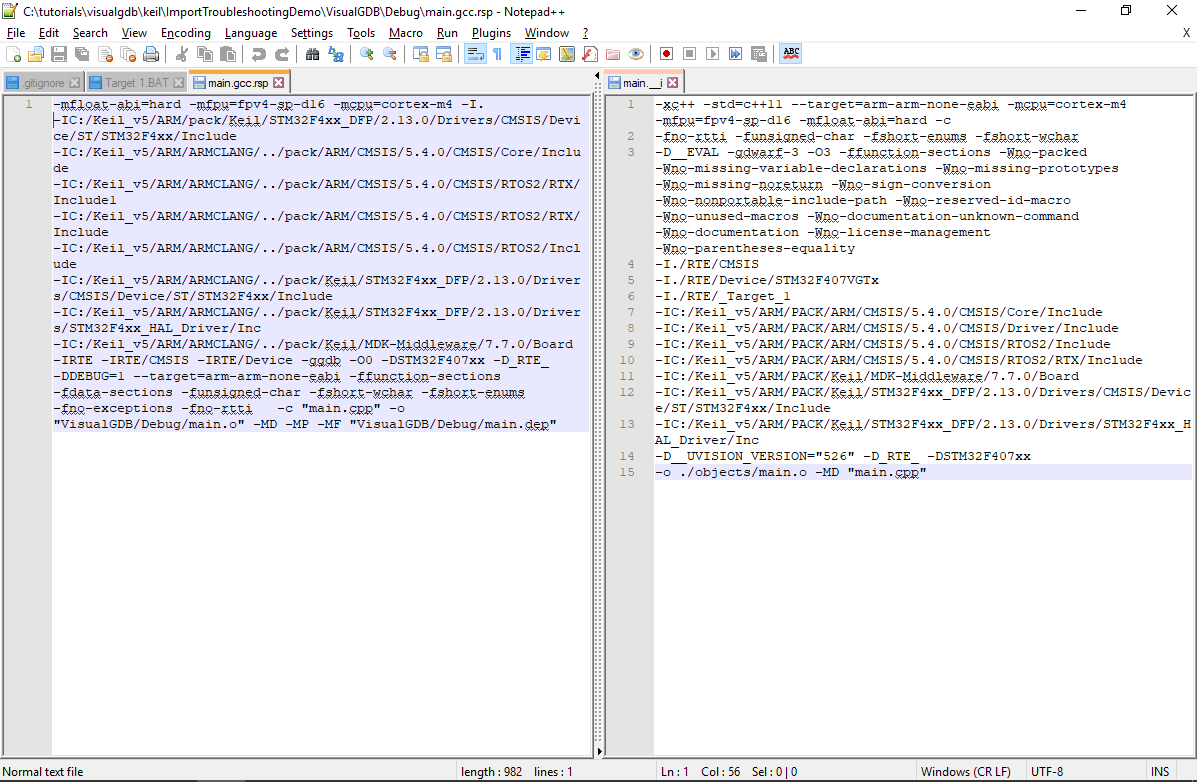
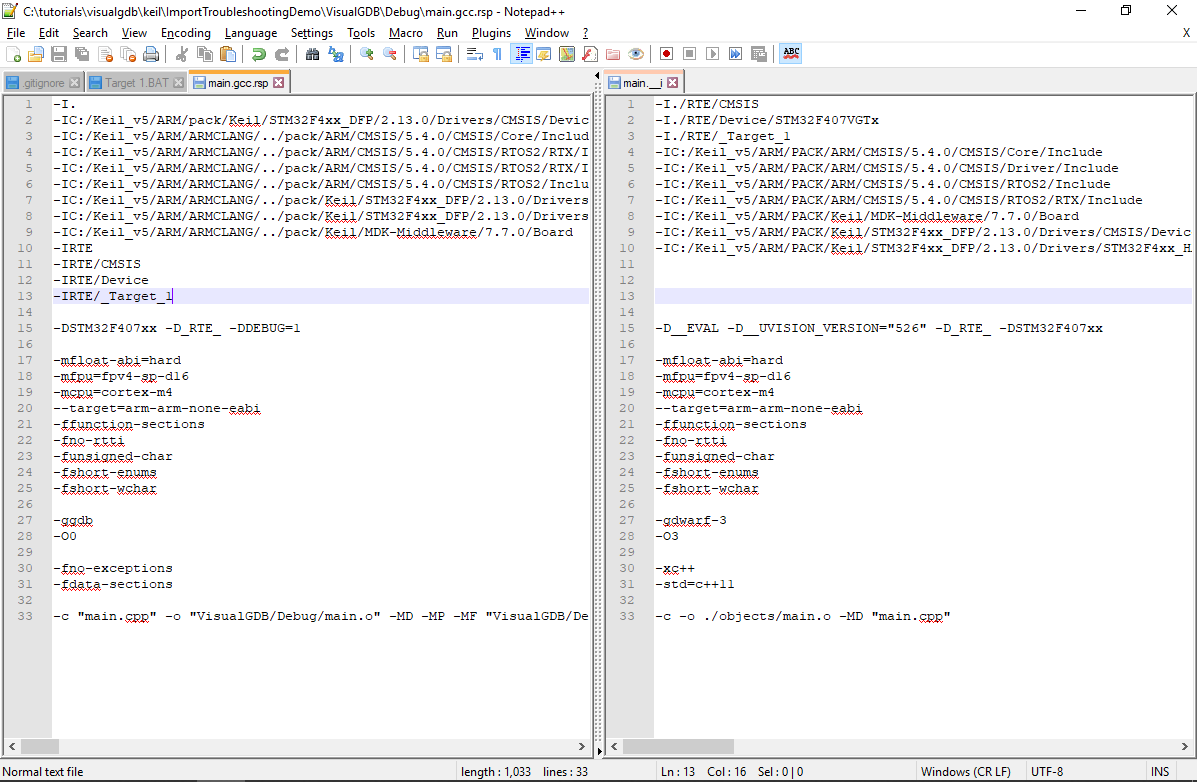
 - VisualGDB uses a similar mechanism for handling the command lines – it stores the command line arguments to .rsp files (instead of .__i or .lnp) and runs the compiler, assembler or linker the same way. Locate the .link.rsp file in the VisualGDB\Debug directory and open in in a text editor:
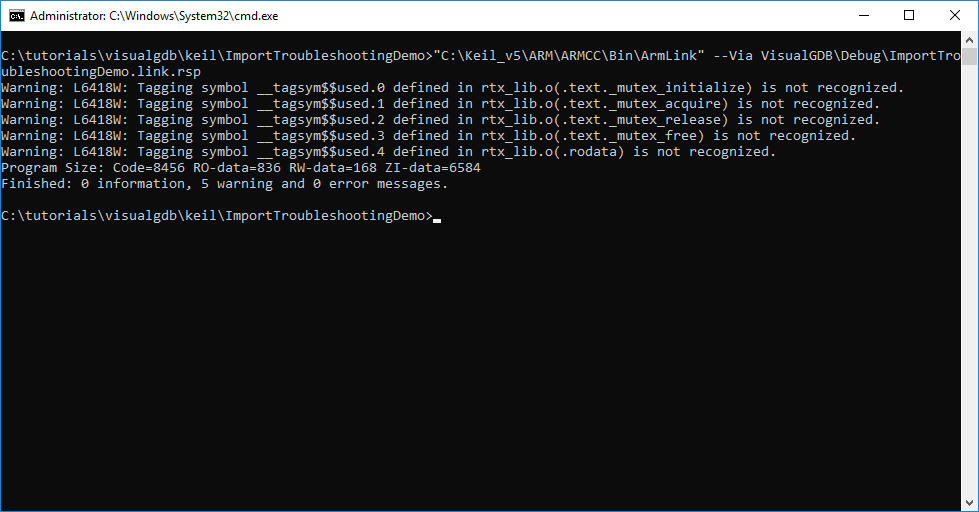
- Since it is not practical to compare each and every command line, we will now do a series of tests to quickly identify the one responsible for the problem, starting with the linekr. Open the command prompt window in the project directory and run the following command:
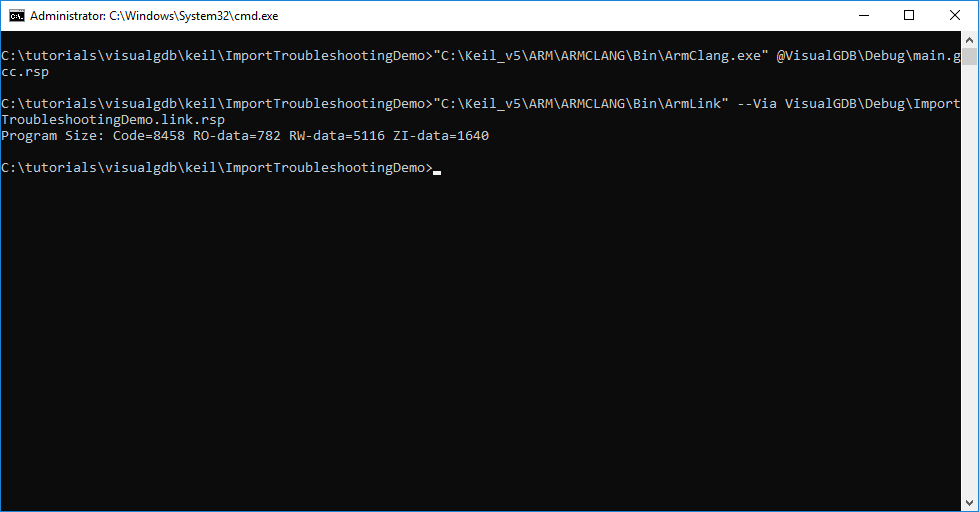
"C:\Keil_v5\ARM\ARMCLANG\Bin\ArmLink" --Via VisualGDB\Debug\ImportTroubleshootingDemo.link.rsp
This will re-link the ELF file produced by VisualGDB (not rebuilding the object files):
- Now we will begin our tests. First of all, replace the .o files (inputs of the linker) in the VisualGDB\Debug directory with the .o files produced by Keil (from the Objects directory) and re-run the linker command line:
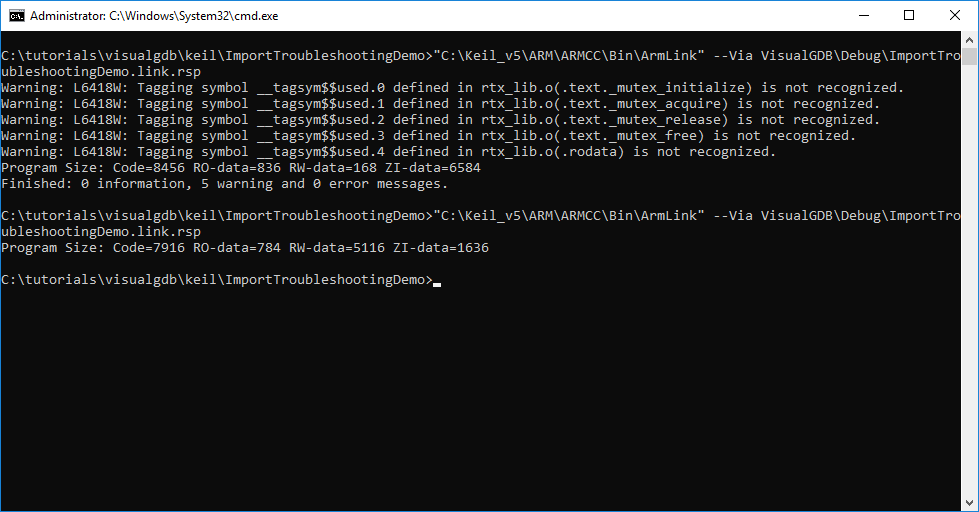 Try debugging the VisualGDB project again (do not rebuild it, as it would replace the file we manually linked). If the project runs successfully, the problem is caused by one of the source files. If the project still doesn’t work, the problem is caused by the linker command line.
 - If the problem is caused by the command line, try regrouping both the Keil’s .lnp file and the VisualGDB’s .rsp file to have the common options at the beginning and the differences at the end. Then, merge the differences, half at a time and check whether the result works. This will help quickly identify the missing setting. In this tutorial the problem is caused by the optimization settings of the main source file, so replacing the command line is not necessary (i.e. the project will run successfully with VisualGDB’s command line when using the .o files from uVision).
- Now we will identify a specific .o file responsible for the problem. The easiest way to do it is to restore (or rebuild) the .o files created by VisualGDB and then replace just half of them with the Keil equivalents. If the program’s behavior changes, it was caused by one of the recently replaced files. Roll back the replacement and repeat it with just the half of the files replaced last time. Due to the logarithmic complexity of this approach, it will only take a few iterations to narrow down the .o file responsible for the problem, even for huge projects.
- Locate the .__i and .rsp files for the .o file that is causing the problem:
- Regroup the .rsp file settings into 5 groups:
- Include directories
- Preprocessor macros
- Flags that are common between 2 files
- Flags that have different values (e.g. optimization settings)
- Flags that are missing in one of the files
Remove the warning-related flags, as they do not affect the compilation result. Also separate the part that specifies the names of the source file, object file and the dependency file:
- Verify that you can still build the object file using the regrouped .rsp file from VisualGDB (note that Clang-based ARMv6 compiler uses the @<RSP file> syntax instead of –Via <RSP file>) by running the compiler and linker manually:
 Then ensure that the problem still persists.
 - Replace all of the flags (except the input/output file name specifications) with the version captured the uVision IDE. Build the source file, link the project and ensure that the problem got resolved.
- Now that we have confirmed that the problem is triggered by the compiler flags, we can narrow it down to a specific flag. Revert to the regrouped version of the VisualGDB’s RSP file and replace the first 2 groups with the values from the Keil’s file and check whether the behavior changes.
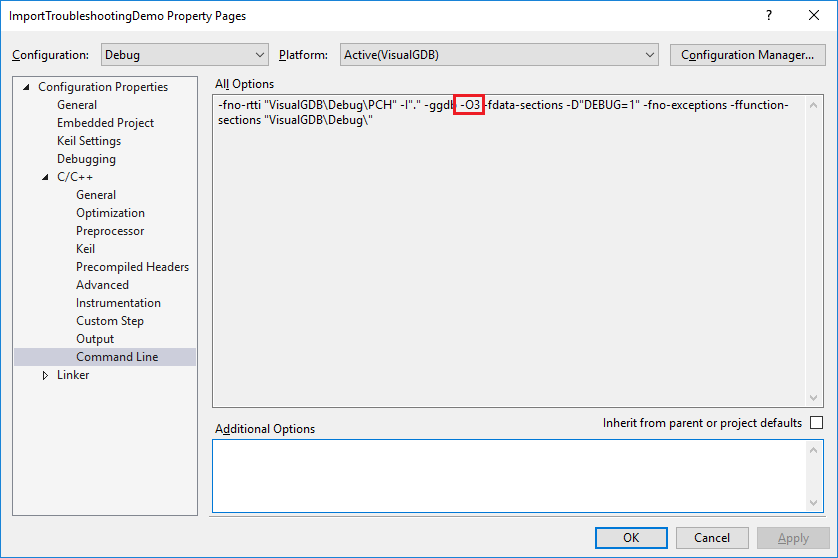
- Repeat the step above until you locate the flag group responsible for the behavior difference, then use the same approach to narrow down a specific flag. Once you have located it, change the corresponding setting in Visual Studio Project Properties and verify that the command line looks as expected:
 Now your VisualGDB-based projects should produce exactly the same results as the uVision-based one.