Debugging the ESP32-C6 device via JTAG
This tutorial shows how to use VisualGDB to create, build and debug a basic project for the ESP32-C6 device. Before you begin, make sure you install the latest ESP32 toolchain and the ESP32 Debug Methods package via Tools->VisualGDB->Manage VisualGDB Packages.
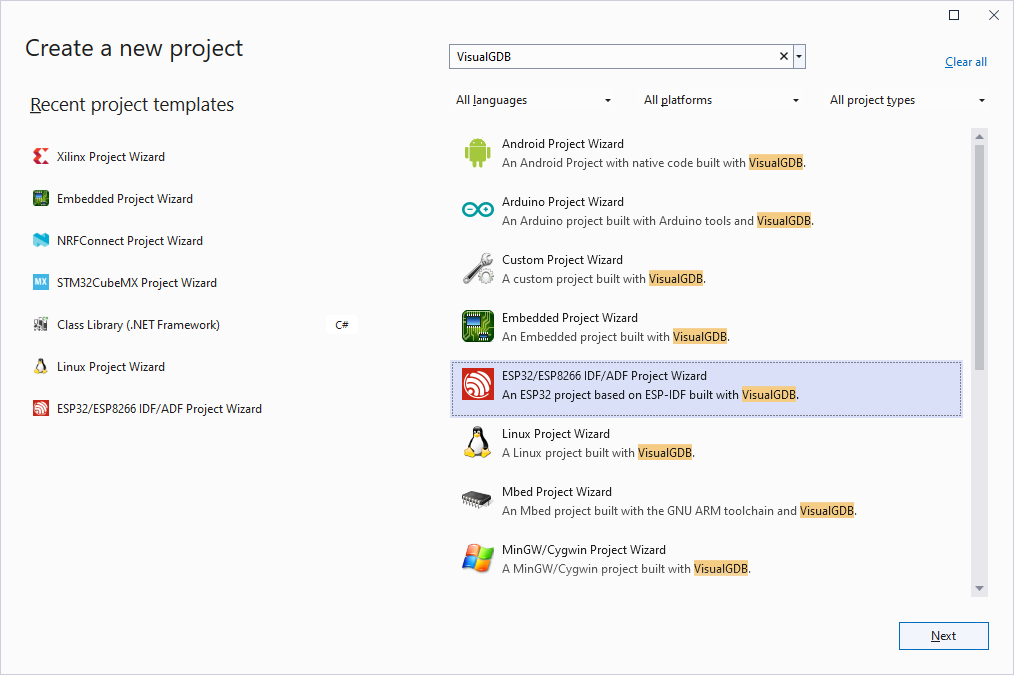
- Start Visual Studio and open the VisualGDB ESP32 IDF/ADF Project Wizard:
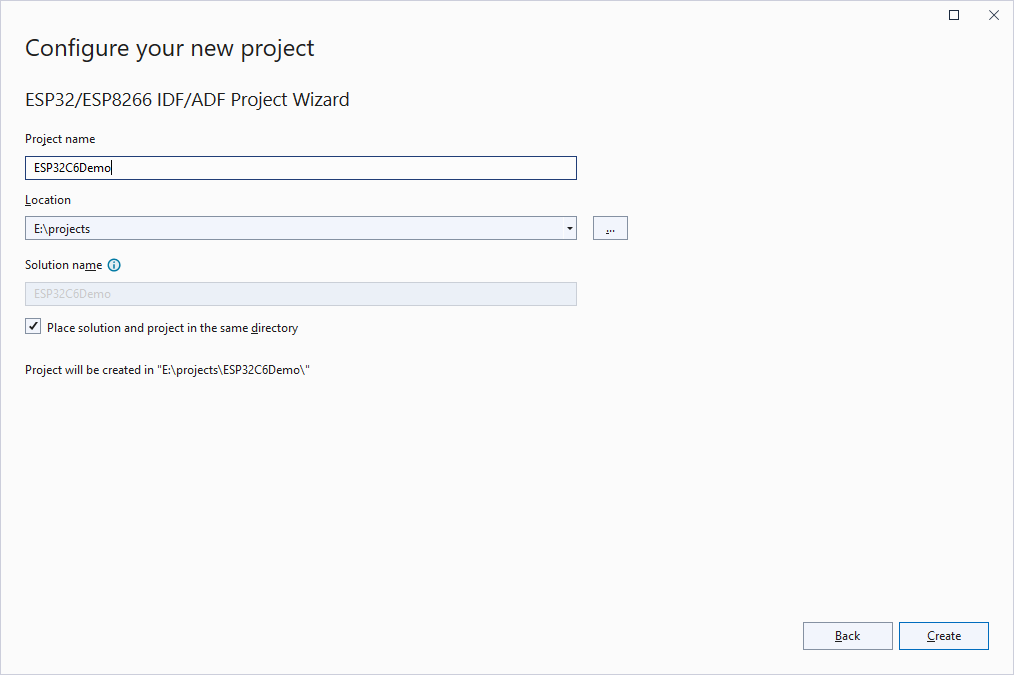
- Enter the name and location for your project:
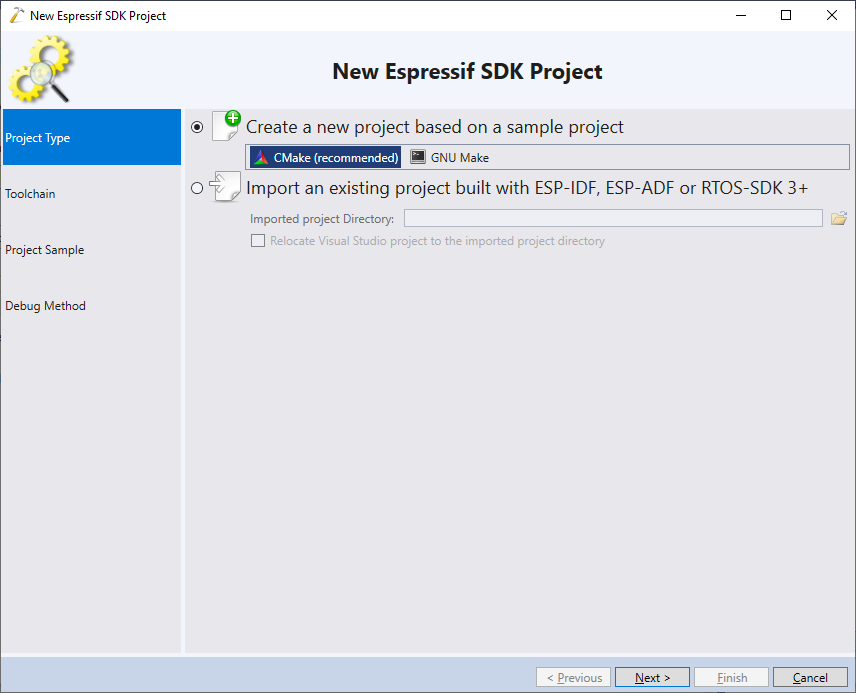
- Select “Create a new project -> CMake (recommended)”:
- On the next page select the ESP32 toolchain and pick the ESP32C6 device:
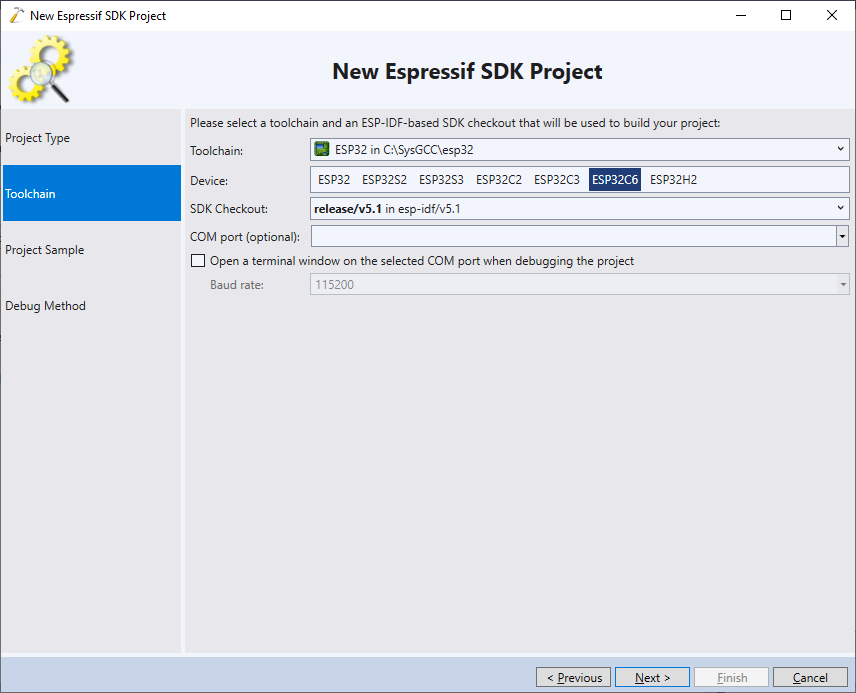 Update: For better compatibility with the latest ESP32 tools, we recommend selecting the consolidated toolchain instead.
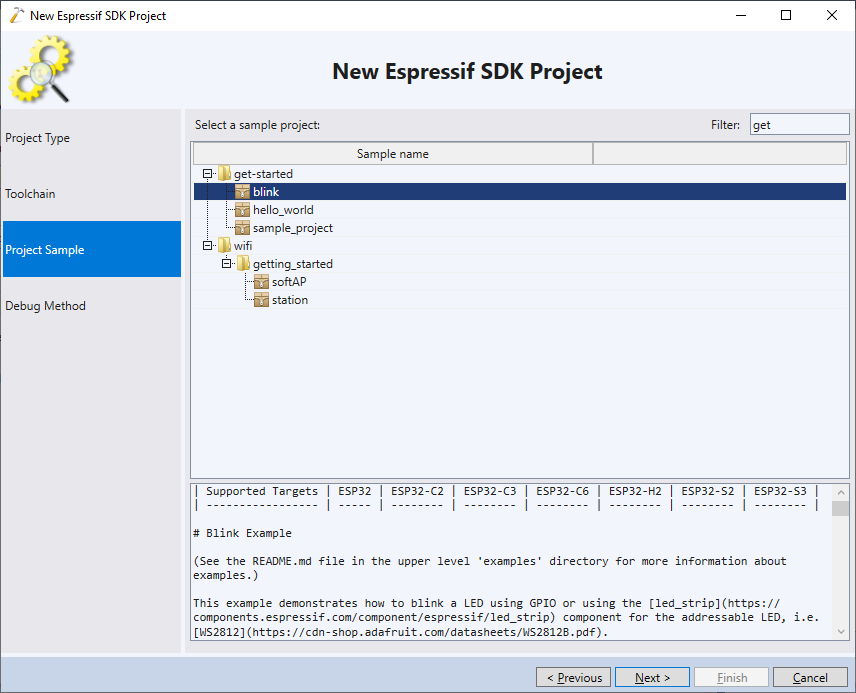
 - Select the sample project you would like to clone. In this tutorial we will use the most basic “Blinking LED” sample:
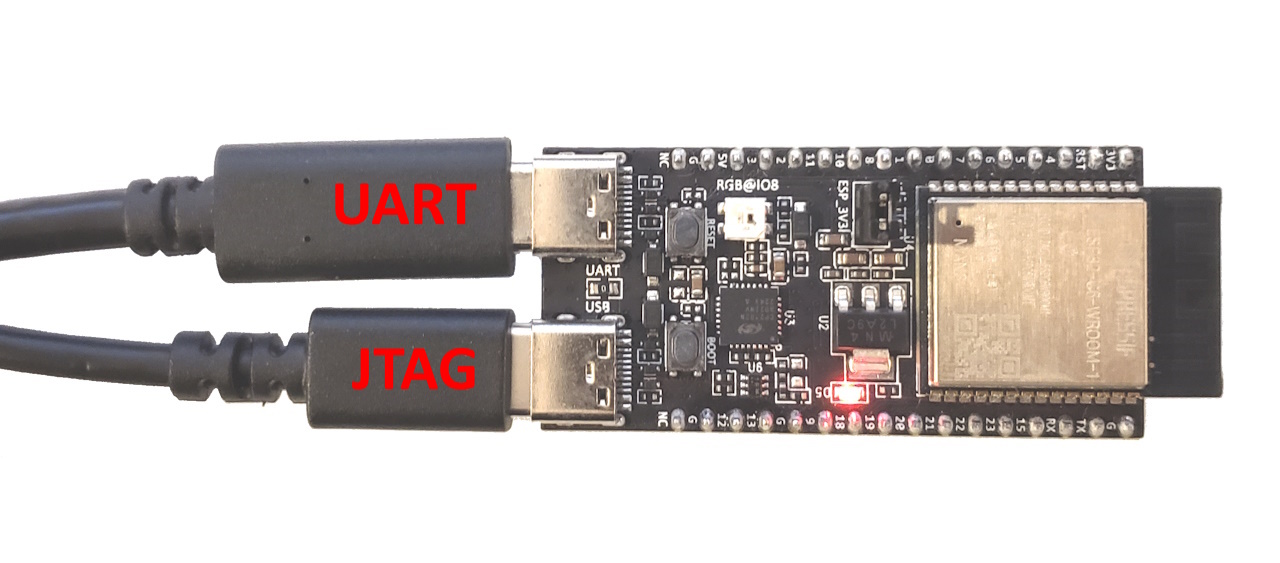
- The ESP32C6-WROOM module shown in this tutorial has an on-board JTAG. Connect it to the USB port, and optionally connect the USB-to-UART port as well:
- VisualGDB will detect the on-board JTAG interface and will suggest using it. Press “Test” to verify that the device responds via JTAG:
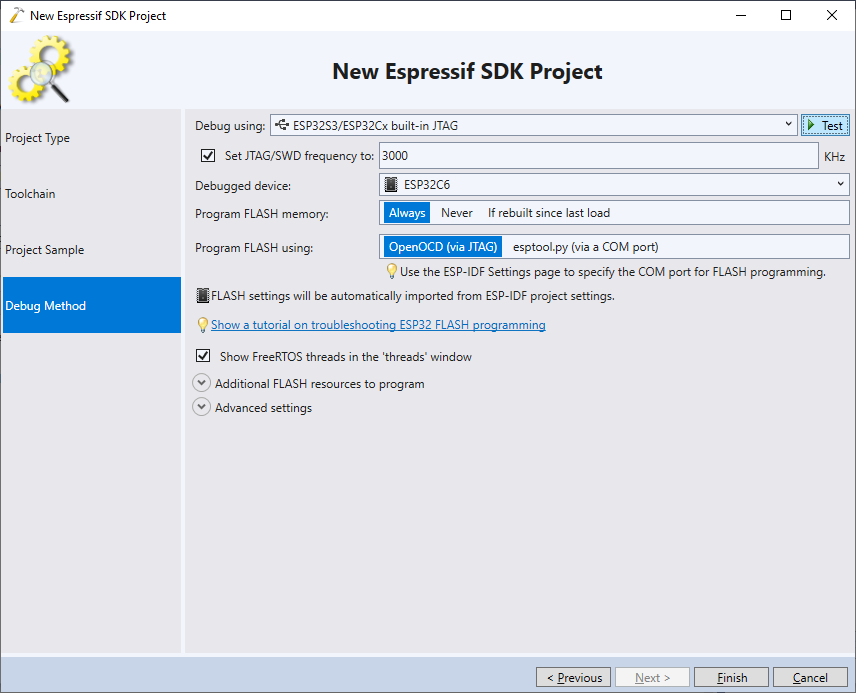
- If the testing fails, make sure you are using the latest OpenOCD (2023-07-13 or later):
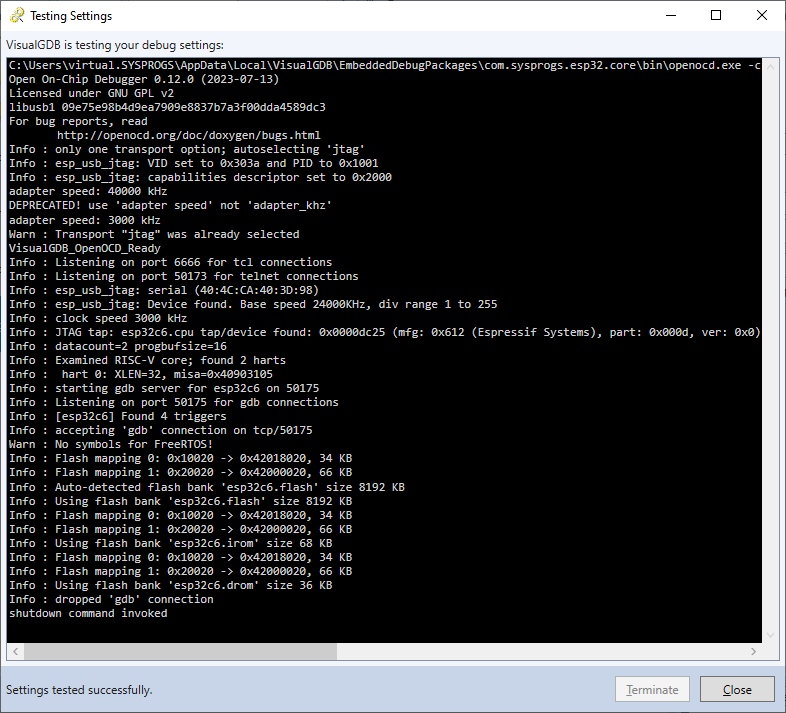 If the device test warns that all device registers are 0, but otherwise succeeds, you can safely ignore the warning and proceed.
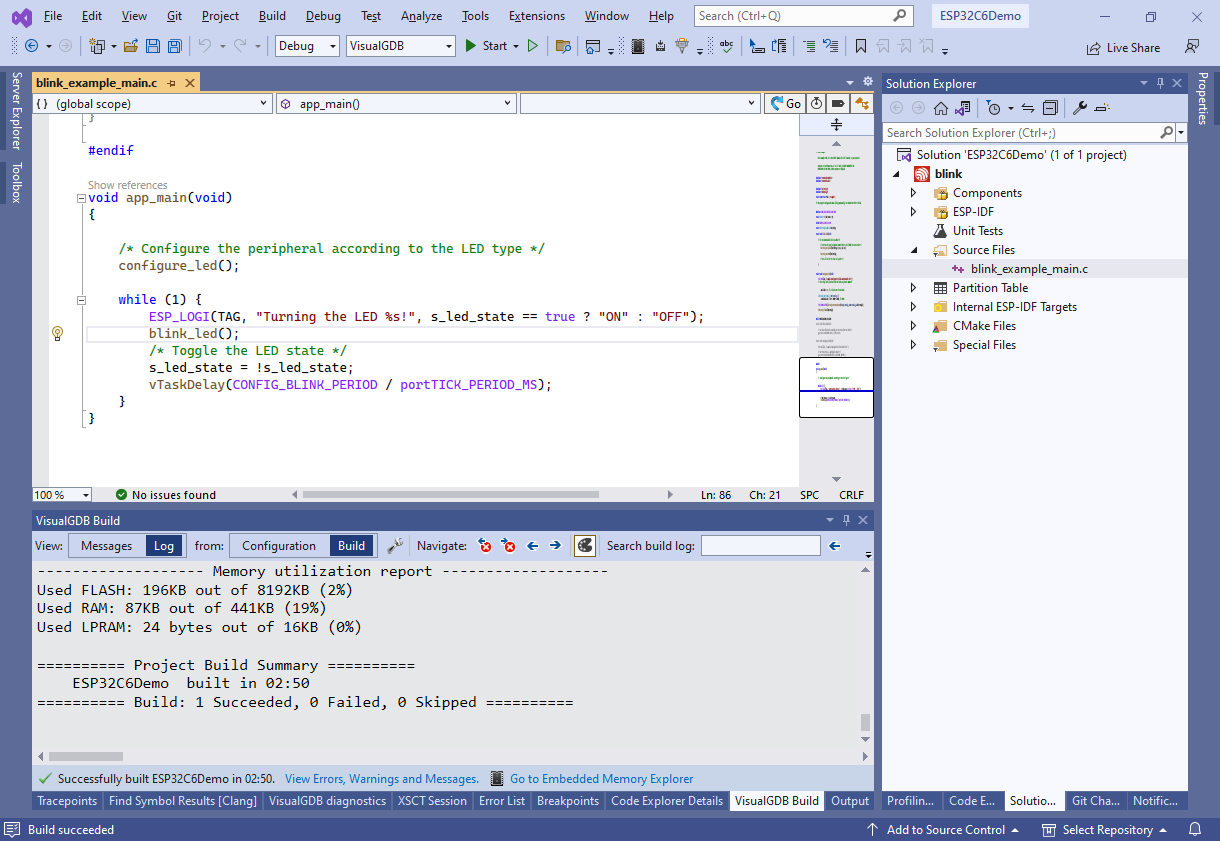
 - Press “Finish” to create the project. Once it is created, press Ctrl-Shift-B to build it:
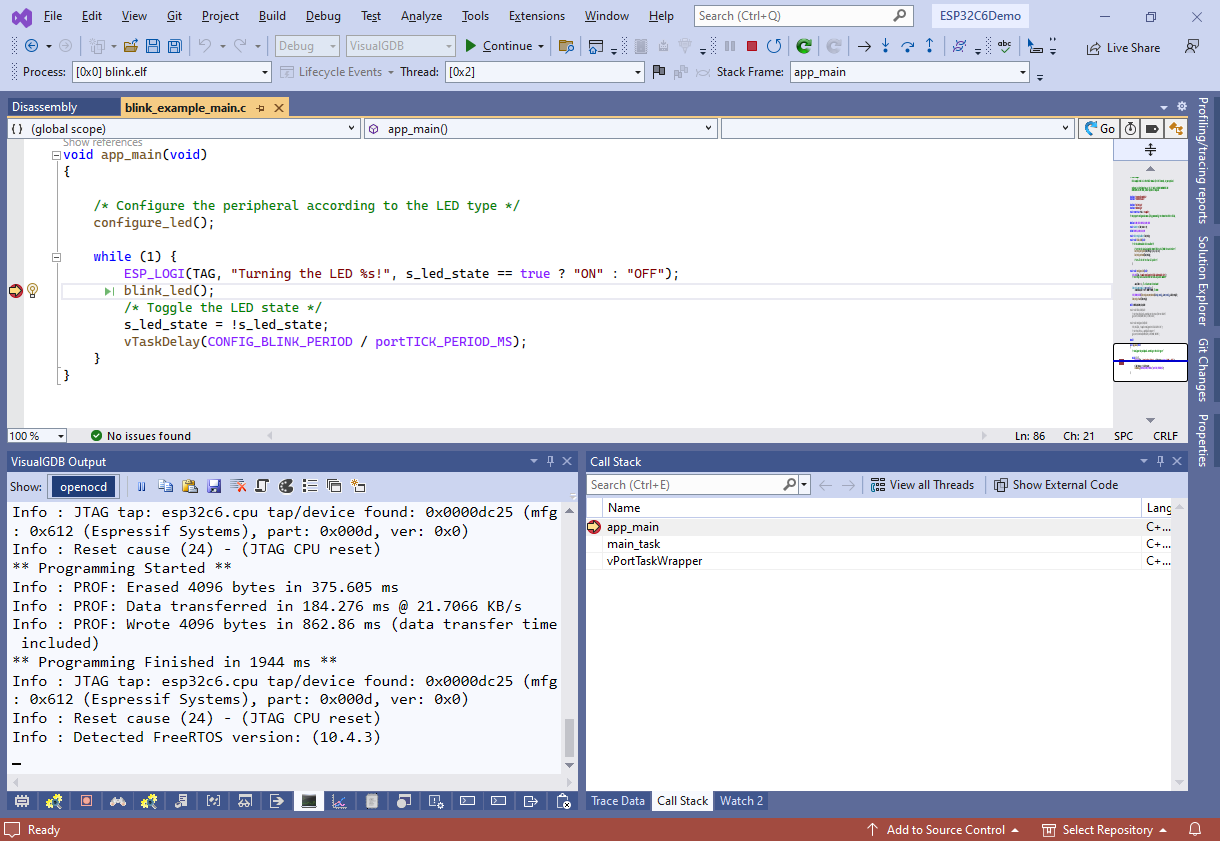
- Set a breakpoint on the call to blink_led() and press F5 to begin debugging. VisualGDB will automatically program the FLASH memory and start the program, triggering the breakpoint:
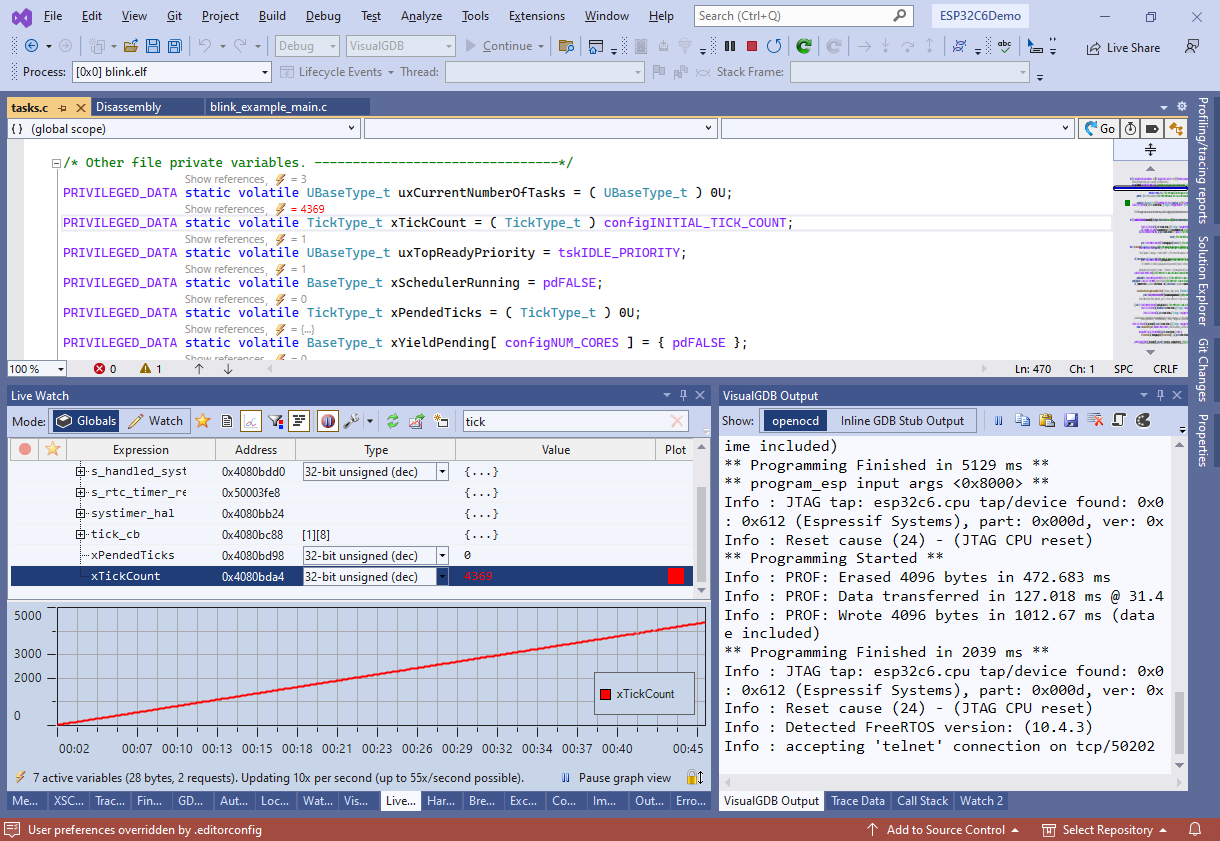
- ESP32-C6 is based on the RISC-V core that supports background memory reads. Hence, you can use the Live Watch window to view the state of various variables without stopping the target:
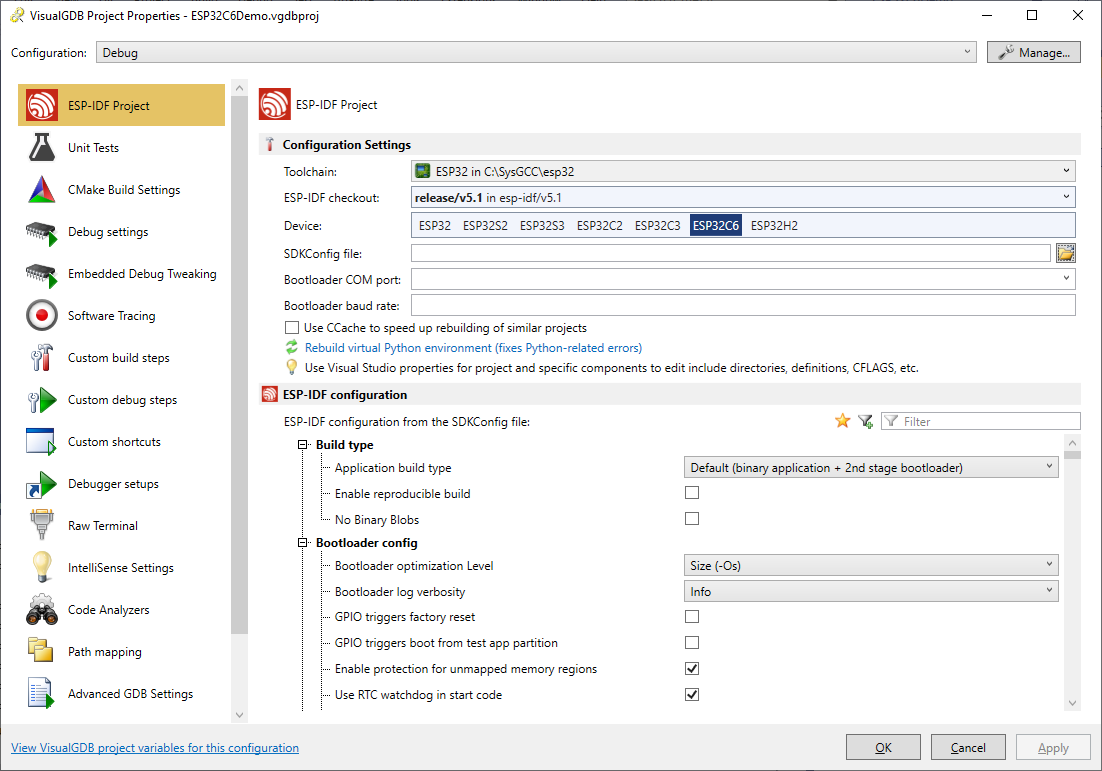
- You can use the VisualGDB Project Properties window to edit various project settings. E.g. you can conveniently edit the ESP-IDF configuration values:
