Using Live Tracing to Record Firmware Behavior
This tutorial shows how to use VisualGDB Live Tracing to record the behavior of a simple embedded project. We will create a basic demo application that randomly adds and removes items from 4 simple queues, will let it run until an overflow occurs, and will then use Live Tracing to:
- Create a table of exact enqueue/dequeue actions leading to the overflow
- Plot the queue utilization over time, seeing which item caused each change
- Quickly find the time when a particular item was inserted in the queue
Live Tracing works by patching the firmware to record the selected data in a circular buffer. It does not require changing the source code, or using any special debugging hardware. It runs without stopping the target, is not affected by JTAG latency, and has very minor overhead. It can be used to reconstruct the events leading to a crash, create reference recordings of data-heavy scenarios (e.g. USB packets), or see what the program is doing in real time without ever having to stop it in the debugger.
Live tracing is supported starting from VisualGDB 6.0 and requires the Custom edition or higher.
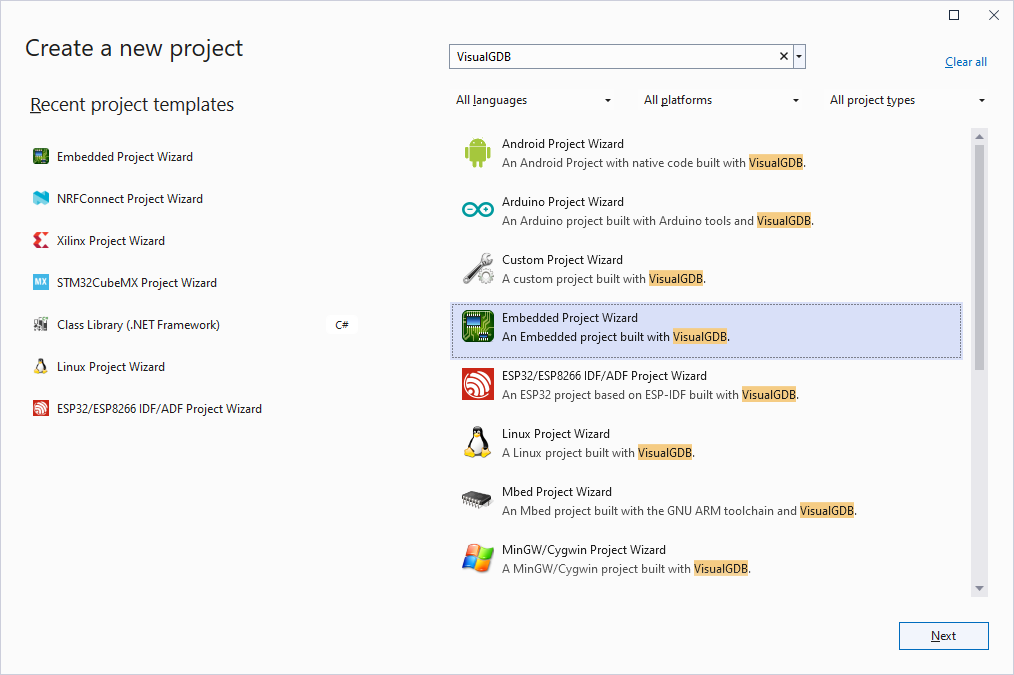
- Launch Visual Studio and begin creating a new Embedded Project:
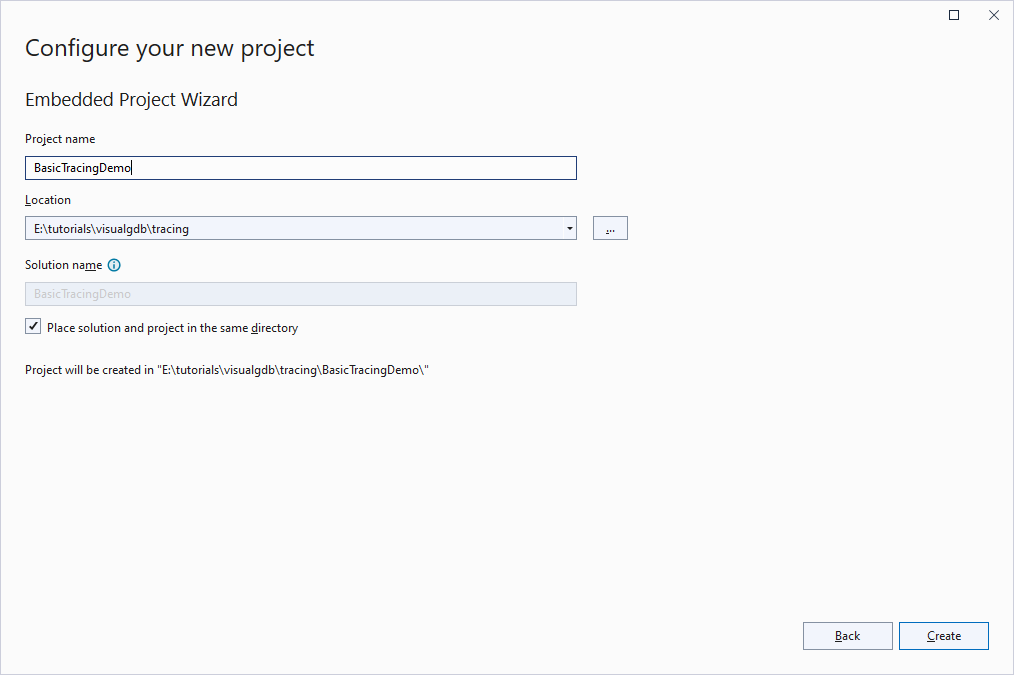
- Enter the name and location for your project:
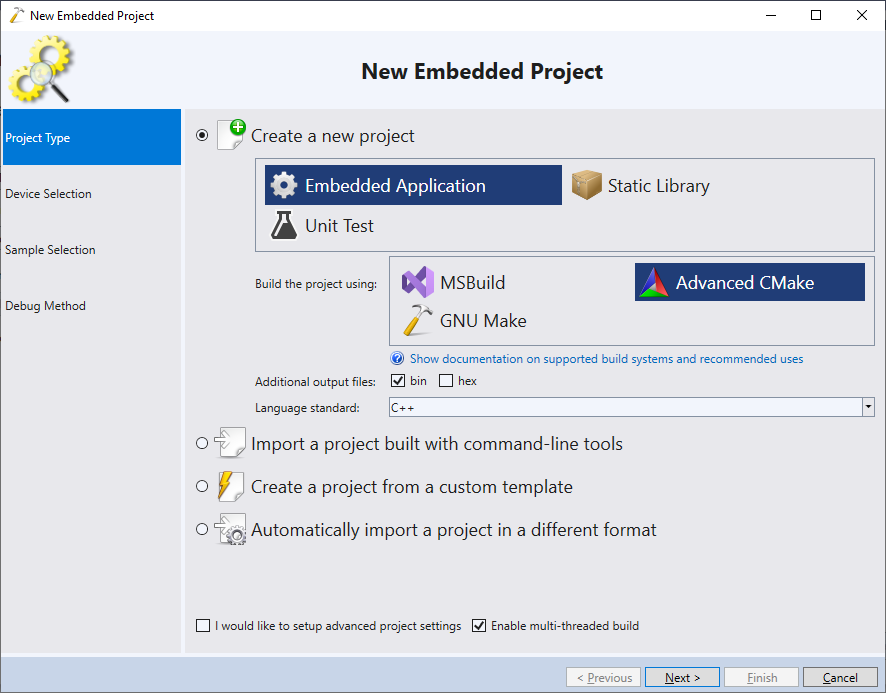
- In this tutorial we will use the most basic setup possible, so proceed with creating a regular Embedded Application using Advanced CMake:
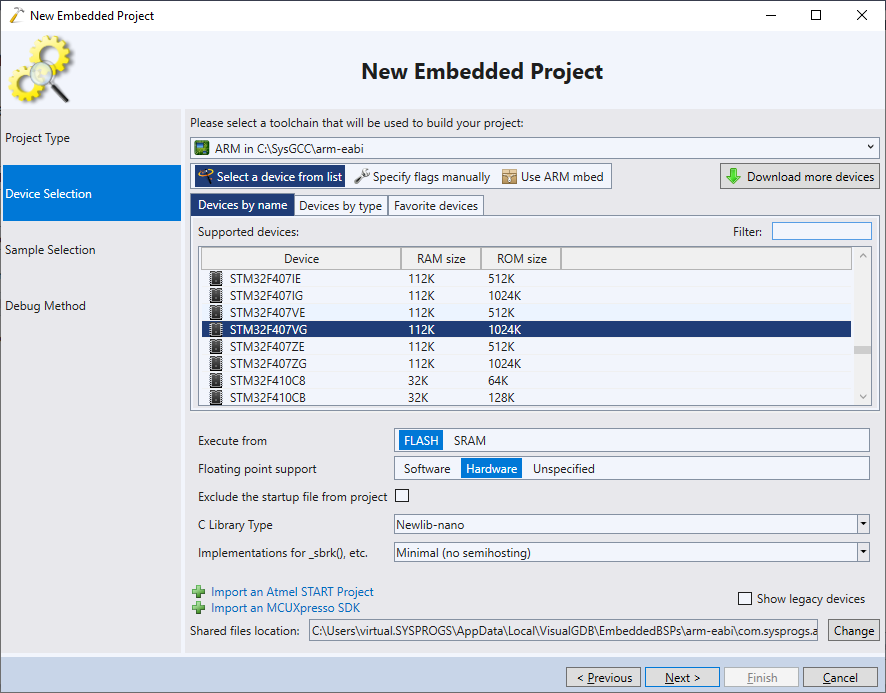
- Select the toolchain and device you would like to target:
- Proceed with the most basic “LEDBlink (HAL)” sample:
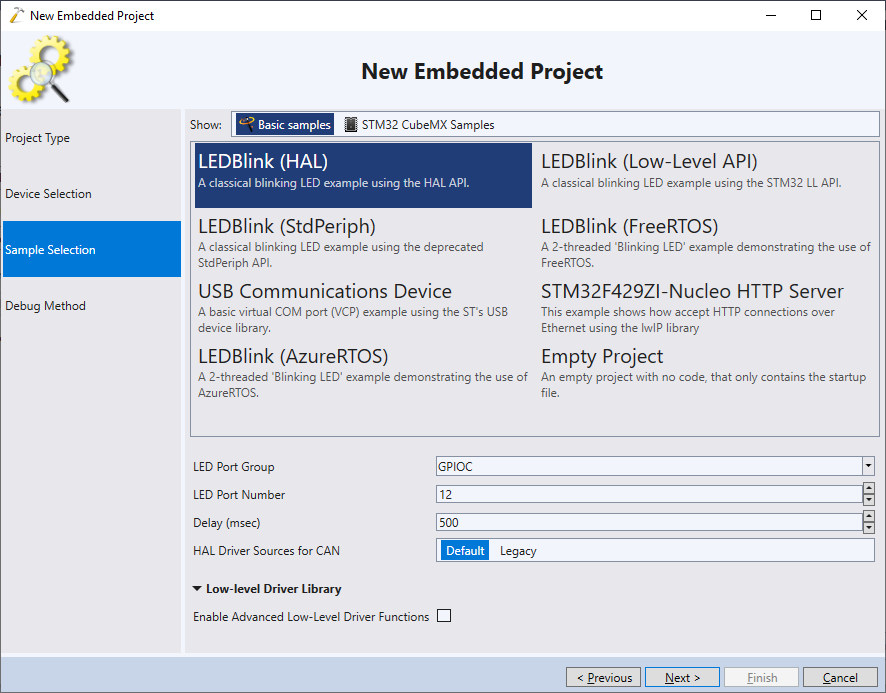
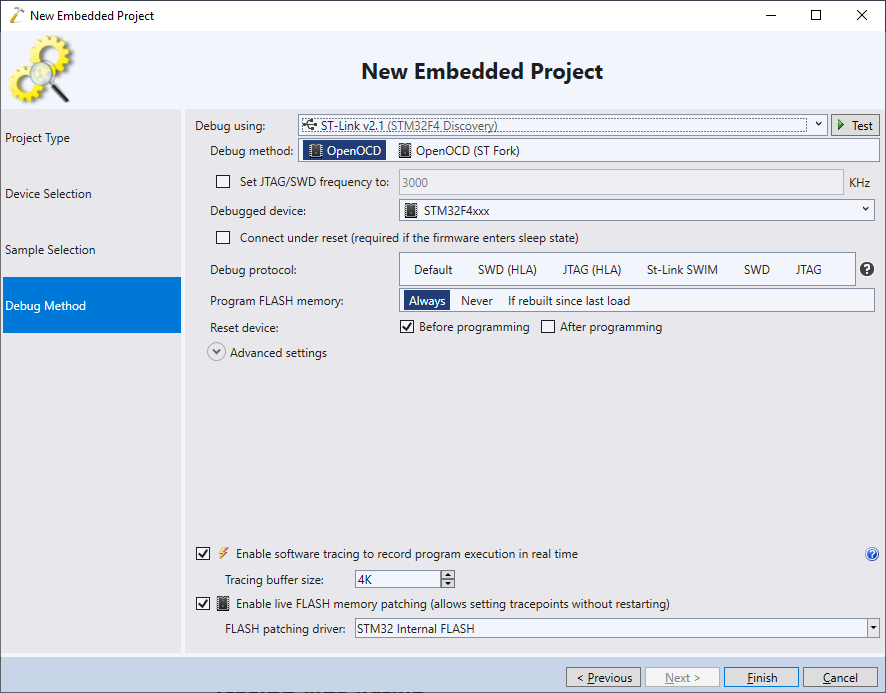
- Finally, select the debugging settings that work with your device and ensure the “Enable software tracing” checkbox at the bottom of the page is checked. Then click “Finish” to create the project:
- Replace the contents of the main source file with this code. It creates 4 global queues (s_Queues) and keeps randomly inserting and removing items from them (EnqueueTestItem() and DequeueItem()) until the total number of allocated items exceeds 16 (simulating an overflow). Build the project, start debugging it and make sure the “bkpt 255” line triggers a breakpoint:
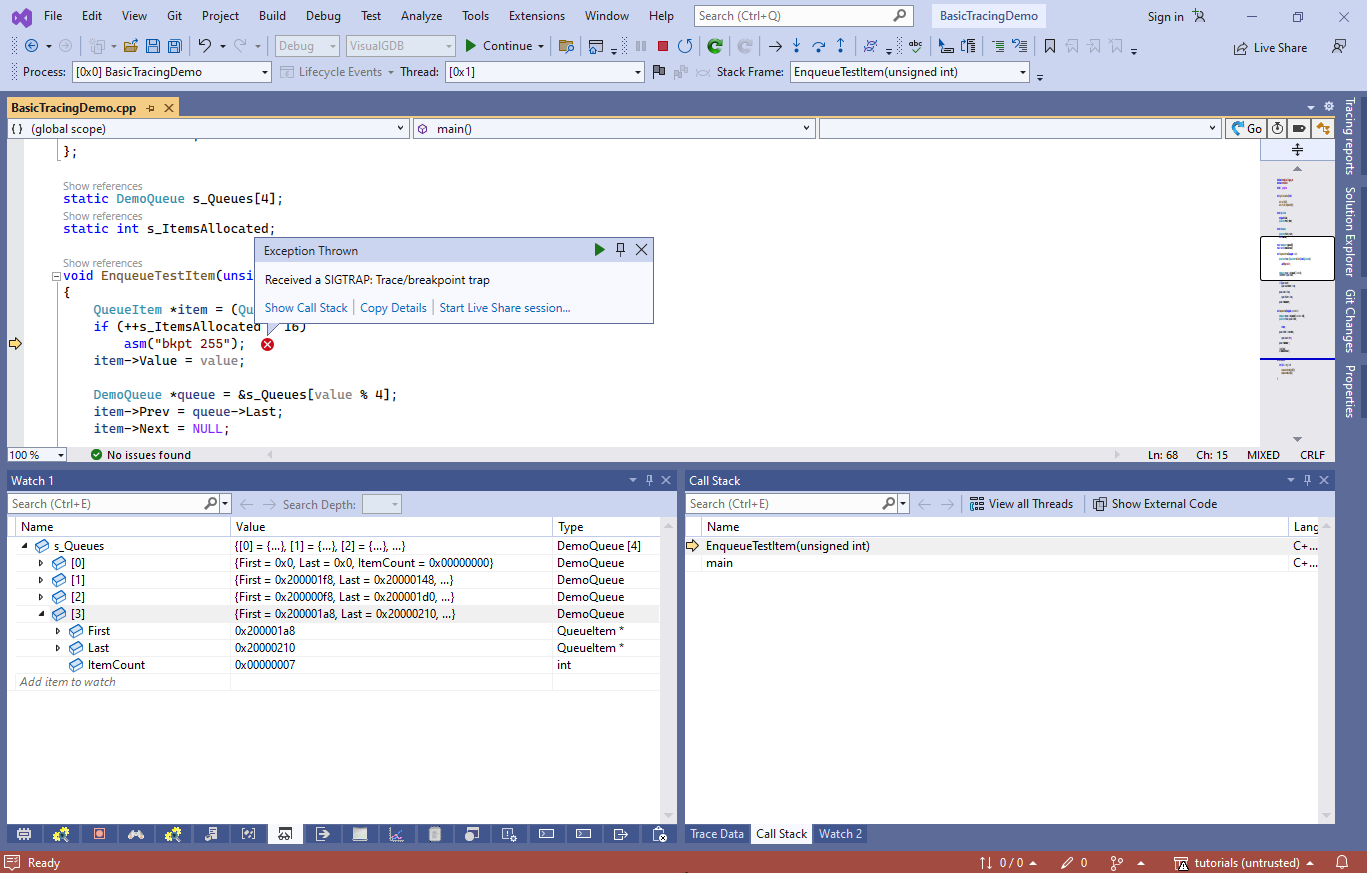 If you use the classical debugging functionality (call stack, watch), you can view the current state of the queues (e.g. how many items have been inserted in each one), however it doesn’t show how we arrived at this state.
 - Live Tracing will do exactly that – show what the program was doing before the breakpoint was hit. Open the VisualGDB Project Properties, go to the Software Tracing page and ensure the “Enable software tracing” checkbox is checked:
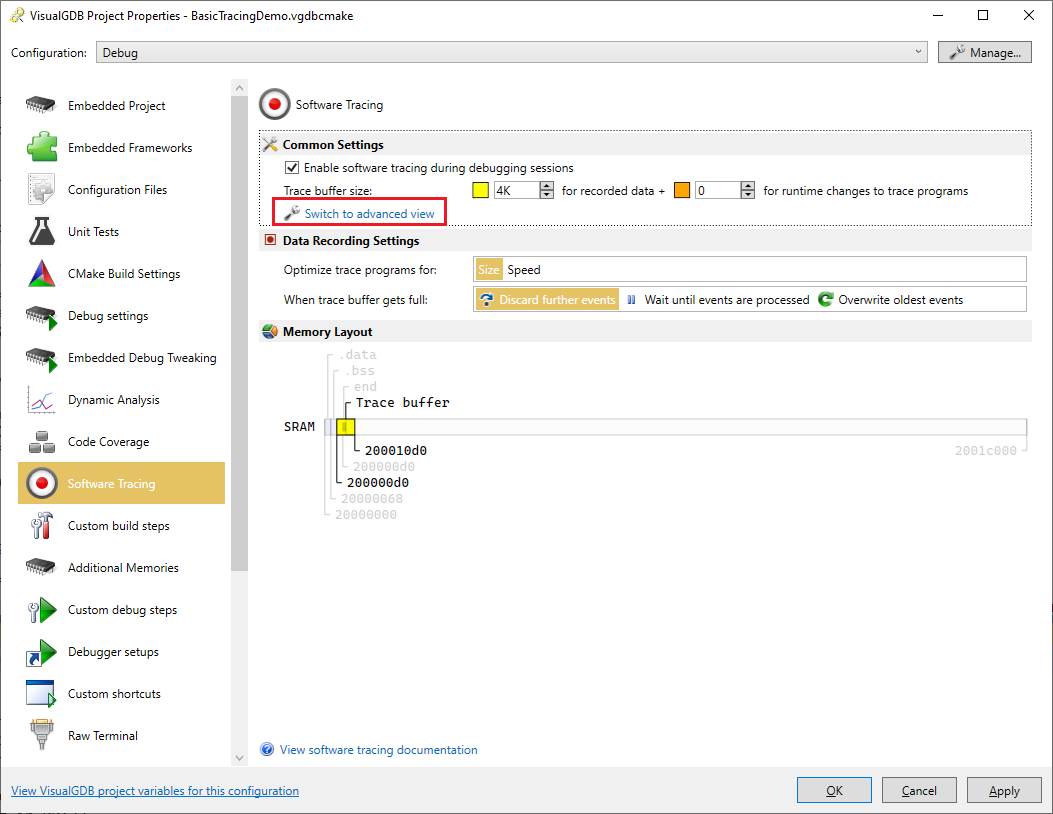
- You can switch to the Advanced view to fine-tune various tracing parameters (e.g. where exactly to place the traced data and how to hook the vector table), although the default settings should work for most cases:
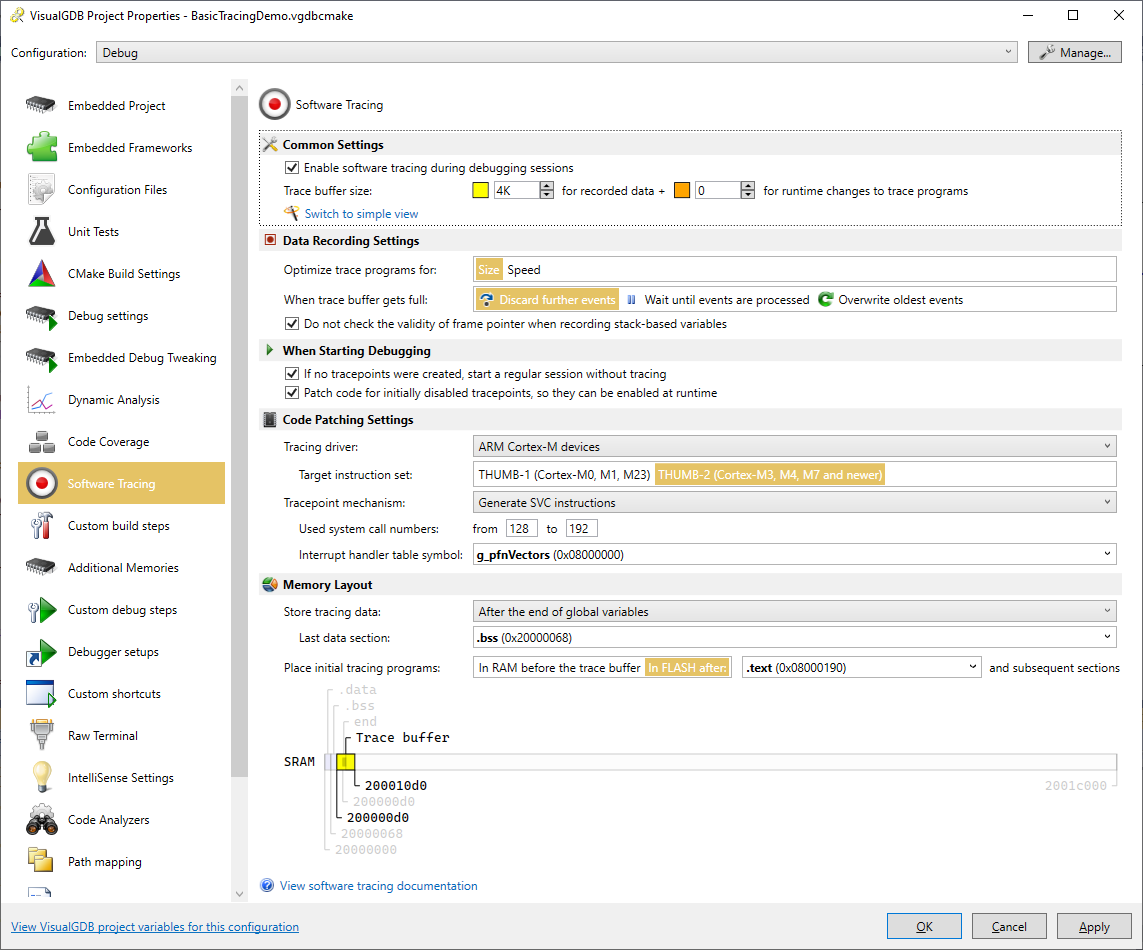 We advise enabling the relocation record output (doesn’t affect the actual firmware) so that VisualGDB can double-check that the generated tracing code won’t overlap anything in the original image.
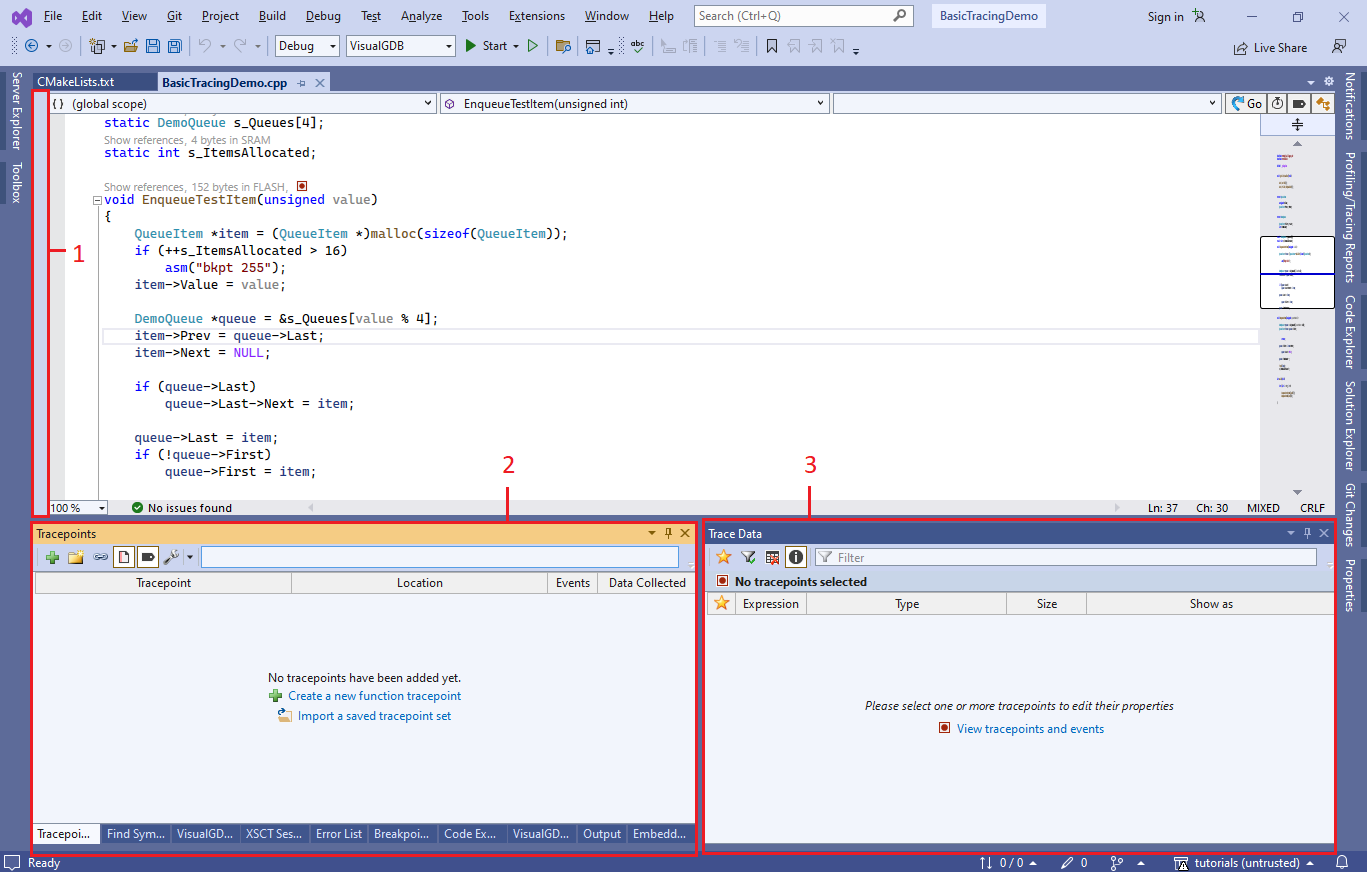
 - Once the tracing has been enabled, VisualGDB will show 3 additional views:
- Tracepoint bar (1)
- Tracepoint list (2) that can be opened via Debug->Windows->Tracepoints
- Trace data view (3) that opens when you select a tracepoint in the tracepoint list
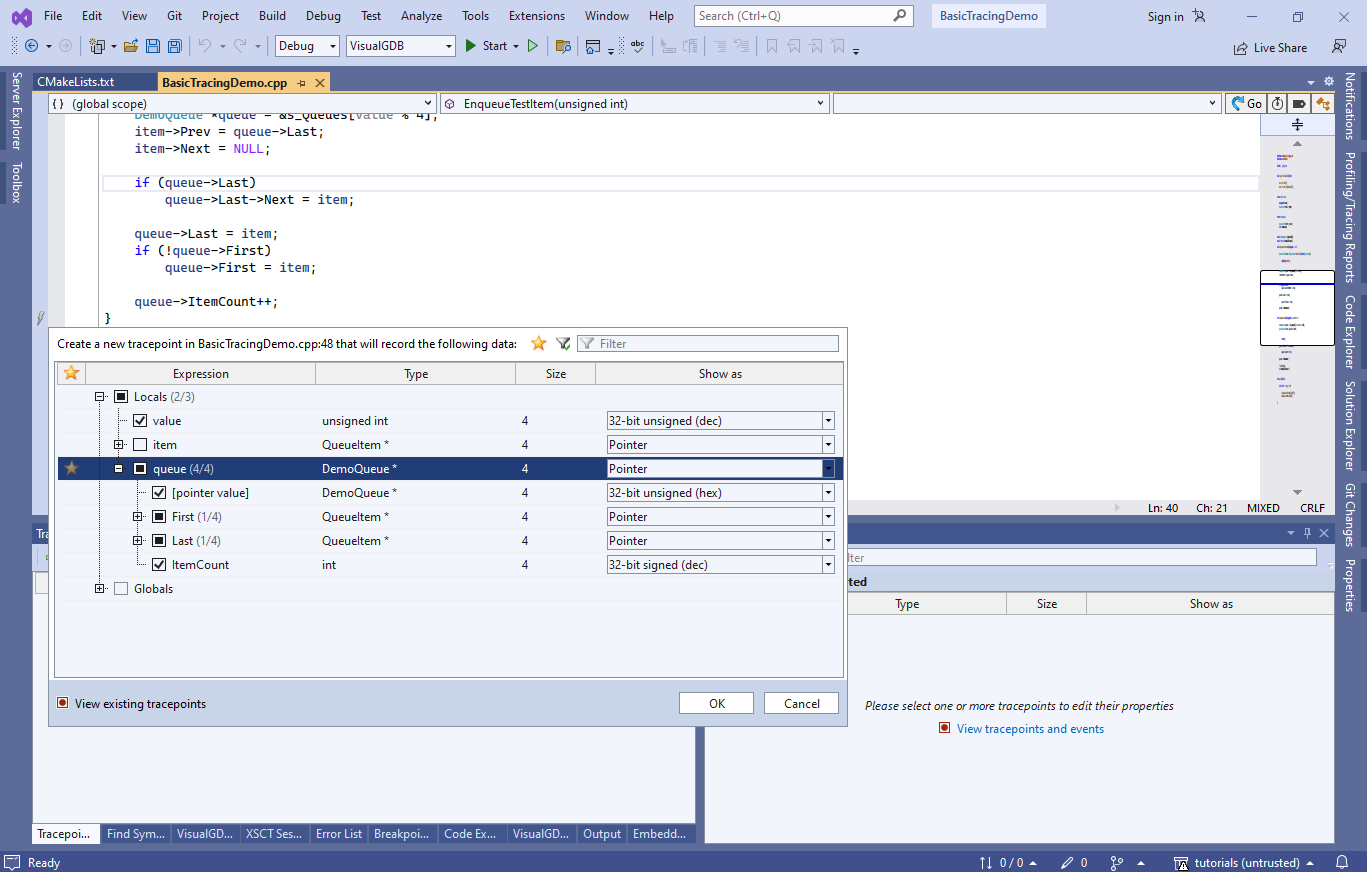
- You can use the tracepoint list to quickly trace arbitrary functions, however in this tutorial we will focus on using the tracepoint bar. Click on the last line of the EnqueueTestItem() function and select to trace value and queue:
- Similarly, put one more tracepoint at the return statement in DequeueItem() and another one at the call to free(). Trace queueNumber, queue and item variables from each of them. You can always use the Tracepoints window to see the list of current tracepoints and change the data they collect:
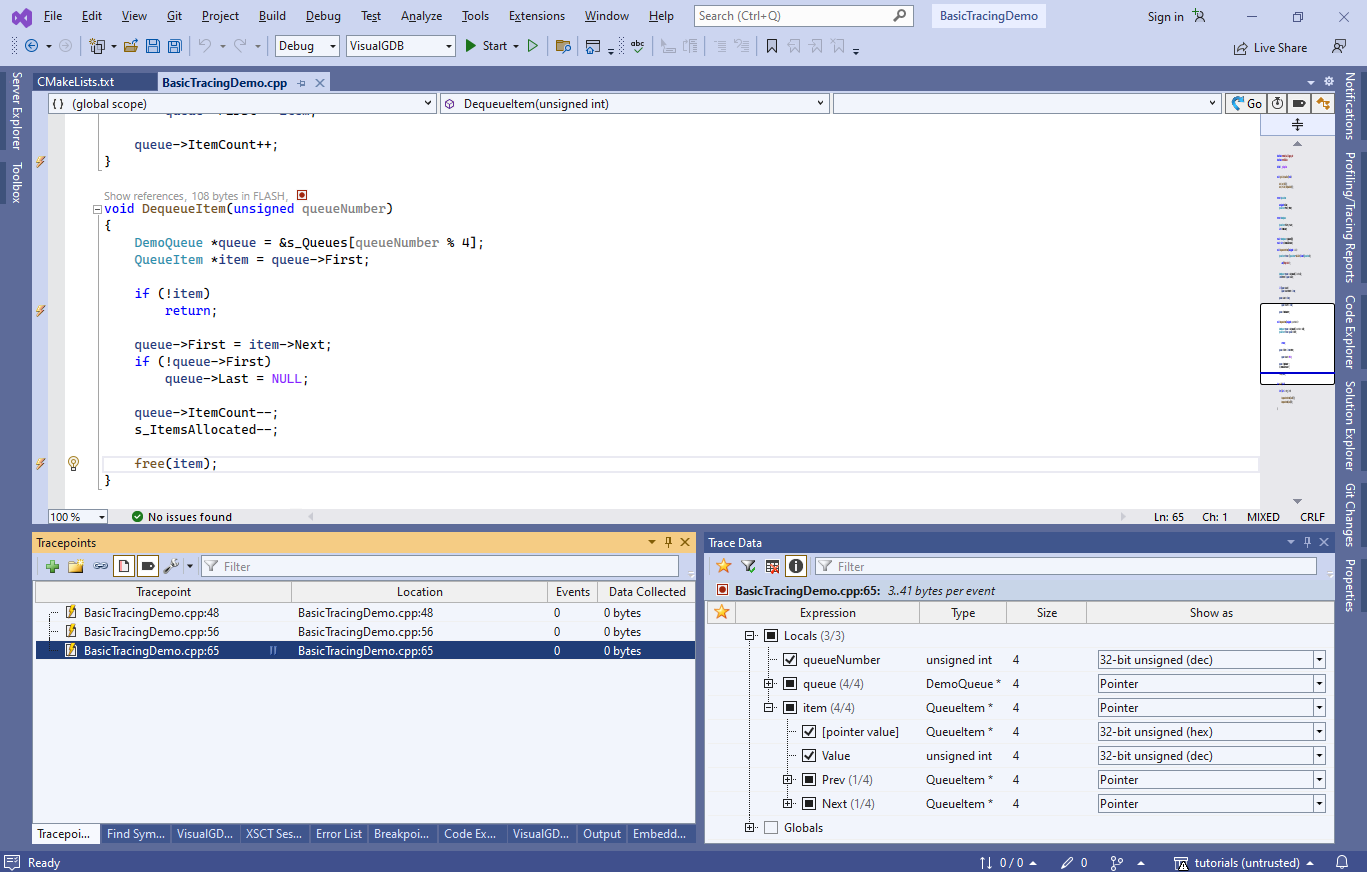
- Double-click in the “Tracepoint” column to give the tracepoints more meaningful names than the file and line number:
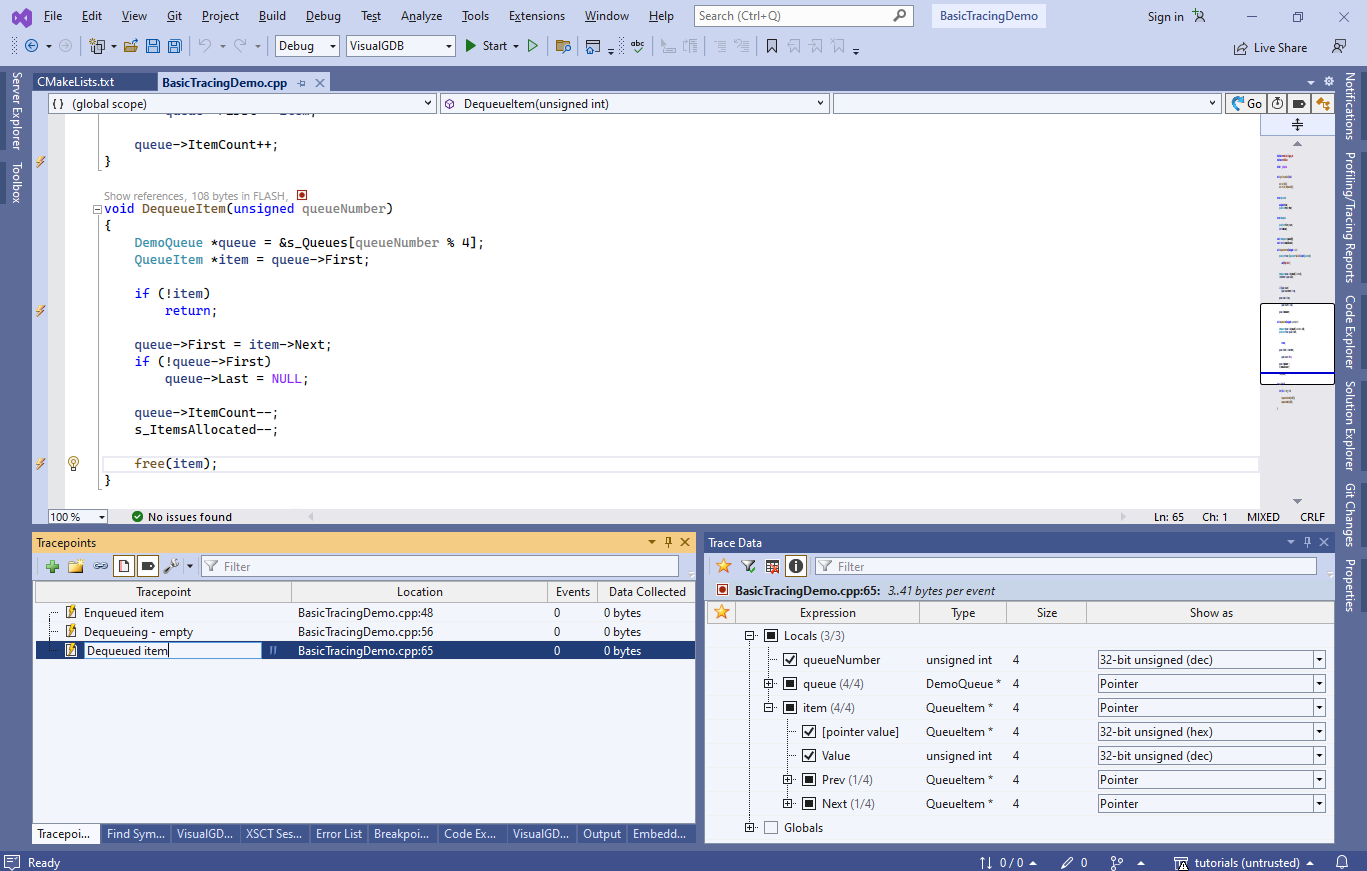
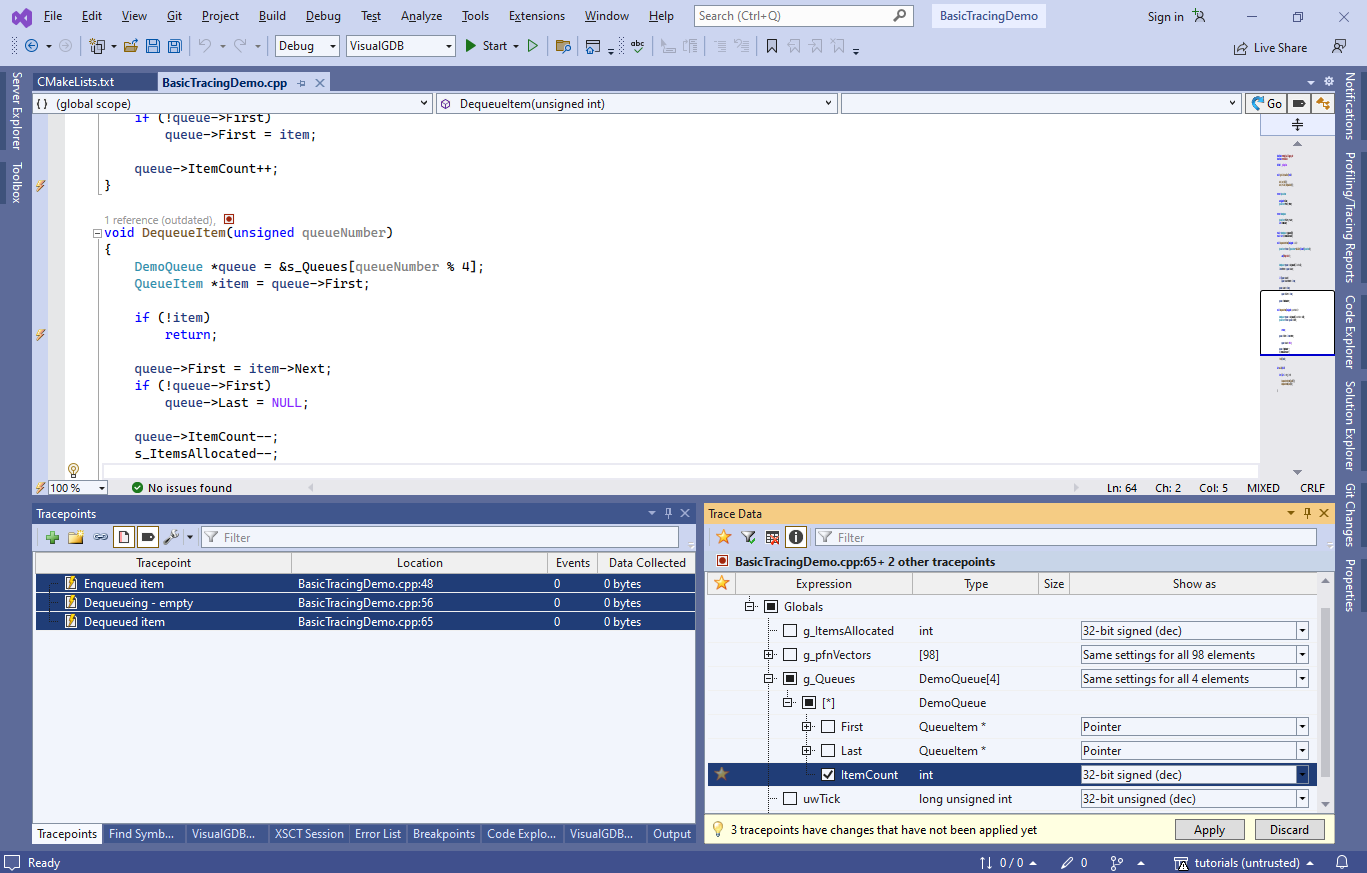
- Select all 3 tracepoints and enable tracing of g_Queues[*].ItemCount in the Trace Data window:
- Now press F5 to begin the debug session. Once the hardcoded breakpoint triggers, open the Events view in the Tracepoints window:
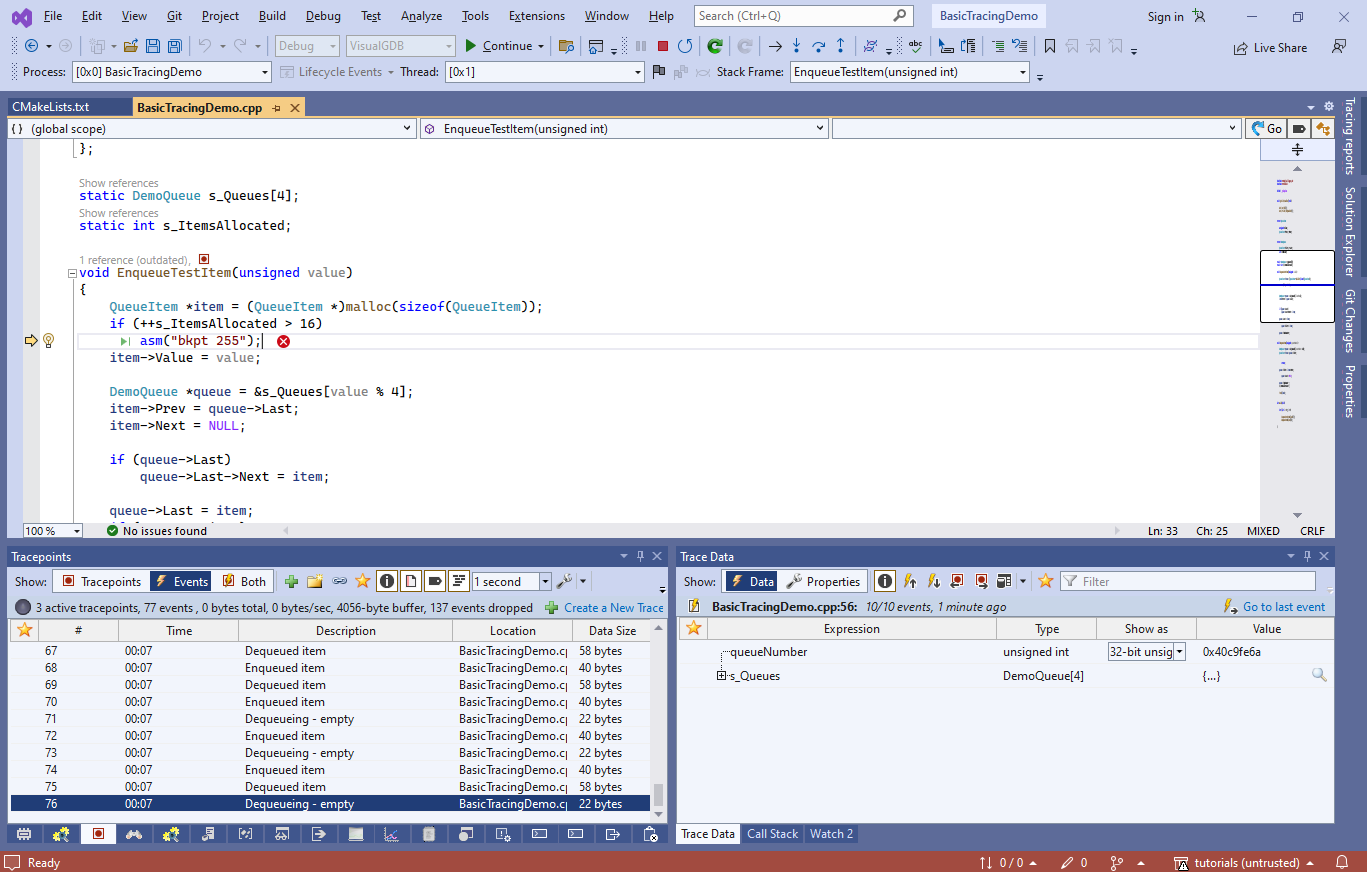
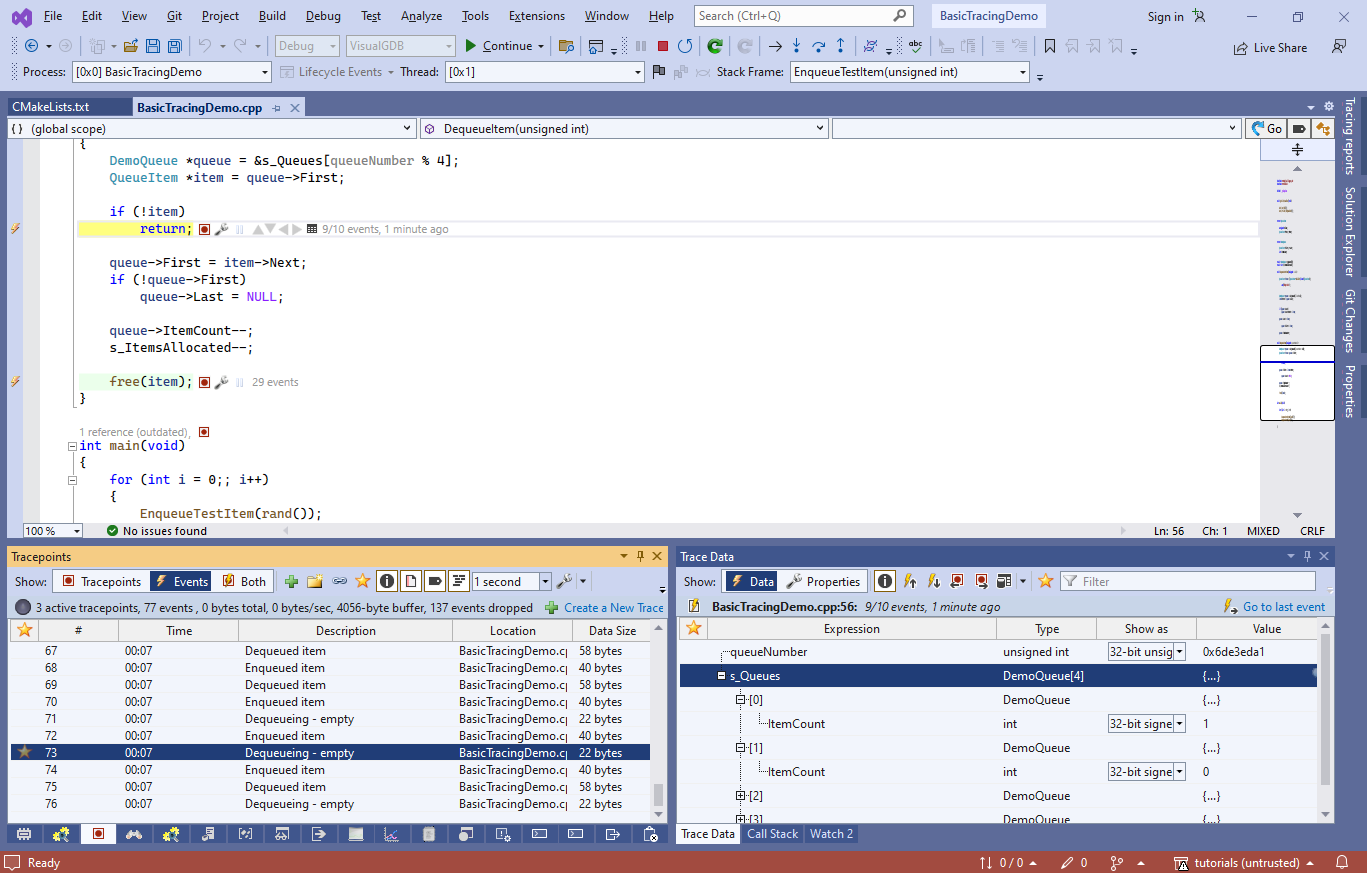
- You can double-click on each event and VisualGDB will show the code location associated with it, as well as the data that was captured when it happened:
 In this example the target is actually stopped at a breakpoint, however tracepoints would work the same way if the target was running. In each case the data was captured, stored in the circular buffer, and the program continued running without any interruption.
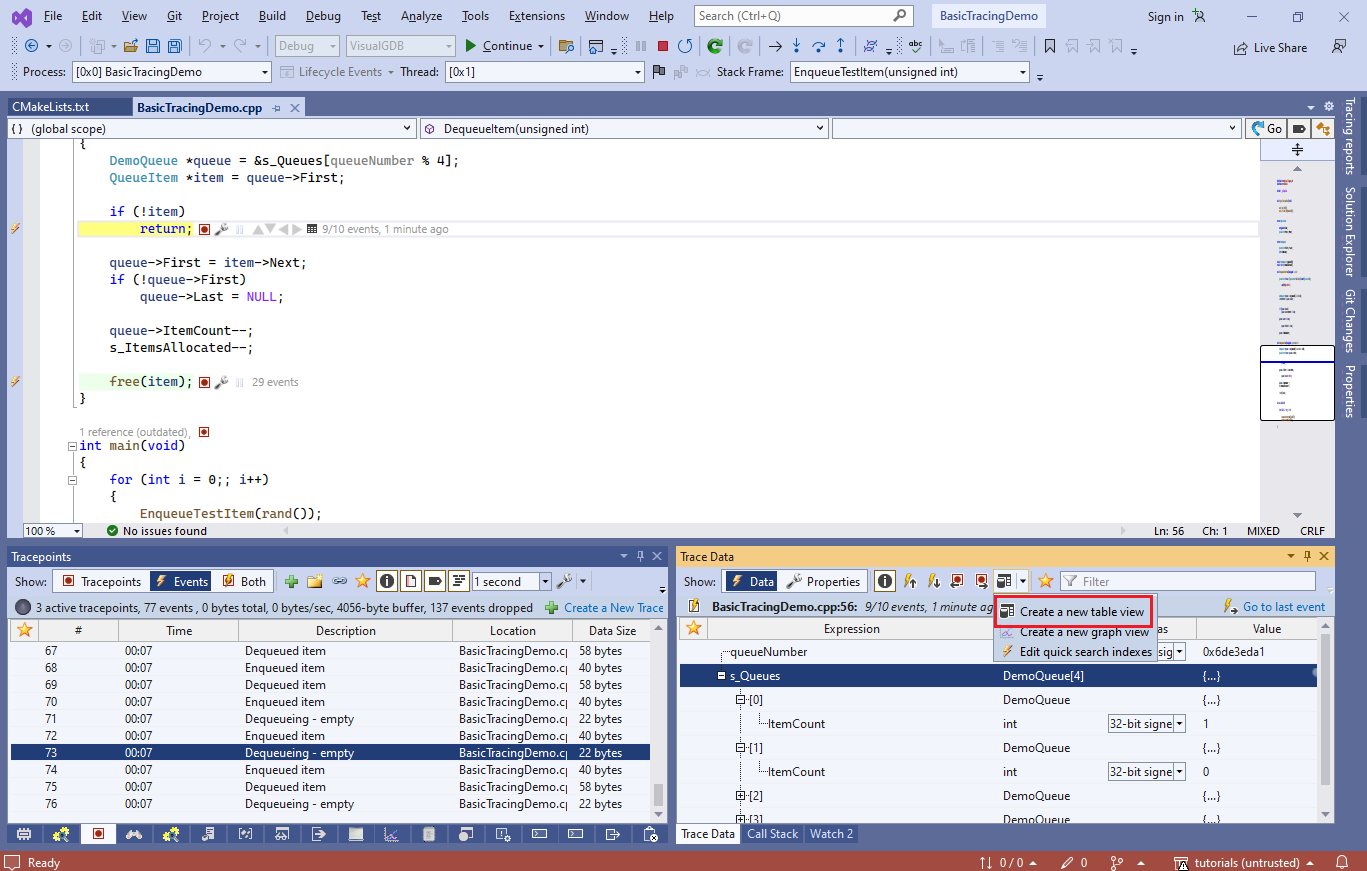
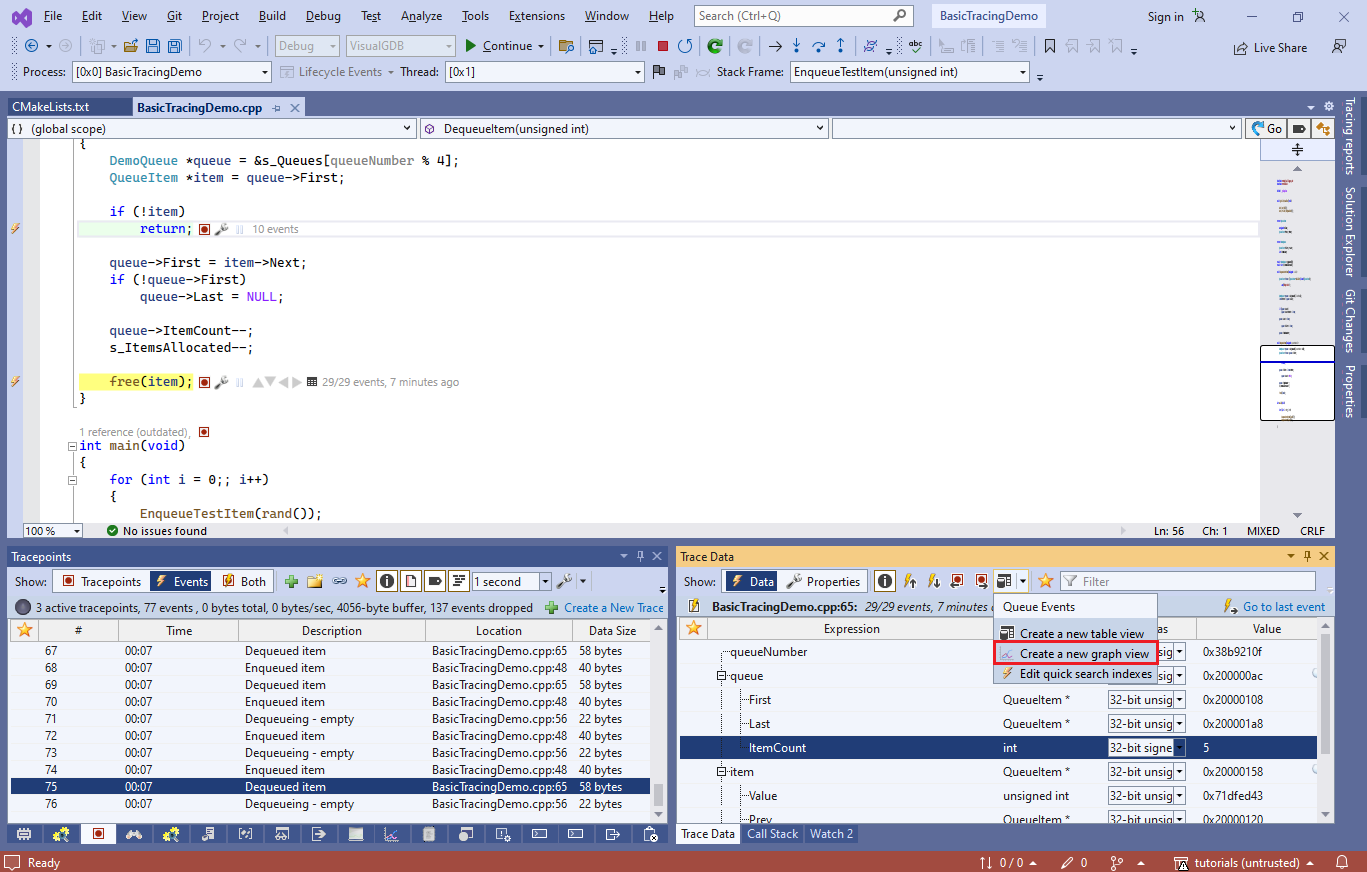
 - Software tracing can quickly produce large quantities of data, so VisualGDB provides a few mechanisms for navigating it easily. The one we will demonstrate first is the table views. Click “Create a new table view” in the Trace Data window:
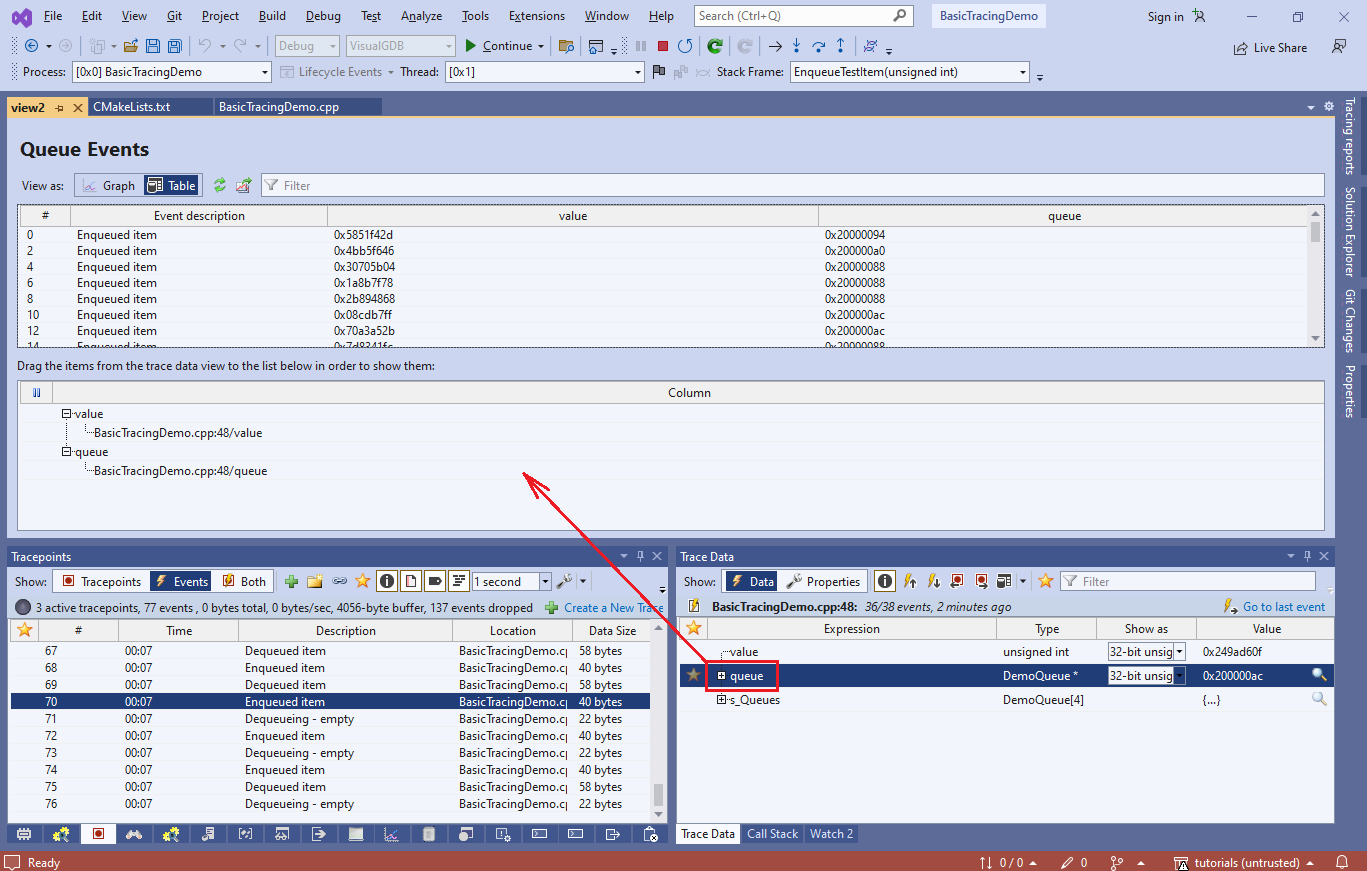
- Rename the view to “Queue Events”, select one of the “Enqueued item” events in the event list, and drag the queue and value nodes into the column list:
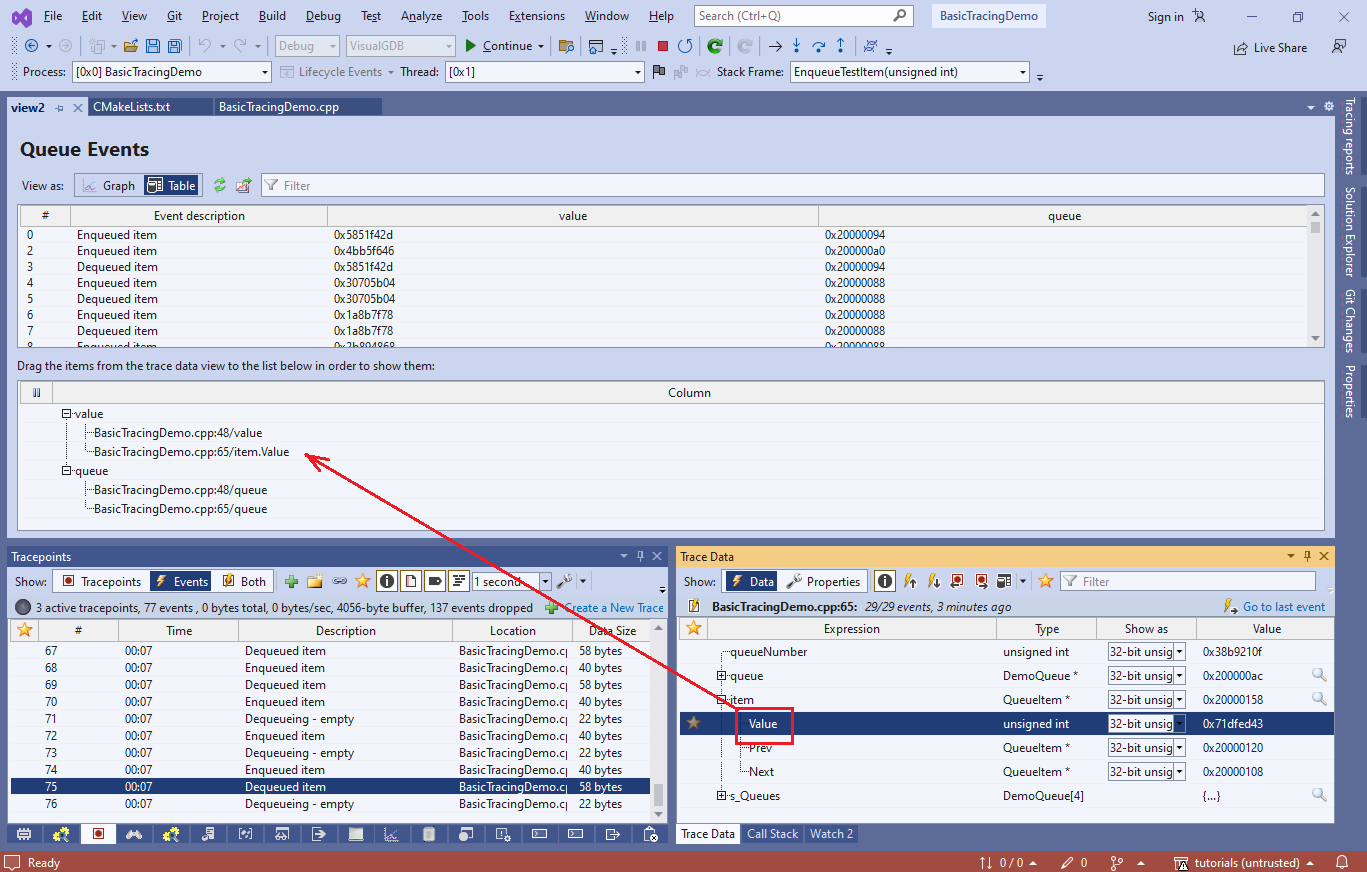
- Select a “Dequeued item” event and drag the queue and item.Value nodes into the same columns:
 Similarly, drag queue.ItemCount. It is important to drag the new items exactly into the same columns, so VisualGDB knows they are interchangeable.
 - Note how the table view now shows both “enqueued” and “dequeued” events, displaying the queue pointer and the value that was added or removed from the queue. You can sort the rows in different ways, or filter them to show a specific queue.
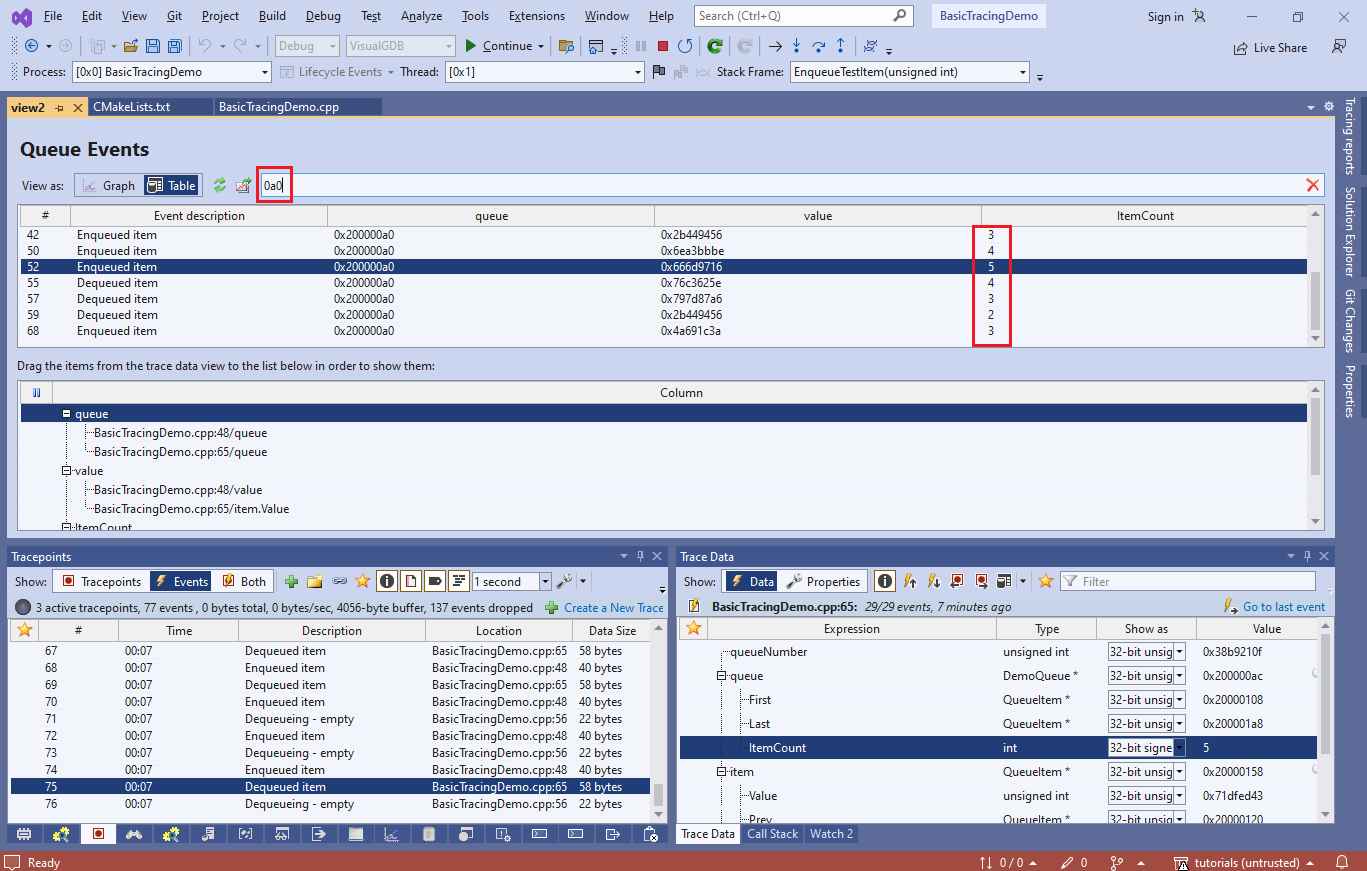 Note how filtering the events clearly shows how ItemCount keeps increasing after each enqueueing, and decreases after each dequeueing.
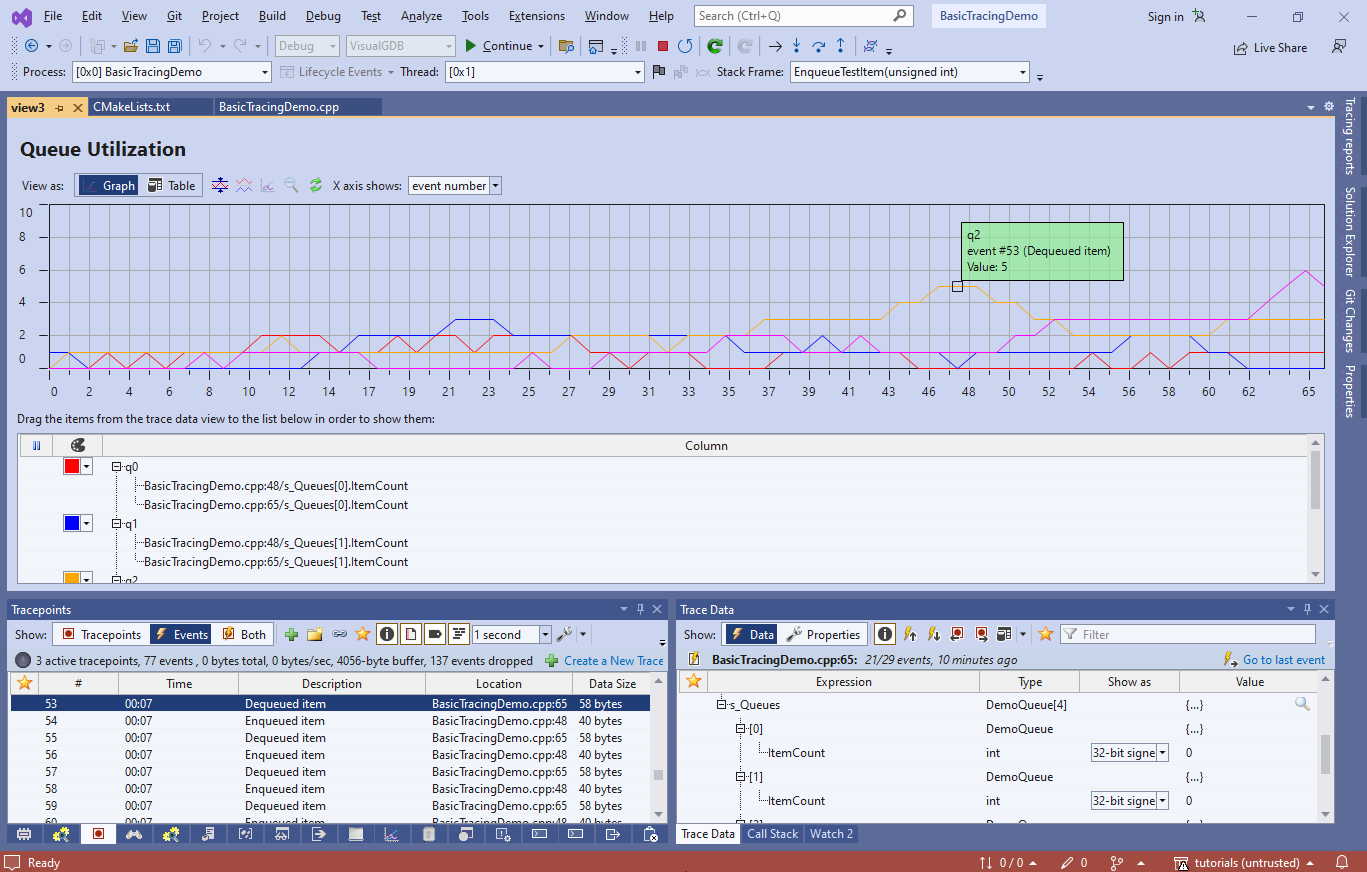
 - Now we will use a table view to plot how the queue utilization changed over time. Click “Create a new graph view” in the Trace Data window:
- Drag the ItemCount nodes for each of the queues into 4 separate columns and rename the columns accordingly. VisualGDB will now plot them so you can see how the utilization was slowly growing over time:
 You can double-click at any point in the graph to quickly jump to that event in the Tracepoints window where you can flag it as favorite, or give it a meaningful name.
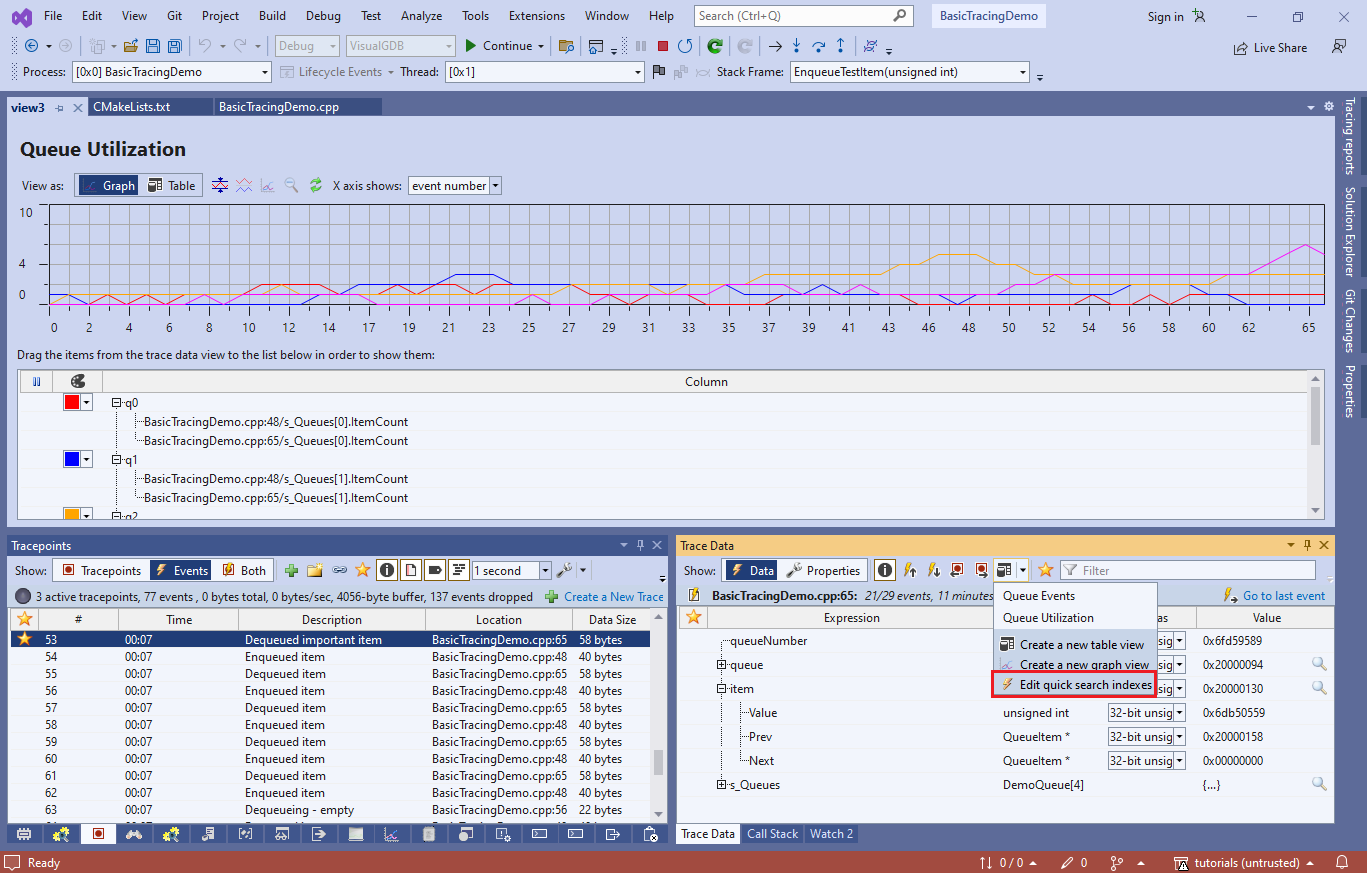
 - Finally, we will show how to easily find related events. Click “Edit quick search indexes” in the Trace Data window:
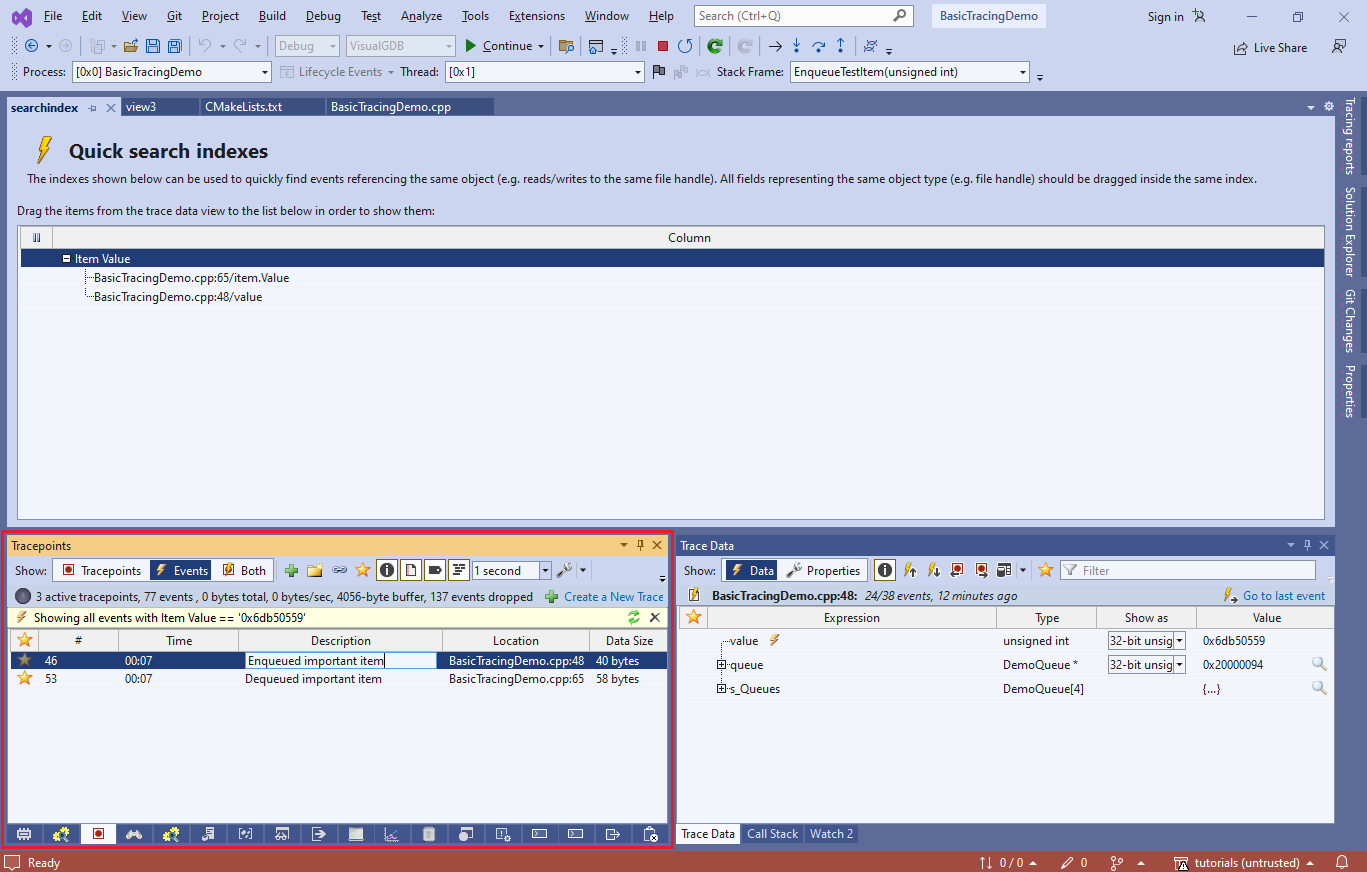
- Drag the item.Value from the “Dequeued” event and “value” from the “Enqueued” one into the same column, so that VisualGDB knows they are interchangeable. Now each time you view either of the 2 event types, VisualGDB will display the lightning symbol near the “value” field:
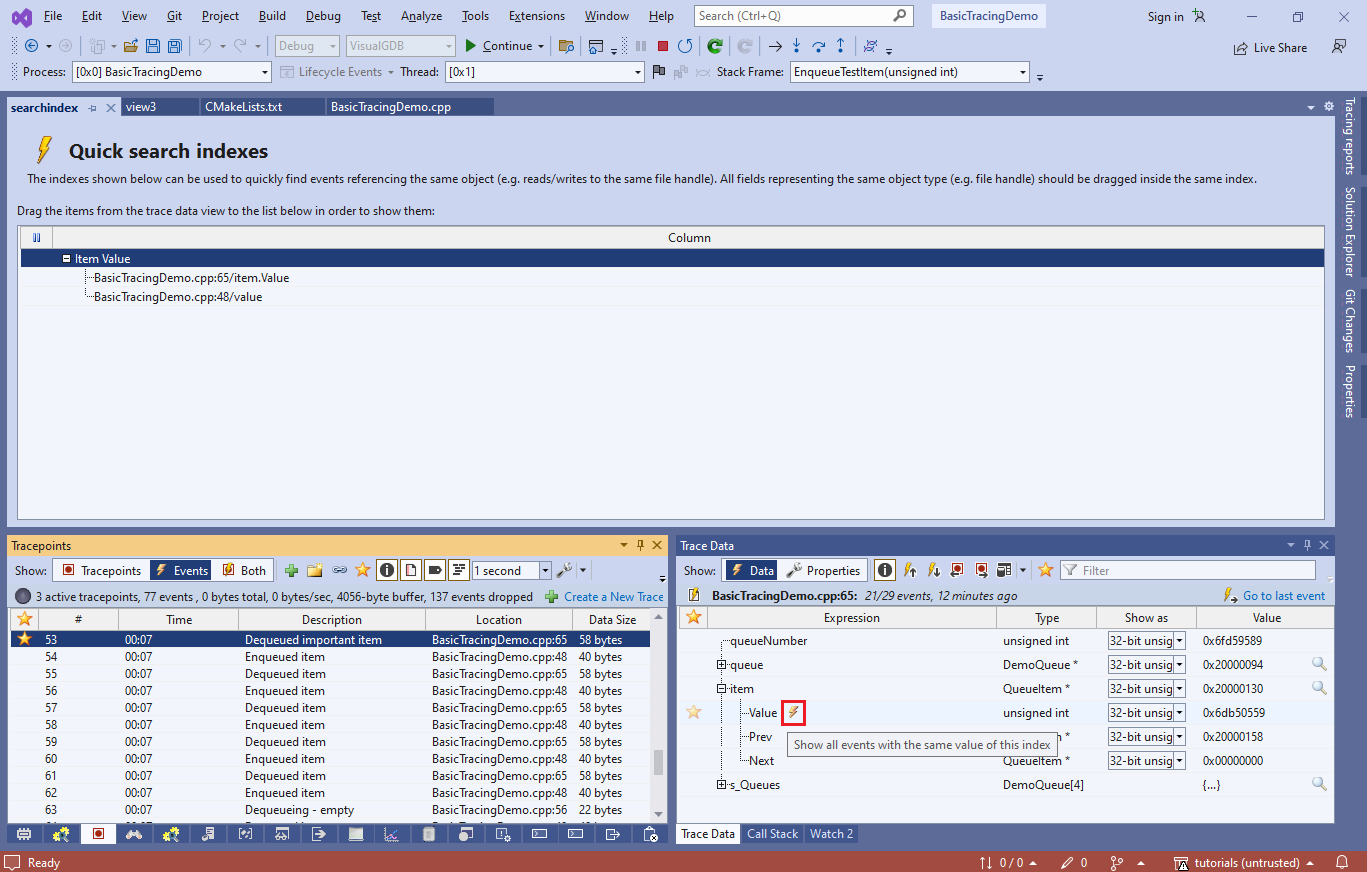
- If you click it, VisualGDB will show all events with the same value. In this example, it shows when this specific item was enqueued, however you can also use it to show all operations on a certain mutex (by indexing the mutex handle), or all events that happened when a particular thread was active (by indexing the current thread pointer):
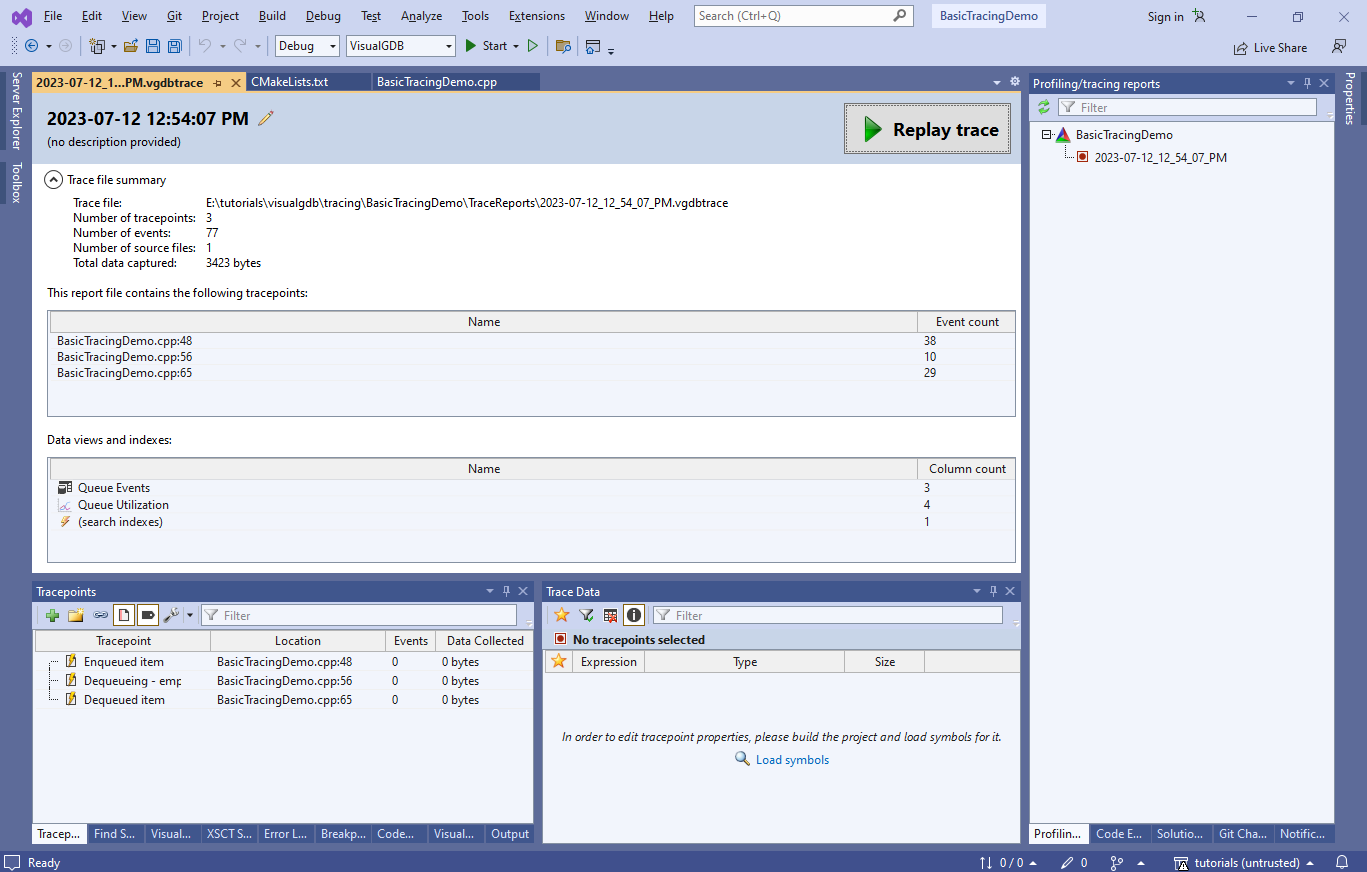
- Press Shift-F5 to end the debug session. VisualGDB will create a trace report storing all the tracepoints and events captured during the session. You can replay it an any time later to compare how the firmware operates under different circumstances:
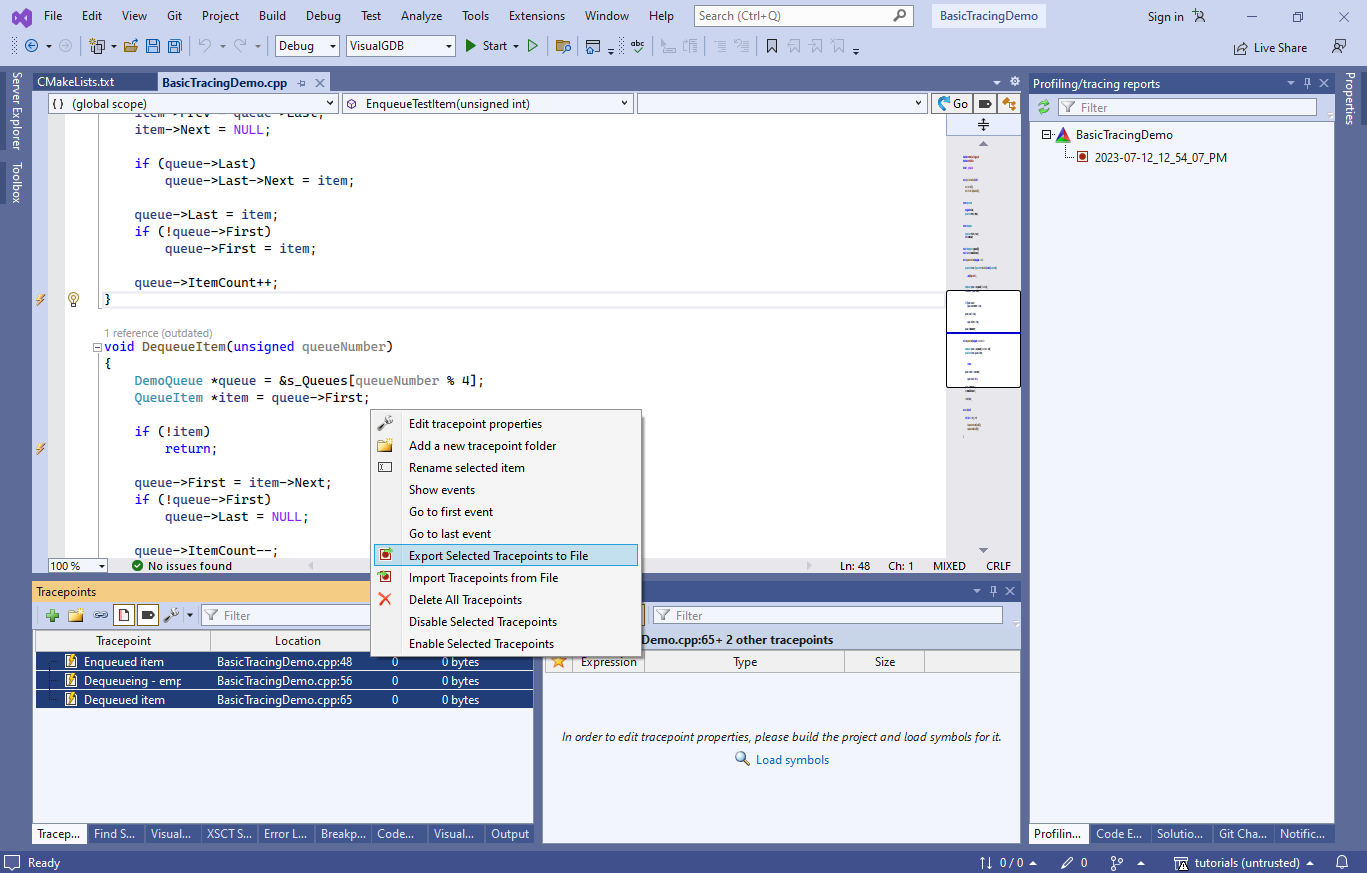
- Tracing everything all the time is not practical, and setting the tracepoints from scratch could be inconvenient. So, VisualGDB provides 2 mechanisms for managing the tracepoints. You can export them to a tracepoint list file (including the exact data you selected for tracing) and import it later, or organize them into groups and keep enabling/disabling the groups as you need them:
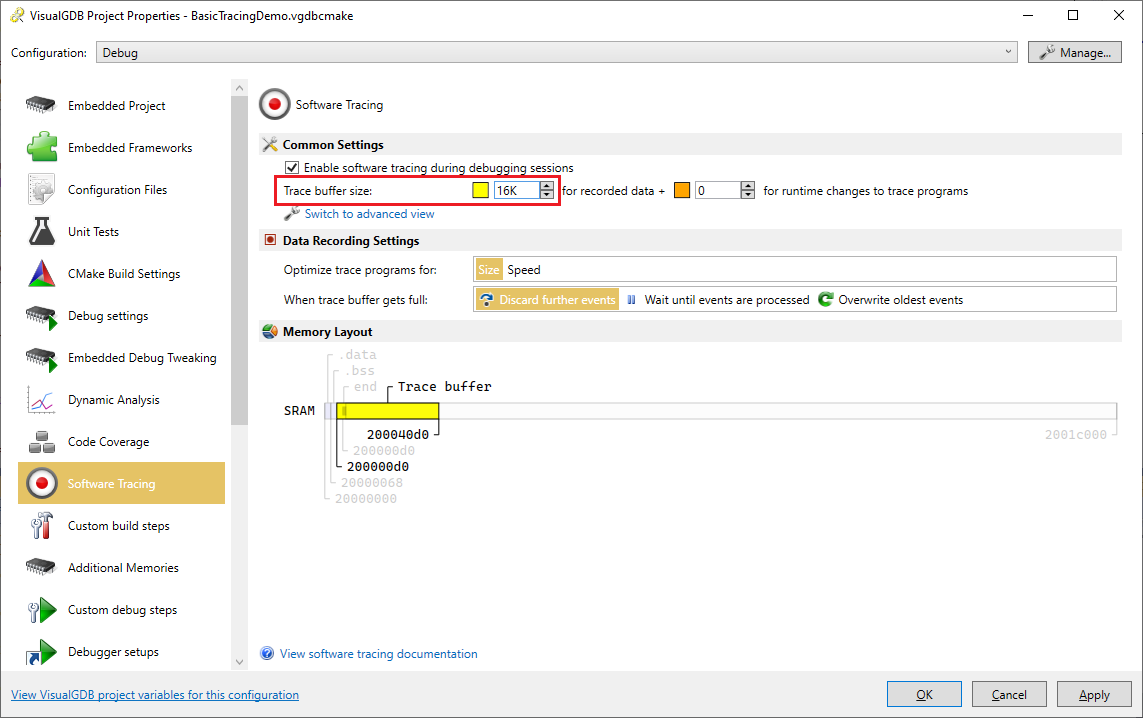
- If the tracepoints generate the data faster than VisualGDB can read it, the program will continue running without recording these events and VisualGDB will reflect it in the status line of the Tracepoints window. If this happens too often, consider increasing the trace buffer size via VisualGDB Project Properties:
- If you are using a device supported by our FLASH patching plugins (or are using Segger J-Link that handles FLASH patching on its own), you can add/remove tracepoints at any point during debugging. If not, you would need to restart debugging after adding/removing FLASH tracepoints, however it can enable/disable tracepoints and change which data is being collected. If you would like to add the tracepoints dynamically and cannot run the entire firmware from RAM, consider enabling the “Patch code for initially disabled tracepoints” checkbox and reserving some memory for runtime trace program changes. You can then create disabled tracepoints at all the relevant locations when the program is not running, and enable them as you need later:
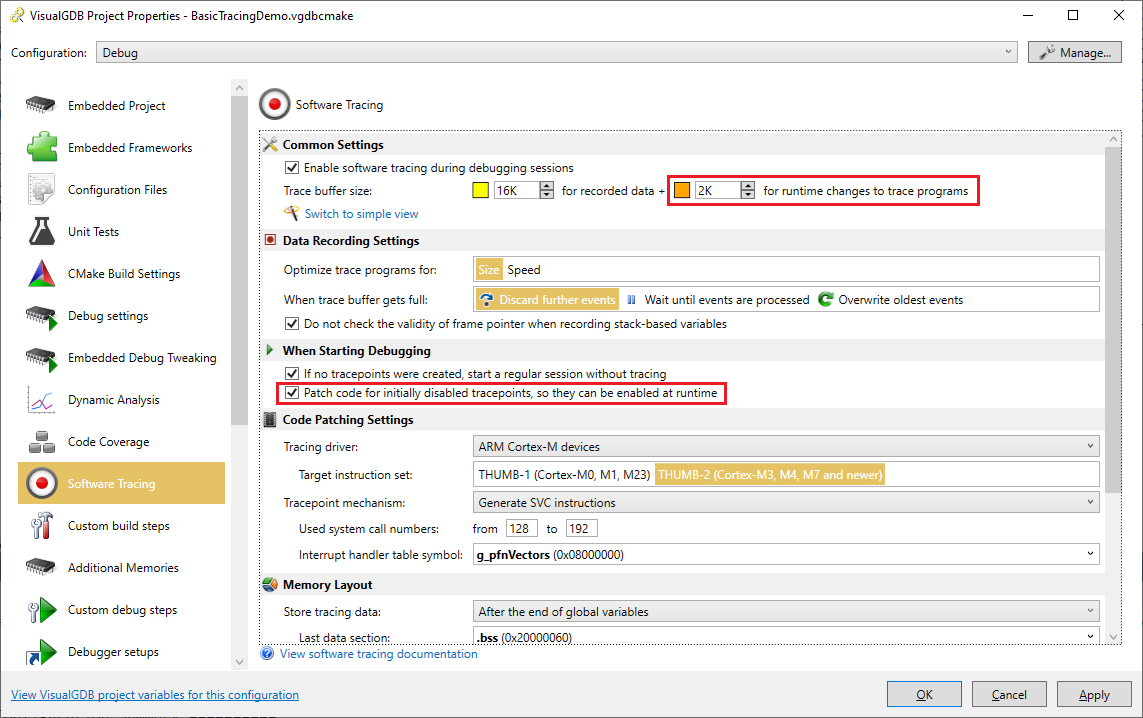 If you are not planning to do that, consider disabling the “patch code” setting so that the disabled tracepoints don’t introduce any overhead.