Debugging Multiple ESP32 Boards with VisualGDB
This tutorial shows how to debug multiple ESP32 boards using separate instances of Visual Studio with VisualGDB. We will show how to configure the ESP32-WROVER board to report a unique serial number and then use it in VisualGDB Project Properties to select a specific board instance that you would like to debug.
Before you begin, install VisualGDB 5.4 or later.
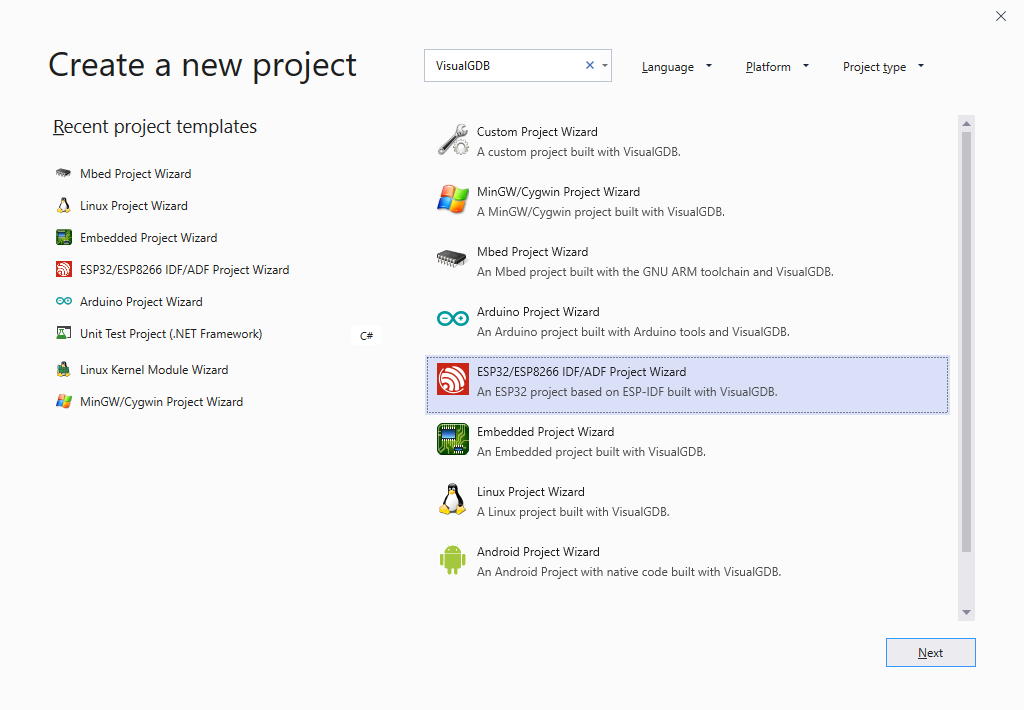
- Start Visual Studio and open the VisualGDB ESP-IDF Project Wizard:
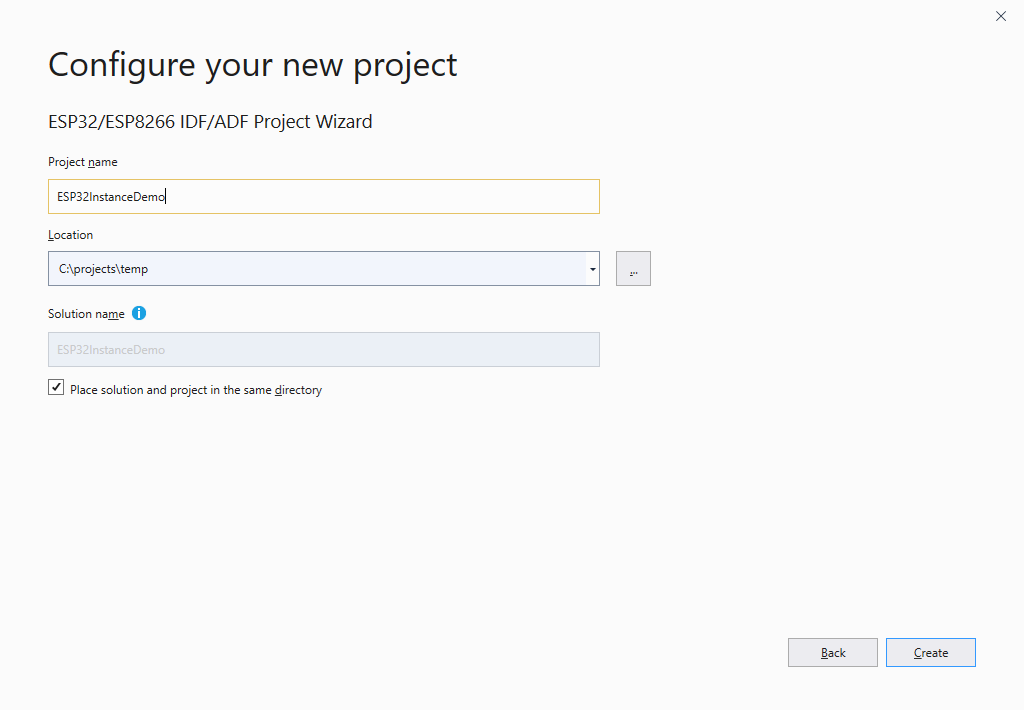
- Specify the name and location for your project, then click “Create” to launch the VisualGDB’s portion of the wizard:
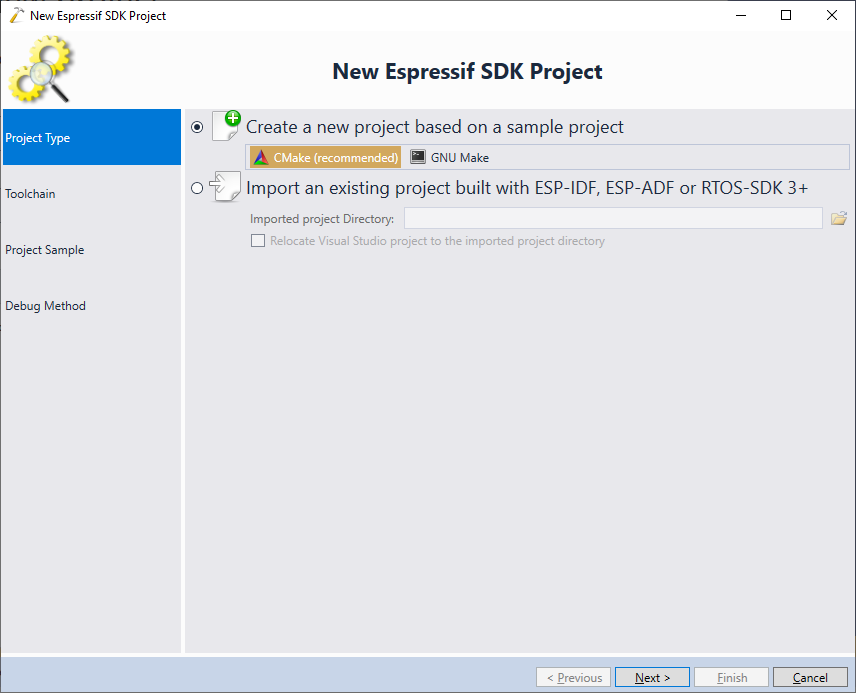
- On the first page of the wizard select “Create a new project based on a sample project -> CMake”:
- On the next page select your toolchain and ESP-IDF checkout:
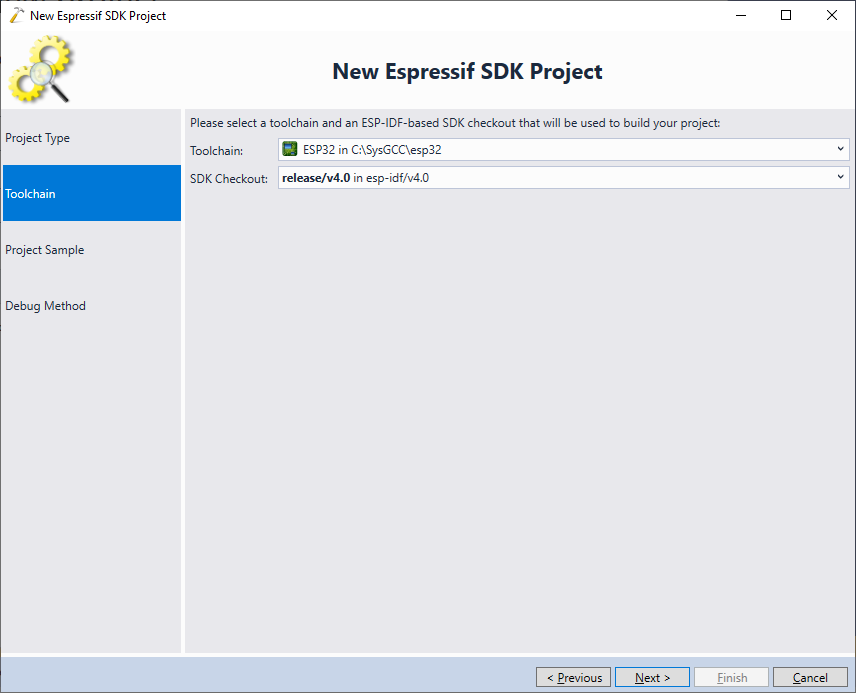 Update: For better compatibility with the latest ESP32 tools, we recommend selecting the consolidated toolchain instead.
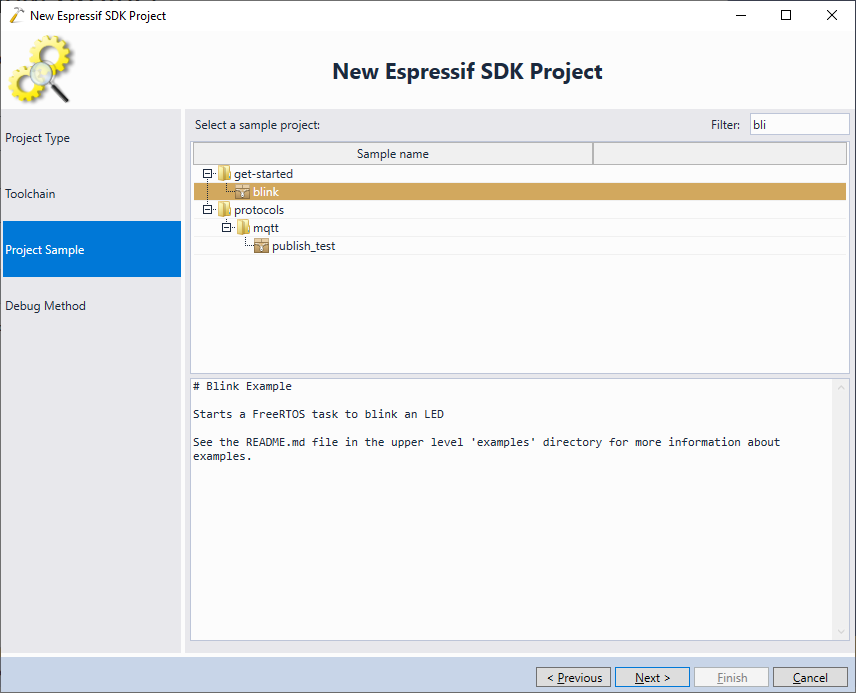
 - Proceed with the blink project sample:
- Connect your board to the USB port and select it in the “Debug Using” field. Then press “Finish” to generate the project:

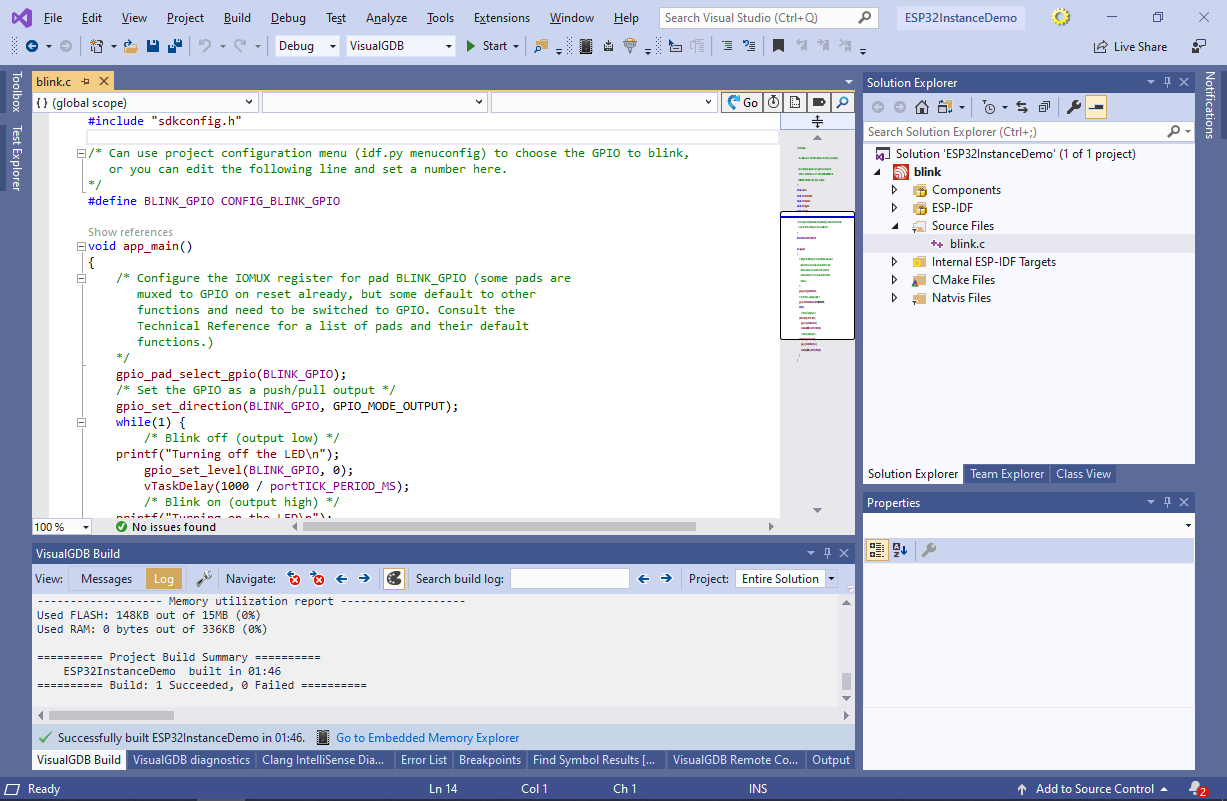
- Build the solution by pressing Ctrl-Shift-B and ensure it succeeds:
 You can launch another instance of Visual Studio and repeat the steps shown above to create another project that will target another ESP32 board. The rest of the tutorial will show how to configure the boards to report unique serial numbers and how to configure VisualGDB to recognize the boards based on them.
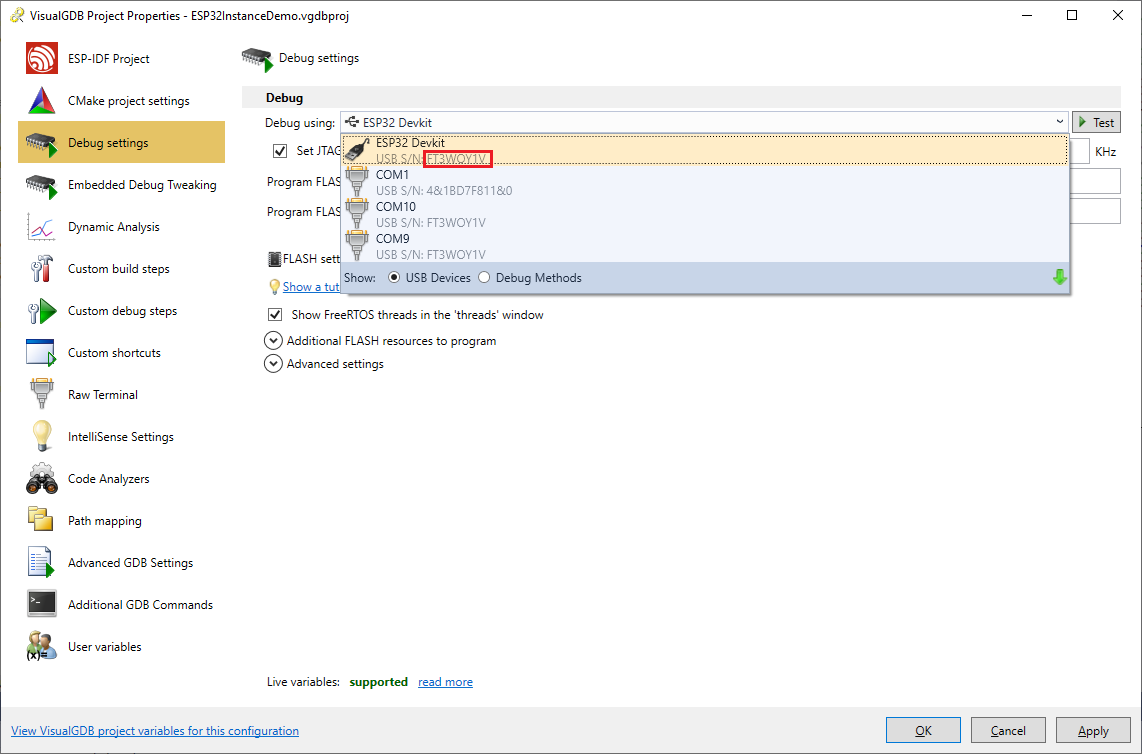
 - Open VisualGDB Project Properties for one of the projects and go to the Debug Settings page. Ensure you are using the “USB Devices” view and locate the serial number of your ESP32 board:
 If the serial number contains the “&” character, it was temporarily generated by Windows because the board is not report a valid serial number. This will let Windows recognize the board, however VisualGDB and OpenOCD will not be able to distinguish it from other boards.
 - The USB-to-JTAG interface on the ESP32 development boards is implemented by a FT2232 chip that is also used in many JTAG/SWD debug adapters (e.g. Olimex ARM-USB-OCD-H). This enables tools like OpenOCD to recognize the board out-of-the-box and also allows using the FTDI tools to edit the FT2232 configuration. Download, install and launch the FT_Prog tool from the FTDI website. Once it launches, select Devices->Scan and Parse:

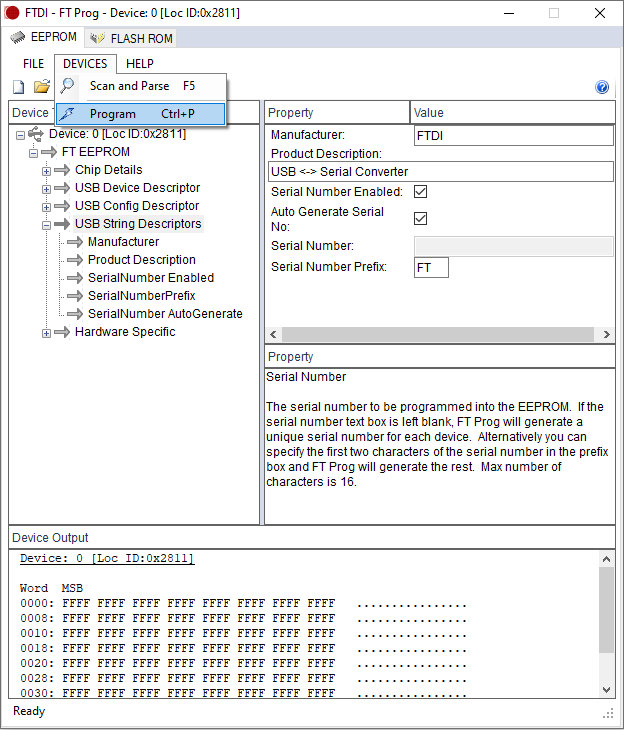
- FT_Prog will display the configuration for the FT2232 chip on the ESP32 board connected to your computer. Go to the USB String Descriptors page and ensure that the “Serial Number Enabled” and “Auto Generate Serial No” checkboxes are checked:
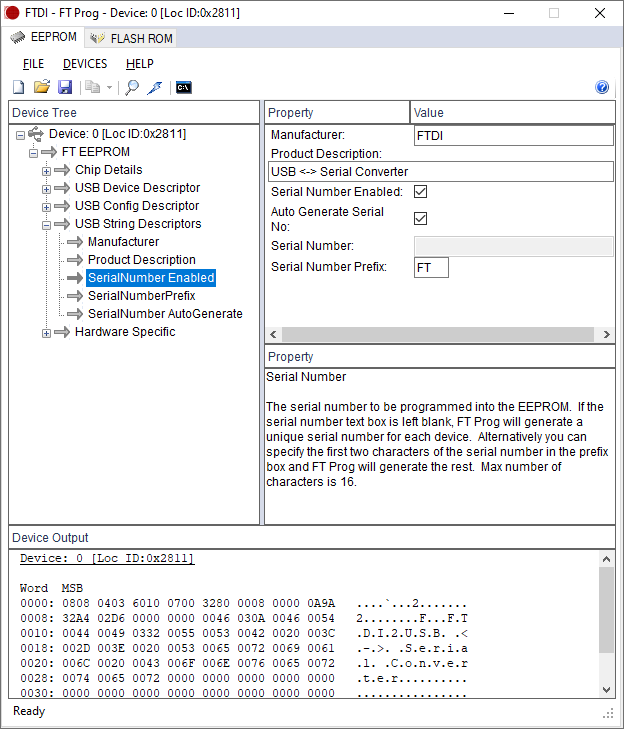 Warning: Do not modify any other settings, as it may stop the board from being recognized.
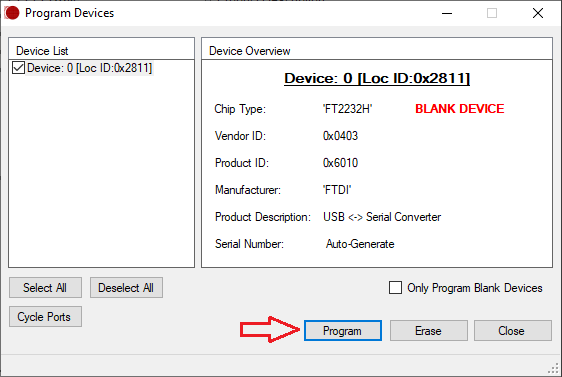
 - Select Devices->Program in the FT_Prog tool:
- If you have not used FT_Prog with this board before, the device will be marked as a BLANK DEVICE (i.e. having no serial number). Confirm that the “Serial Number” is set to “Auto-Generate” and click “Program” to proceed:
- Unplug the ESP32 board from your USB port and plug it back. Reopen VisualGDB Project Properties and check that the serial number for the board no longer includes the “&” character:
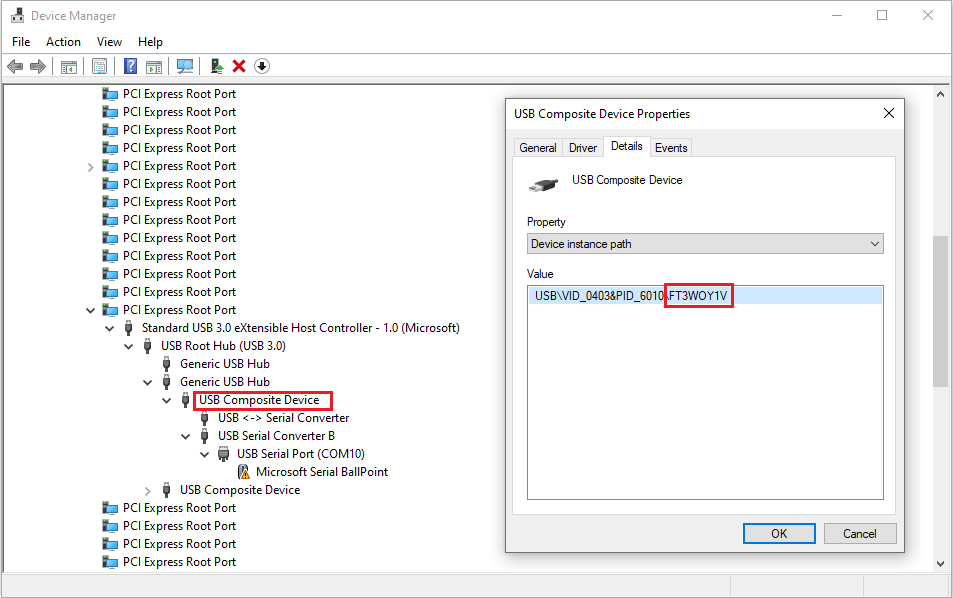
- Now you will be able to select a specific ESP32 board instance for each project and launch multiple simultaneous debug sessions from multiple Visual Studio instances. If you are using OpenOCD manually, you can add the following command-line argument after specifying the esp32_devkitj_v1.cfg script:
-c "ftdi_serial FT3WOY1V"
Replace FT3WOY1V with the serial number shown in the Device Manager’s properties for the USB Composite Device that corresponds to your board: