Using Code Explorer to Understand Complex Call Graphs
This tutorial shows how to use Code Explorer to quickly understand how multiple functions of interest are related. We will show how to flag multiple functions for review while browsing the code, and then automatically place them on a call tree, showing which of them participate in initialization, what is the top-level entry point, and when some other functions are called.
We will demonstrate it based on the Xilinx UltraScale platform, that includes a relatively complex network driver spread around multiple source files. We will flag initialization-related functions in different sources, and will then will use the common root view in Code Explorer to instantly see how the initialization process looks like (i.e. what function is the top-level one, and how does it call other functions).
Before you begin, install VisualGDB 5.6 or later.
- Start Visual Studio and locate the VisualGDB Xilinx Project Wizard in the New Project window:
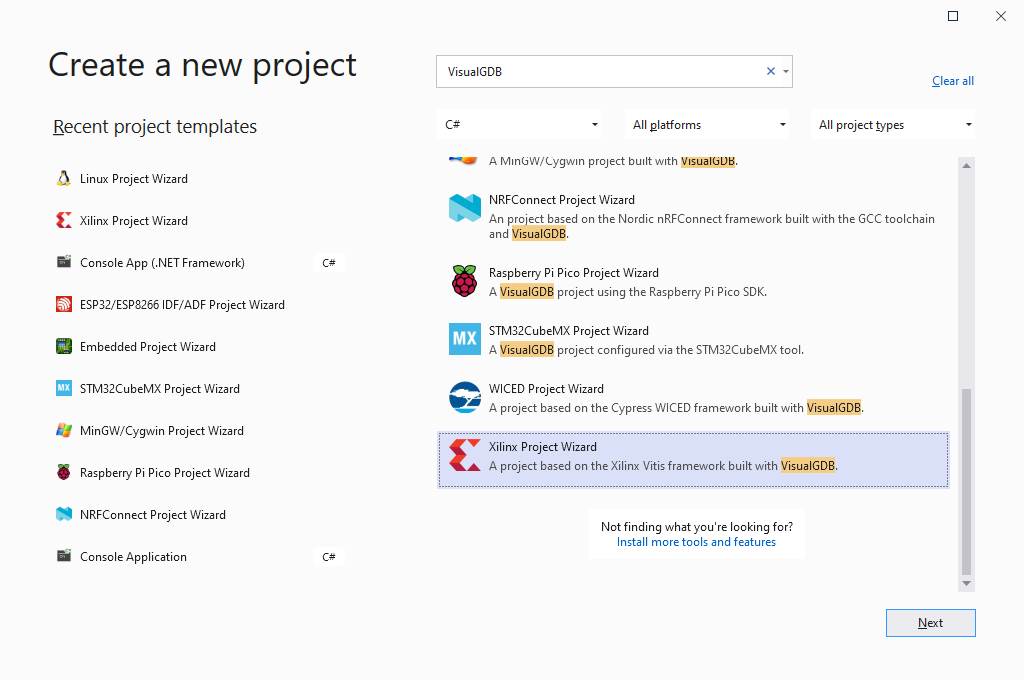 Note that this tutorial uses the Xilinx environment to demonstrate a project with a complex structure out-of-the-box. The steps shown in this tutorial will work the same way for any other project type using Clang IntelliSense.
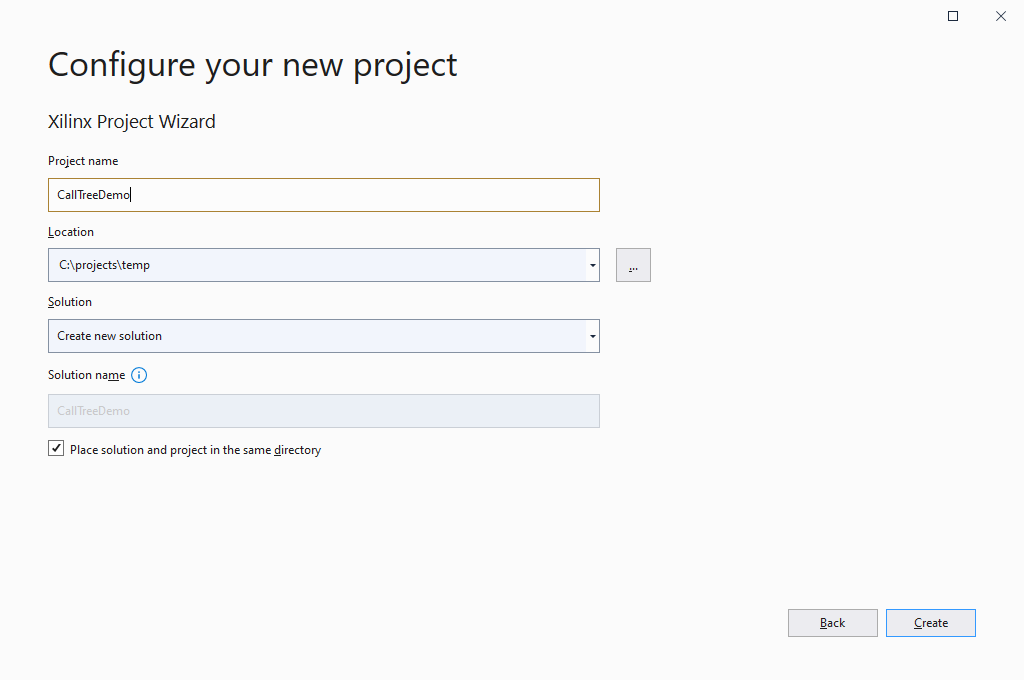
 - Enter the name and location for your project:
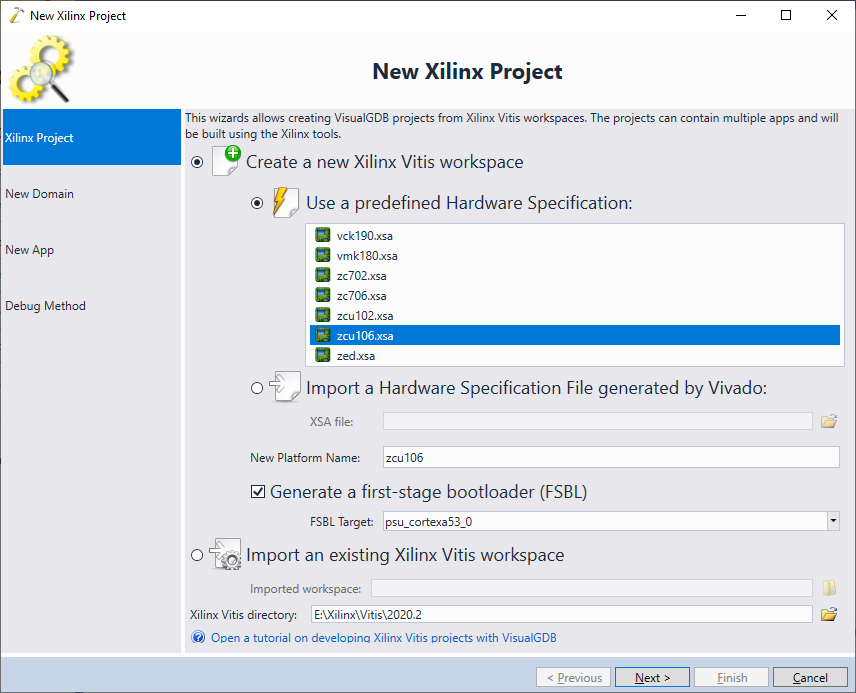
- Specify the location of your Vitis installation and pick the board you would like to target:
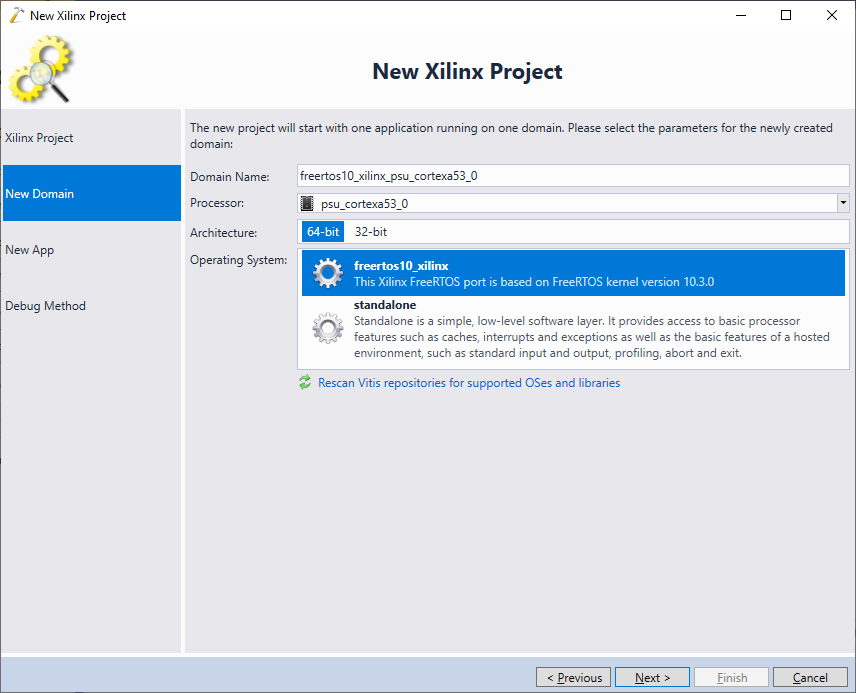
- Select the processor, architecture and OS to use for this project. In this tutorial we will create a FreeRTOS-based project for the ARM64 core:
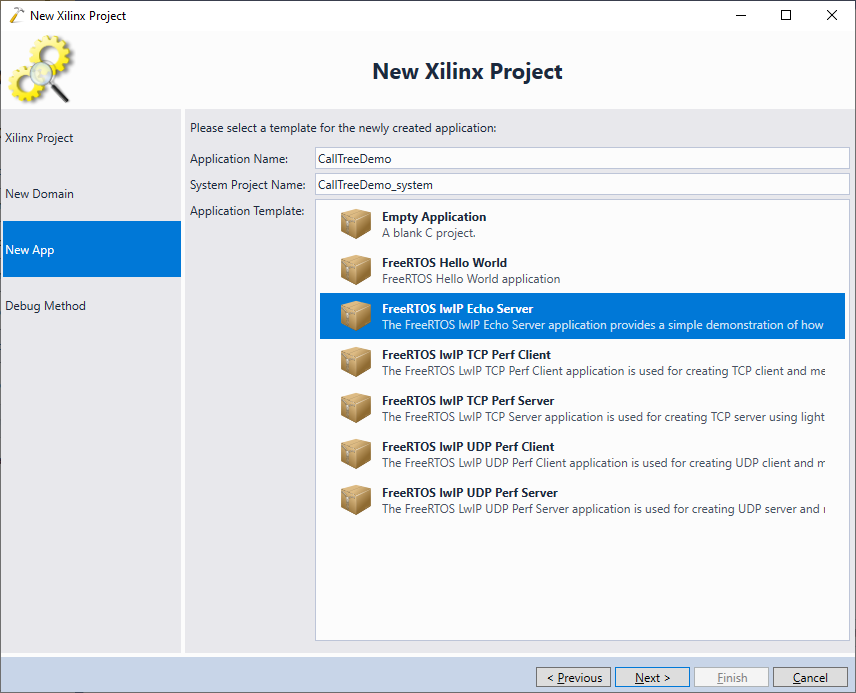
- Select the example project you would like to use. In this tutorial we will be exploring the Xilinx lwIP port, so choose FreeRTOS lwIP Echo Server:
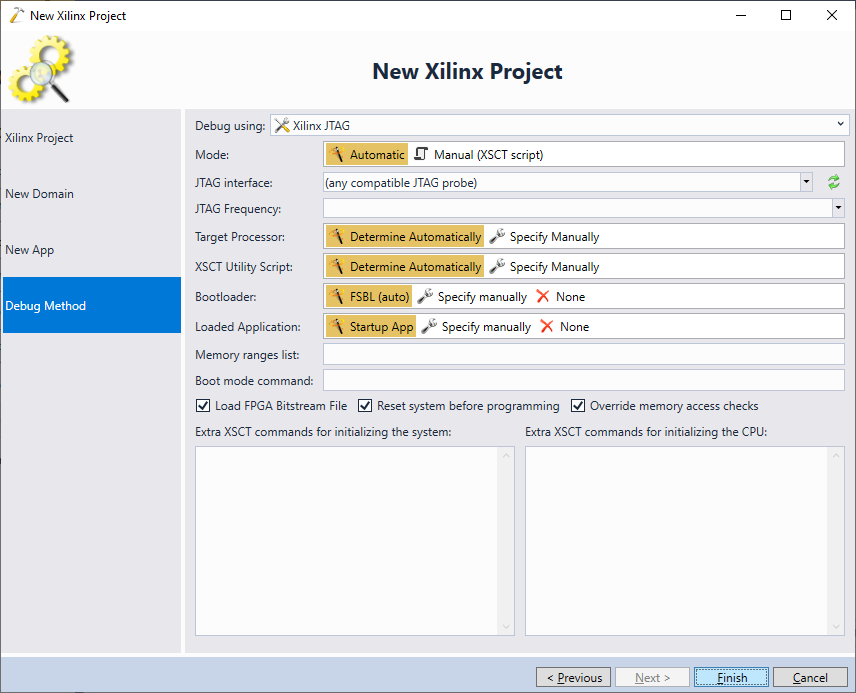
- Finally, you can pick the debug settings that will work with your board. However, in this tutorial we will focus on analyzing the code structure, rather than debugging it, so any debug settings will suffice:
- Press “Finish” to create the project. As the Xilinx BSPs generate public header directories during build, you will need to build the project before you can meaningfully explore its source code. Press Ctrl-Shift-B and wait for the build to succeed:
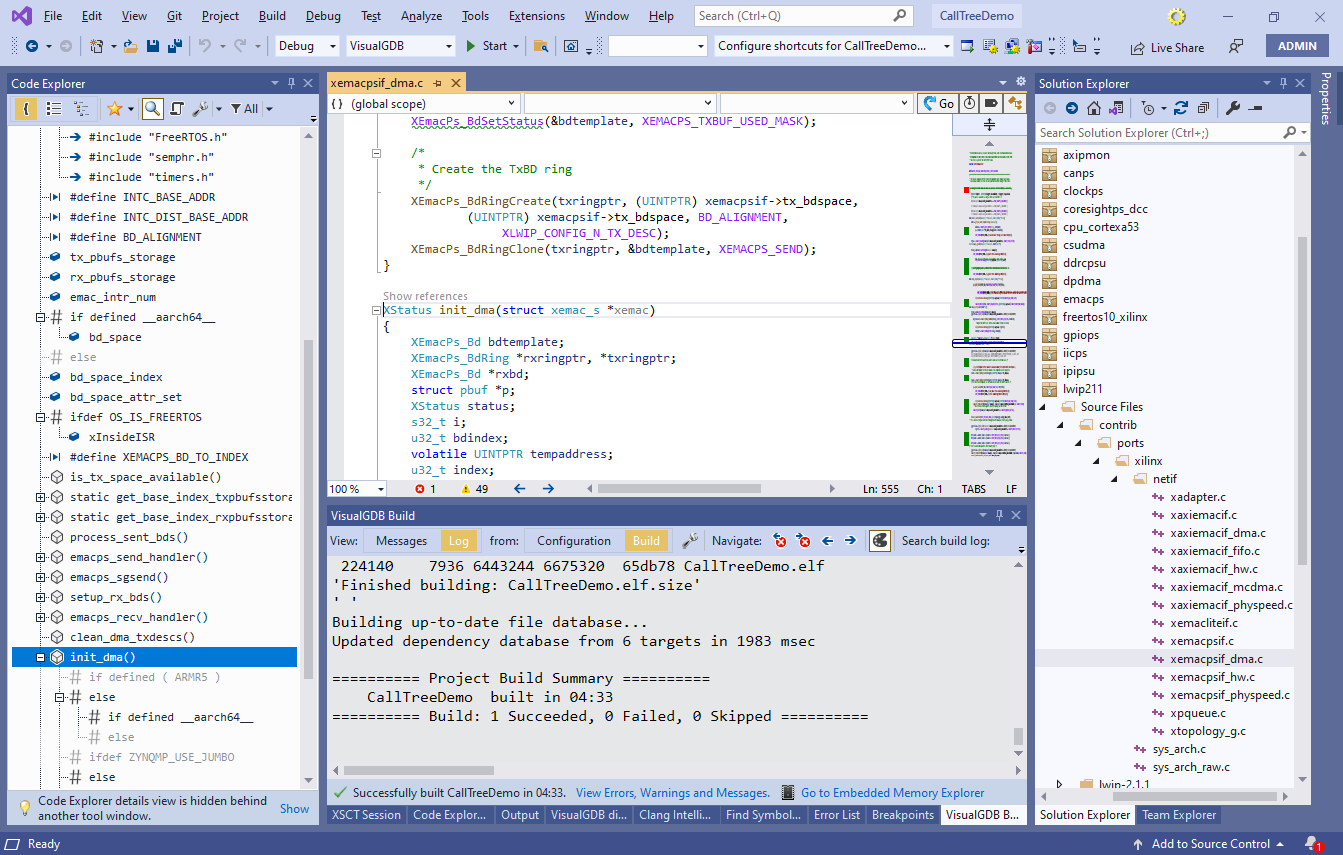 Note how VisualGDB displays the sources from all Xilinx libraries in Solution Explorer on the right, and the structure of the current source file in Code Explorer on the left. If you have previously disabled Code Explorer, you can activate it via View->Code Explorer.
 - Now we will begin marking functions for further review. Open the xemacpsif_dma.c file locate the init_dma() function. Note how it appears in the Outline view in Code Explorer. Mark it, along with setup_rx_bds() and reset_dma() as favorite by clicking in the “favorite” column:

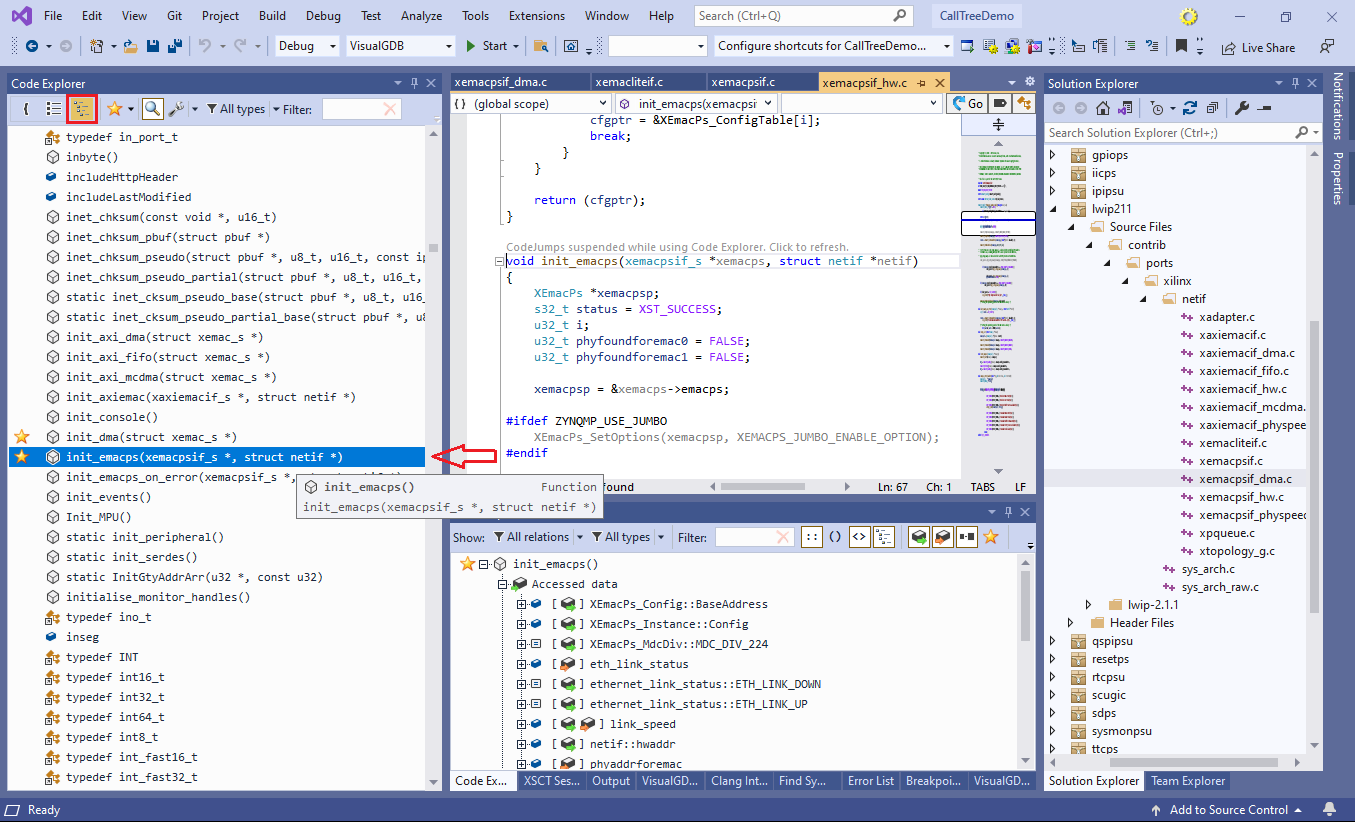
- Now instead of flagging code in the source files, we will use the global view to locate similarly named functions. Click on the init_dma() function in the code and then press the “Go to code explorer” button in the top right corner of the editor:
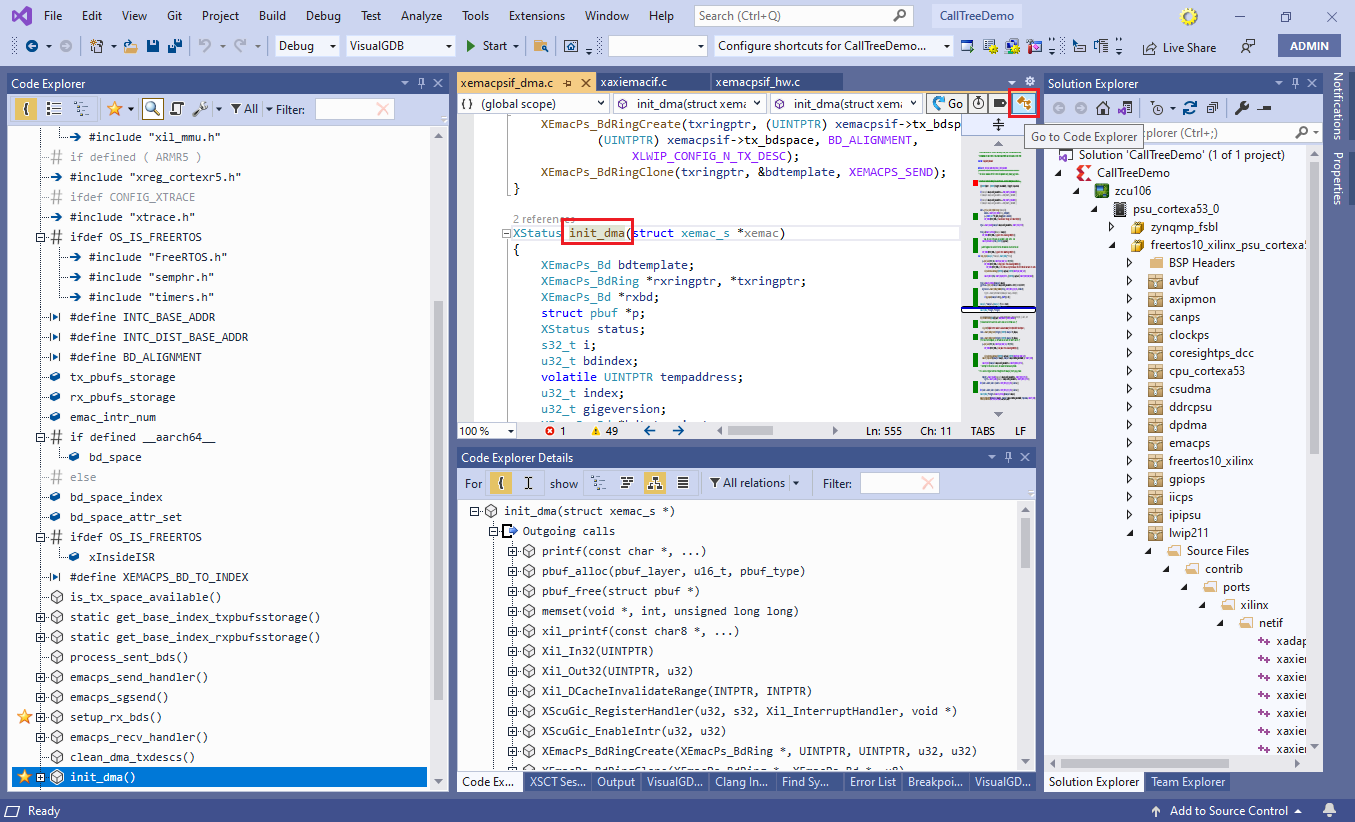
- This will enable the global view in Code Explorer that shows all of the symbols in the entire project. Flag the init_emacps() function below init_dma() as favorite by clicking in the “favorite” column:
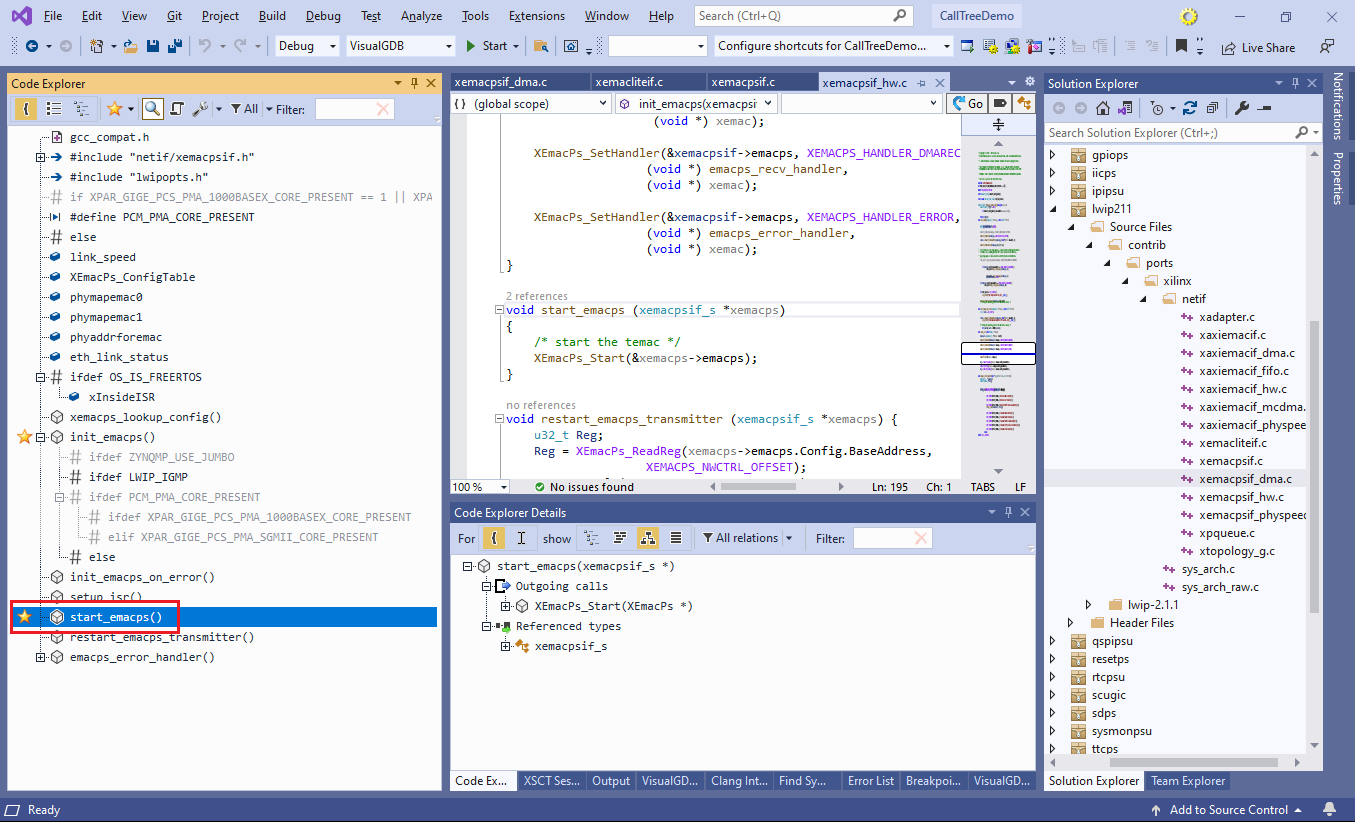
- Open the xemacpsif_hw.c file and flag the start_emacps() function as favorite:
- Switch back to the global view of Code Explorer and enter “xemacps_” in the filter. Locate the “xemacpsif_init()” function and mark it as favorite:

- Now that we have finished marking all relevant functions as favorite, enable the “Favorites only” filter in Code Explorer and select all functions by pressing Ctrl-A. VisualGDB will display the details about the selected functions in the Code Explorer Details window:
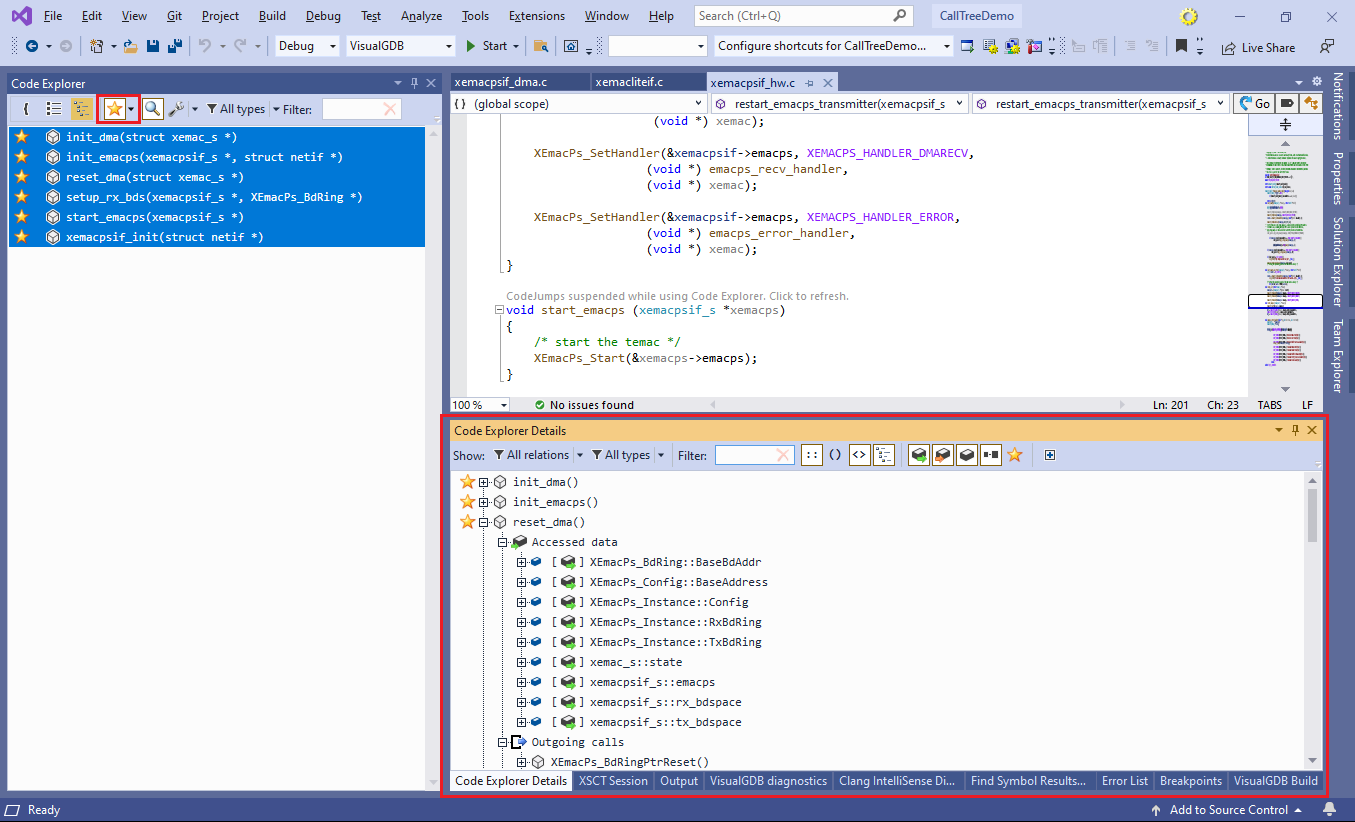
- Normally, the Details window will show all available information: calls, referenced variables, allocated types, etc. While this is useful for understanding what a specific function does, viewing multiple functions in this mode is impractical. Instead, we will limit the view to the call tree by selecting the “Outgoing calls” filter. Hold Shift while clicking it to automatically unchedk other filters:

- Now VisualGDB will automatically discover the common roots (i.e. functions calling other selected functions) and will display them, along with all outgoing calls, in the Details view:
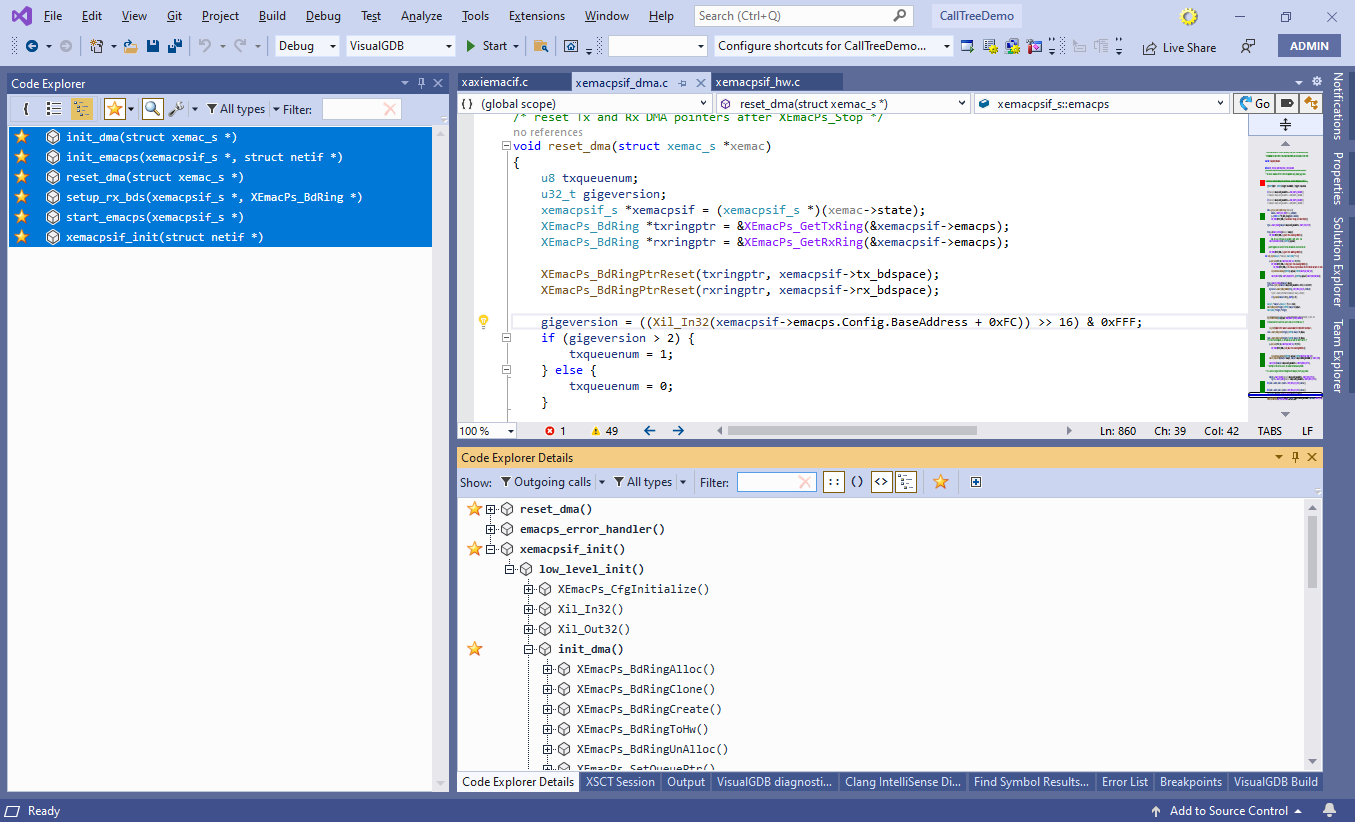
- To limit the view to just the favorite functions (and not the functions called by them), enable the favorites filter in the Code Explorer details window:
 This clearly shows the following observations about the code structure:
- The reset_dma() function has no known callers (if you search for it by name, you will find an inactive #ifdef block)
- The setup_rx_bds() function is not called during initialization, but is instead invoked by the error handler and the RX handler
- The entry point of initialization is the xemacpsif_init() function, that calls low_level_init(), in turn, calling other functions
- If you would like to review the initialization functions later, you can simply save the current set of favorites to a file:
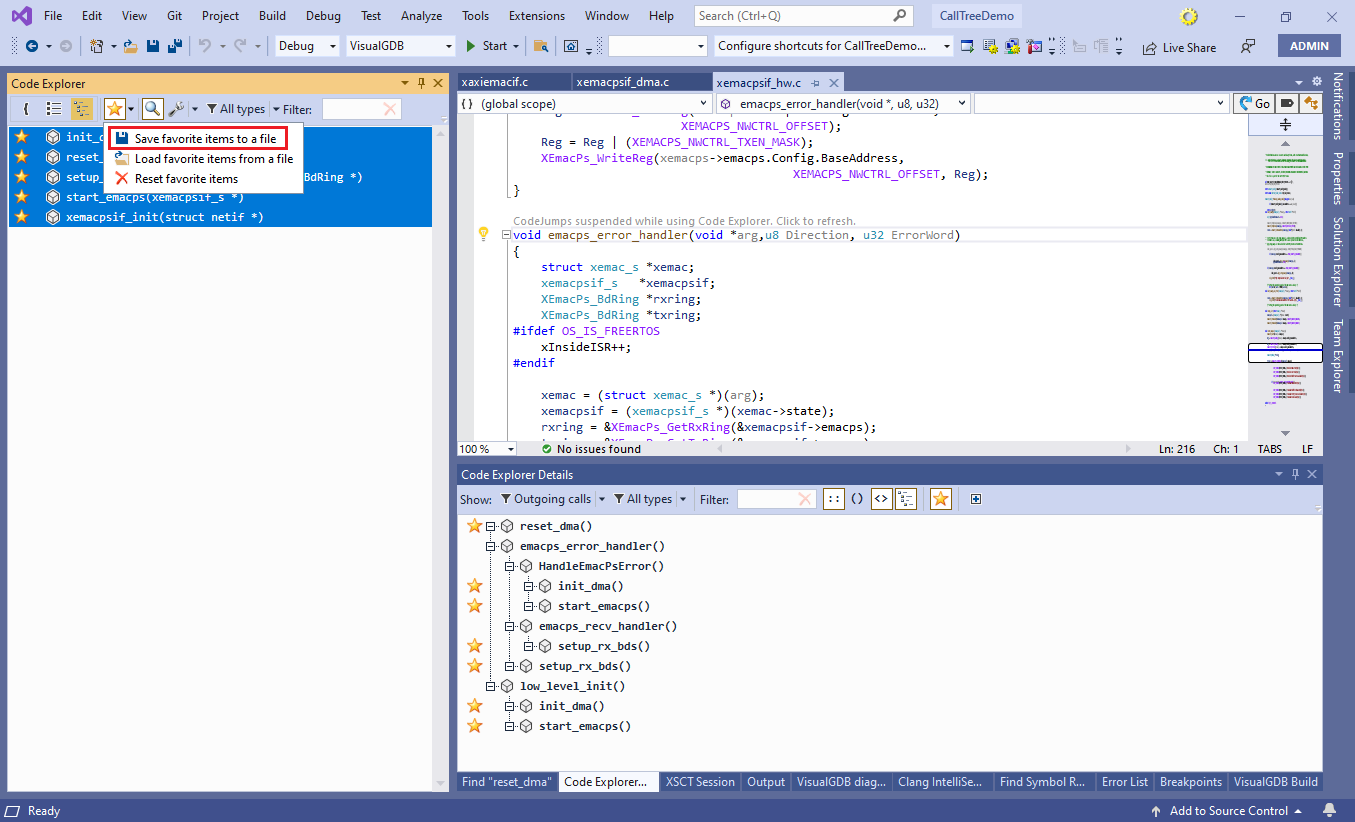 This will only save their names. If the relations between the functions change next time you load the saved set of favorites, Code Explorer will automatically display the up-to-date information.