Understanding High-Level Code Structure with CodeExplorer
This tutorial shows how to use CodeExplorer to quickly analyze high-level structure of large projects, and to find relevant pieces of code. We will load the Sysprogs port of OpenOCD – an open-source tool that works with JTAG/SWD debuggers, and will use Code Explorer to quickly understand what functions are related to certain types and scenarios.
Before you begin, install VisualGDB 5.6 or later.
- Follow this tutorial to clone our OpenOCD repository and open it in Visual Studio. You can also use the techniques shown below to analyze your own code base – all functionality shown in this tutorial will work for any project type that is using Clang IntelliSense.
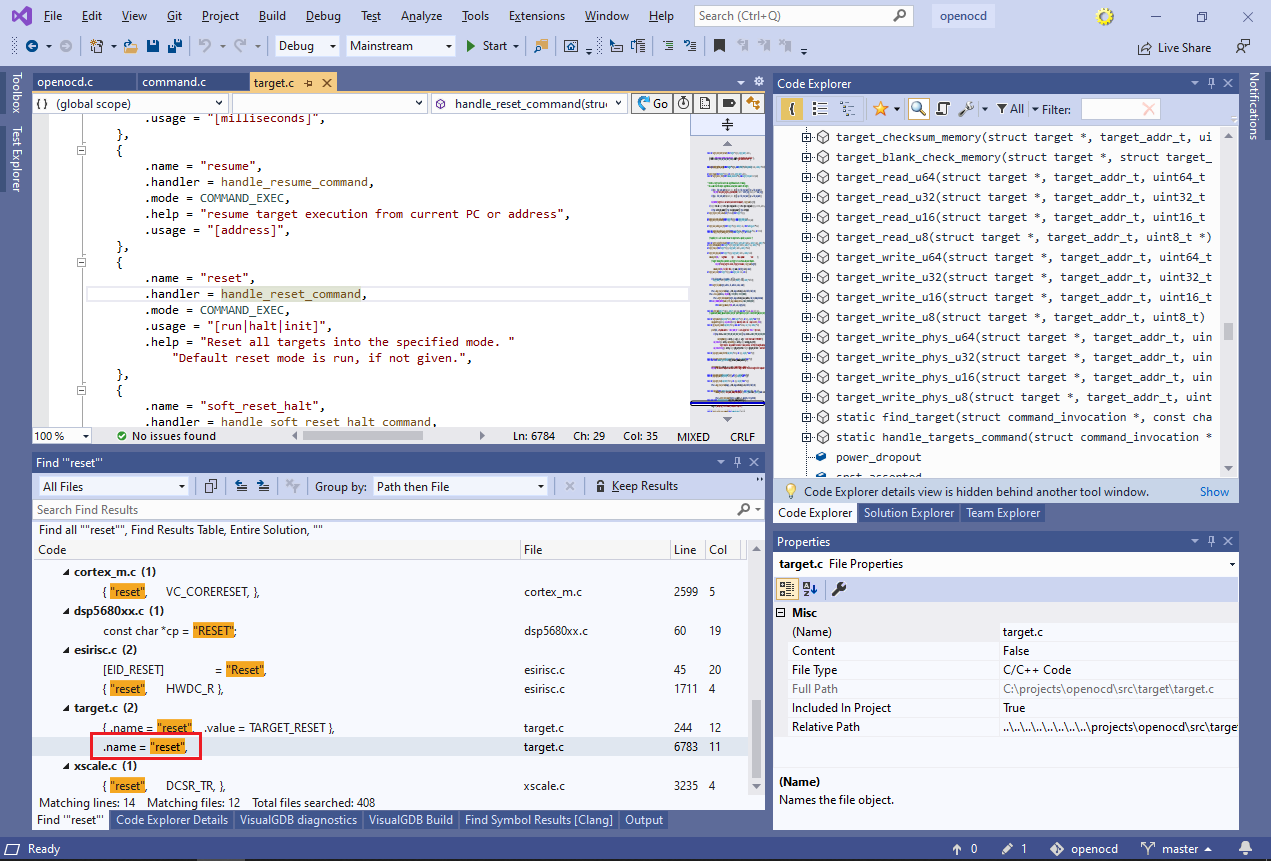
- We will begin with looking up the code that handles the “reset” command, and will use Code Explorer to find other command-related types and functions. Search the entire solution for “reset” (with quotes) and double-click on the last entry in the target.c file:
- Then, click on handle_reset_command and press F12. This will navigate to the handle_reset_command() function highlighting it in the Code Explorer outline. If the Code Explorer window is not active, you can open it via View->VisualGDB Code Explorer:
 Note that the handle_reset_command() function is defined via a preprocessor macro, so its argument types are not clearly visible in the source code. However, the Outline view in Code Explorer does show them correctly. Take a note of the “struct command_invocation” shown in the Outline, and switch Code Explorer into the globals view via a button in the top left corner of Code Explorer.
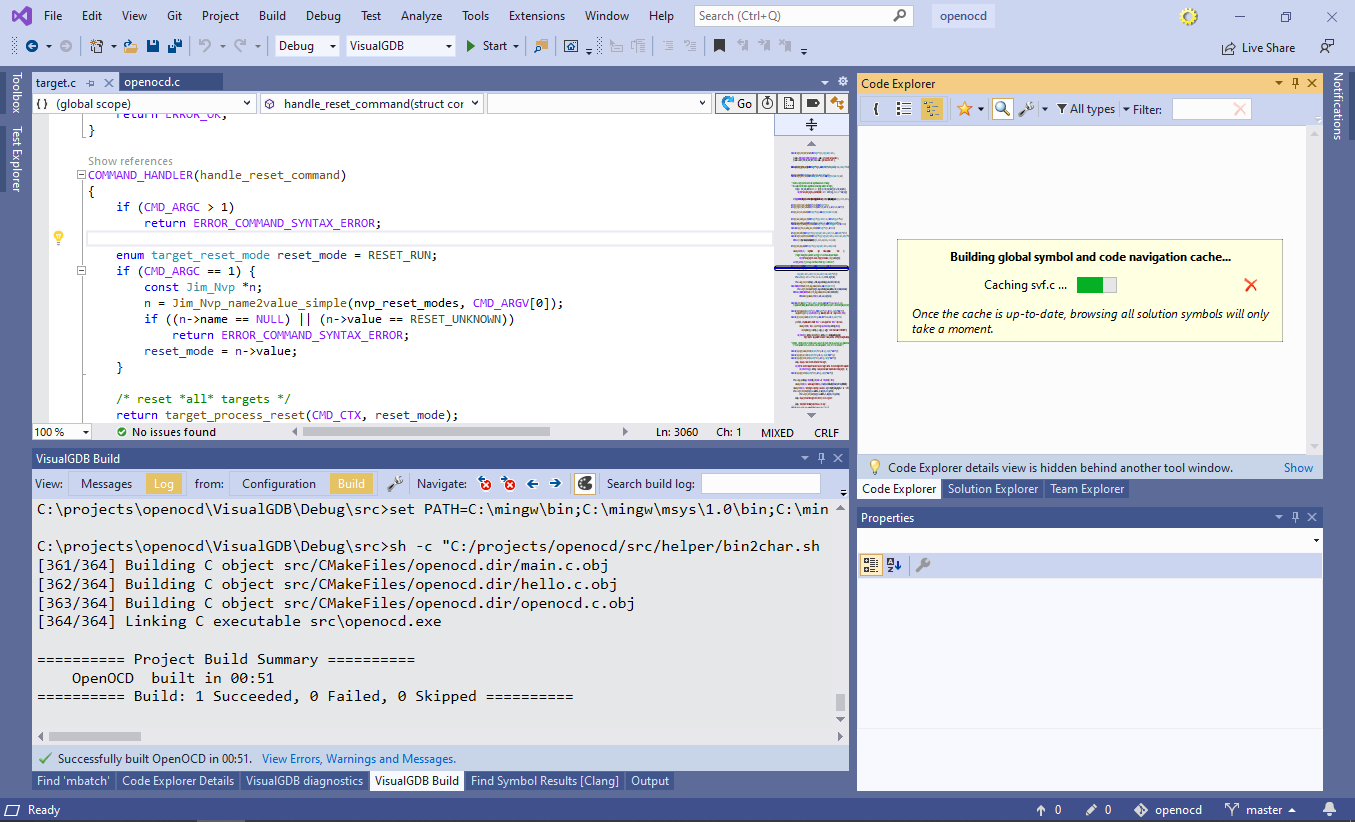
 - If this is the first time you open the Globals view for this project, VisualGDB will build a global symbol cache. It typically takes a few minutes, depending on the size of the project. For OpenOCD, it should take around 1-2 minutes:
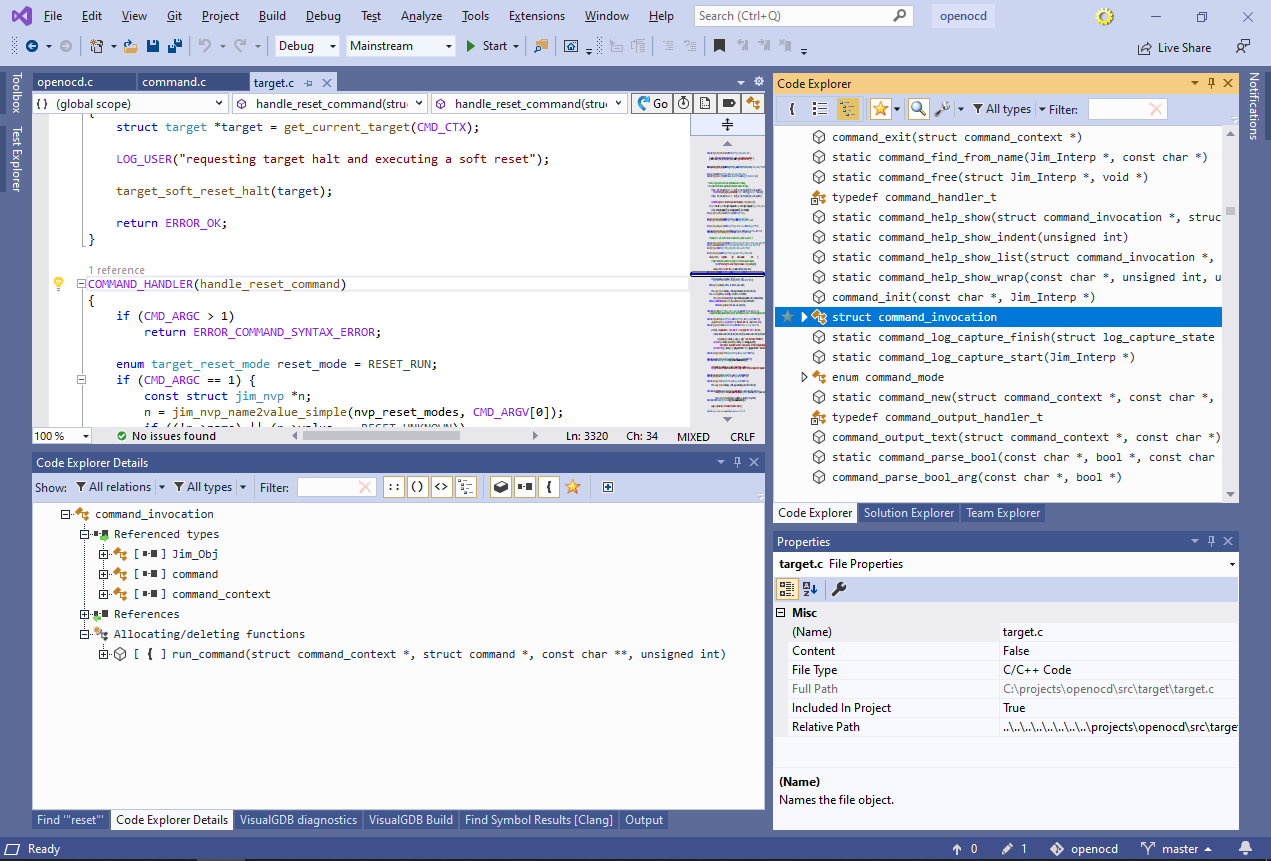
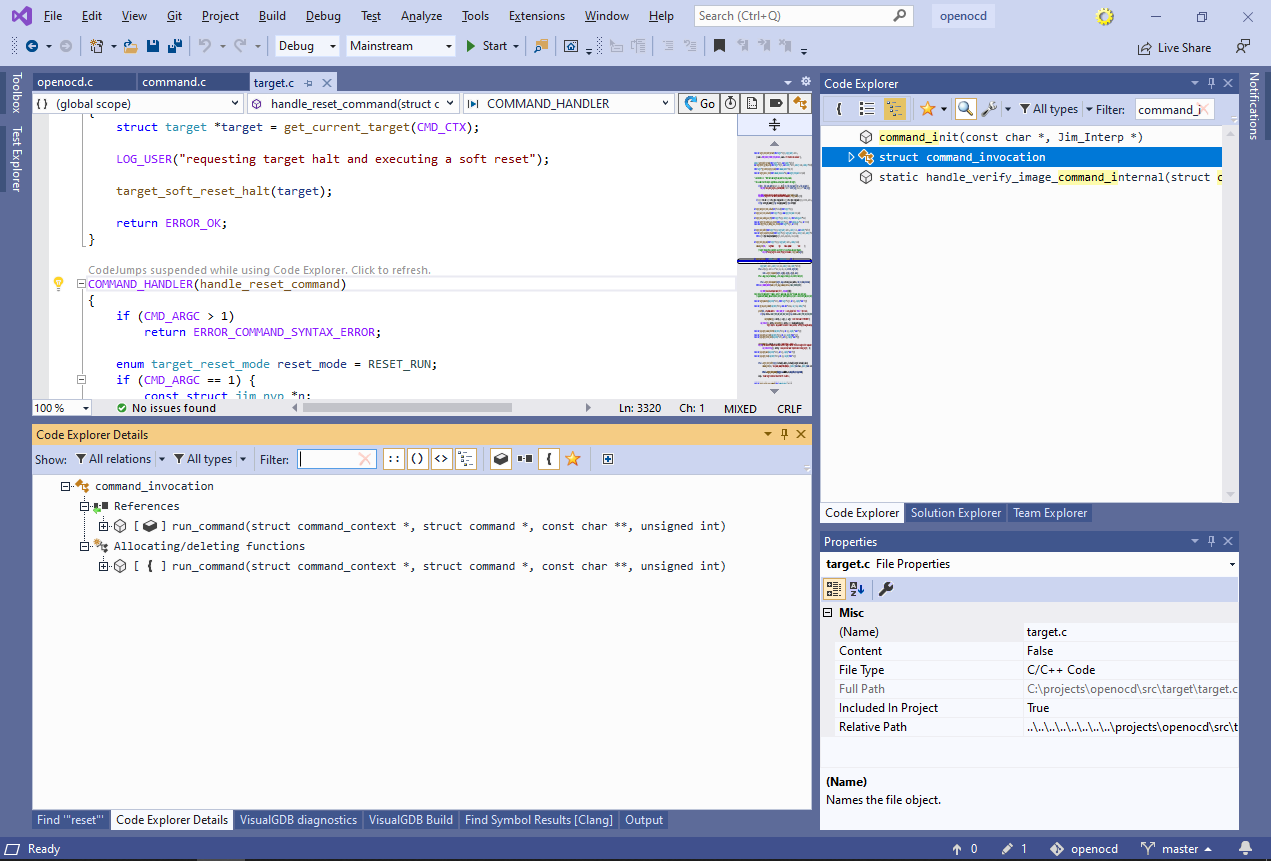
- Locate handle_reset_command in the globals view (or use the button in the top right corner of the editor) and go to the Code Explorer Details view:
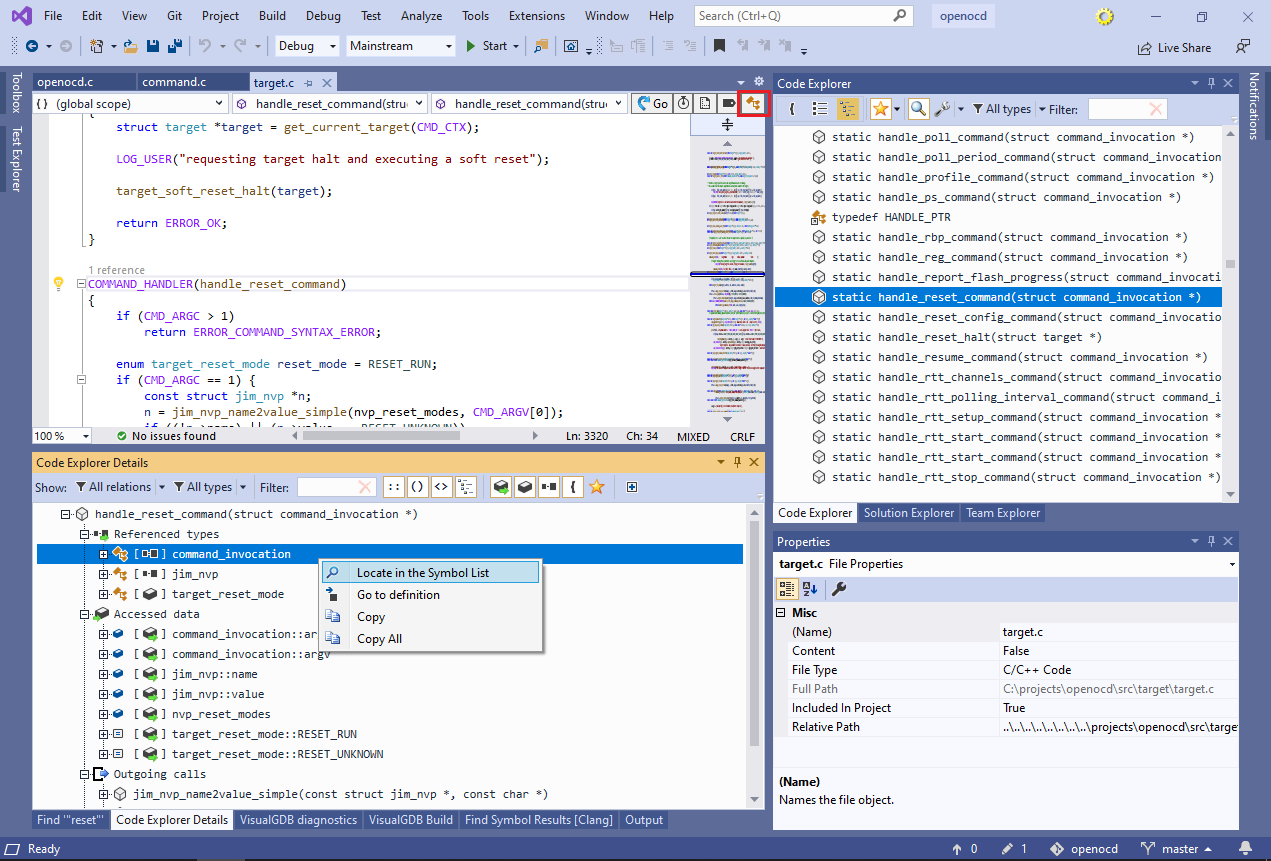 See how the “Referenced Types” node shows all types referenced by the function (i.e. used by its arguments and variables), including the “command_invocation” struct. Right-click on command_invocation and select “Locate in Symbol List”.
 - This will show all information about command_invocation, including all functions referencing it, all placed in the code where it is instantiated, and any other structures it uses as fields:
- As navigating all the information at once could be distracting, use the relations filter to restrict it to just allocating/deleting functions and incoming calls:
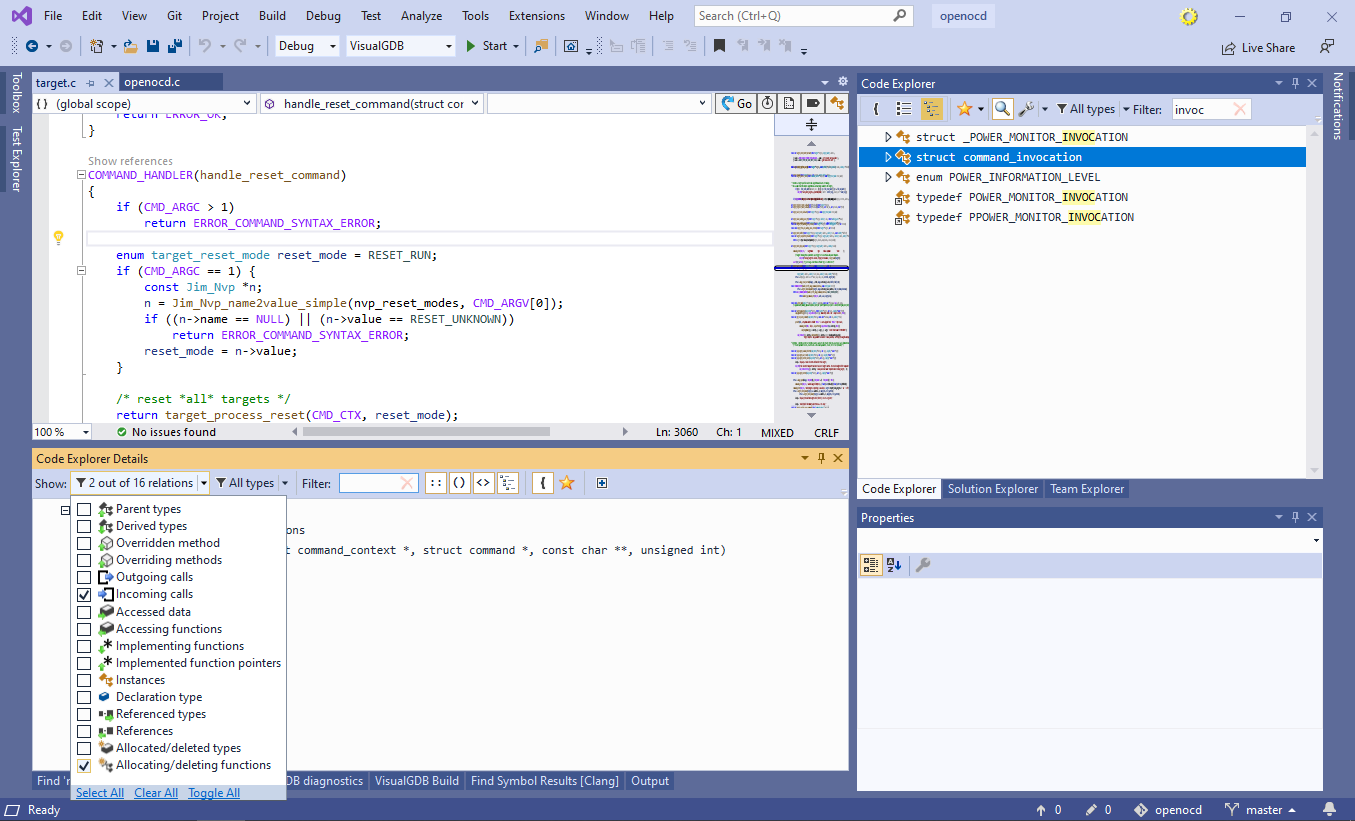 Hint: hold Shift while clicking on a checkbox in the Code Explorer filters to automatically uncheck all other checkboxes.
 - Now you can see that command_invocation structure used by all command handlers is only instantiated in the run_command() function and is allocated on stack (the “{” icon). You can further see that run_command() is only called by script_command_run(), that is in turn called by command_unknown() and script_command():
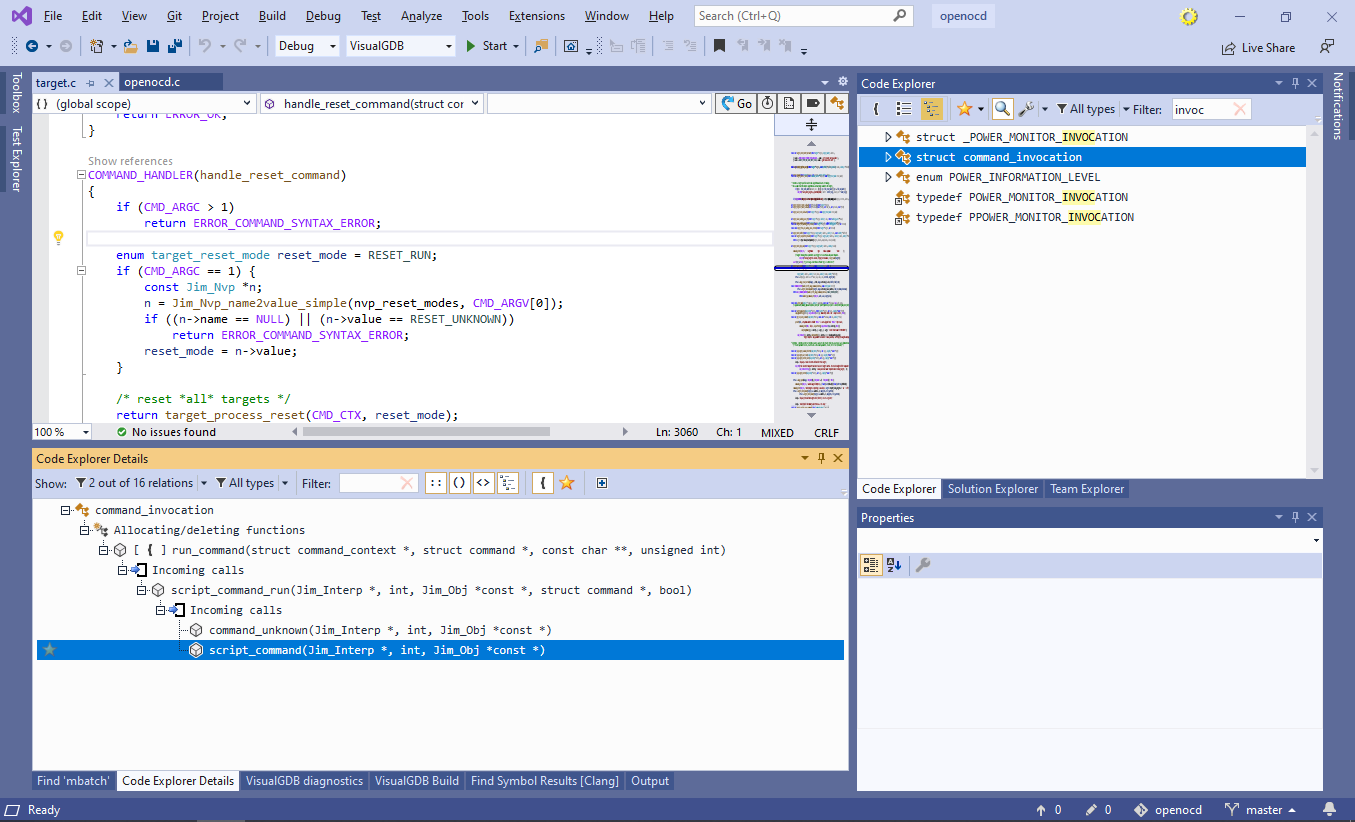 This gives a clear picture of the functions involved in processing of the OpenOCD commands.
 - Now we will explore some other command implementations. Reset the relation type filter to show all relations and look through the references of command_invocation. It will show all functions and structs that have a parameter, variable or field of type command_invocation:
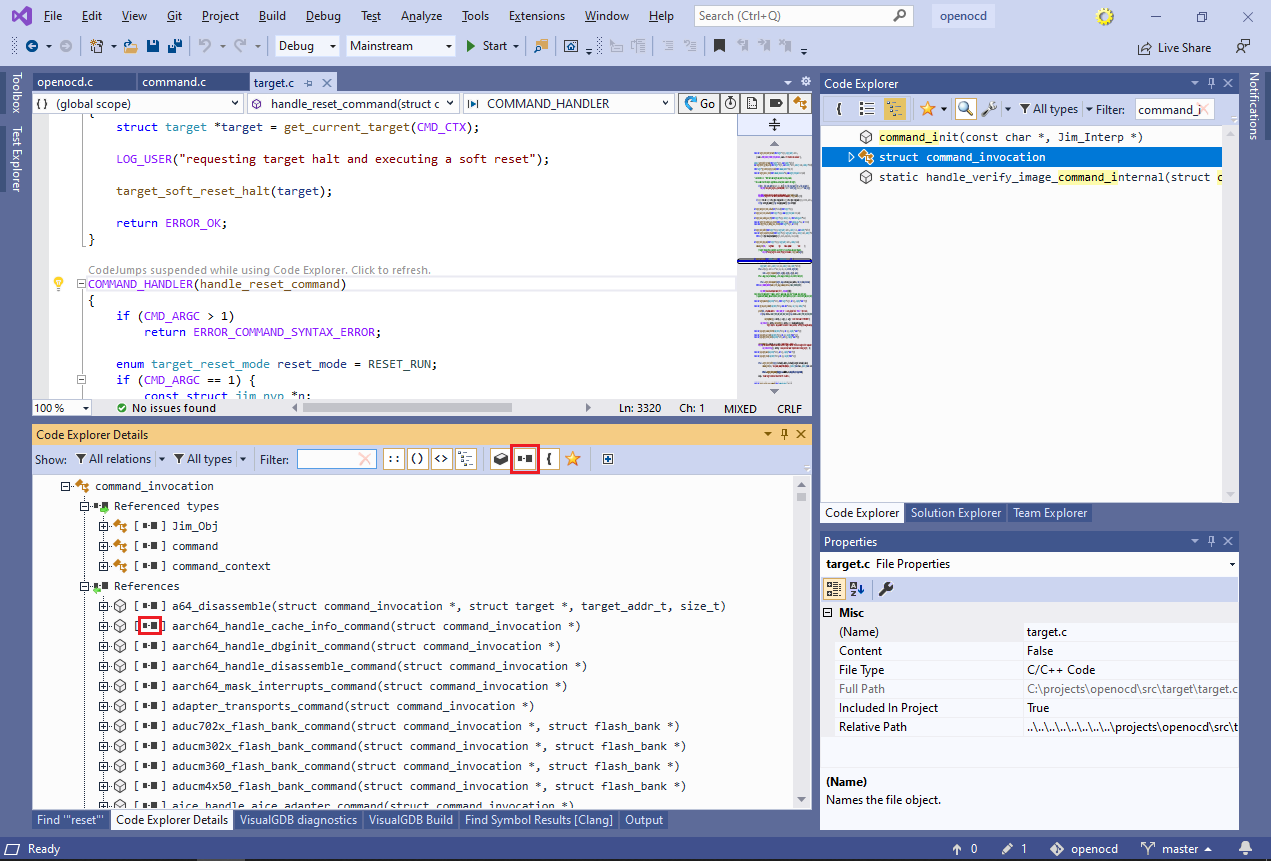 Note how most of them are additionally flagged with the “reference” symbol. If you hover the mouse pointer over it, VisualGDB will show a tooltip explaining that the corresponding references are pointers. Note that each subtype flag (such as “reference”) has a corresponding filter button in the details toolbar.
 - Click on the “pointers” filter in the toolbar. This will hide all pointers to command_invocation, leaving out only instances:
 This means that no other struct includes an instance of command_invocation as a field, and no other function instantiates it.
 - Turn the reference filter back on and enter “reset” in the filter. This will show all functions accepting “command_invocation *” as an argument that have “reset” in their name. Expand the handle_soft_reset_halt_command() function and look for the types it references:
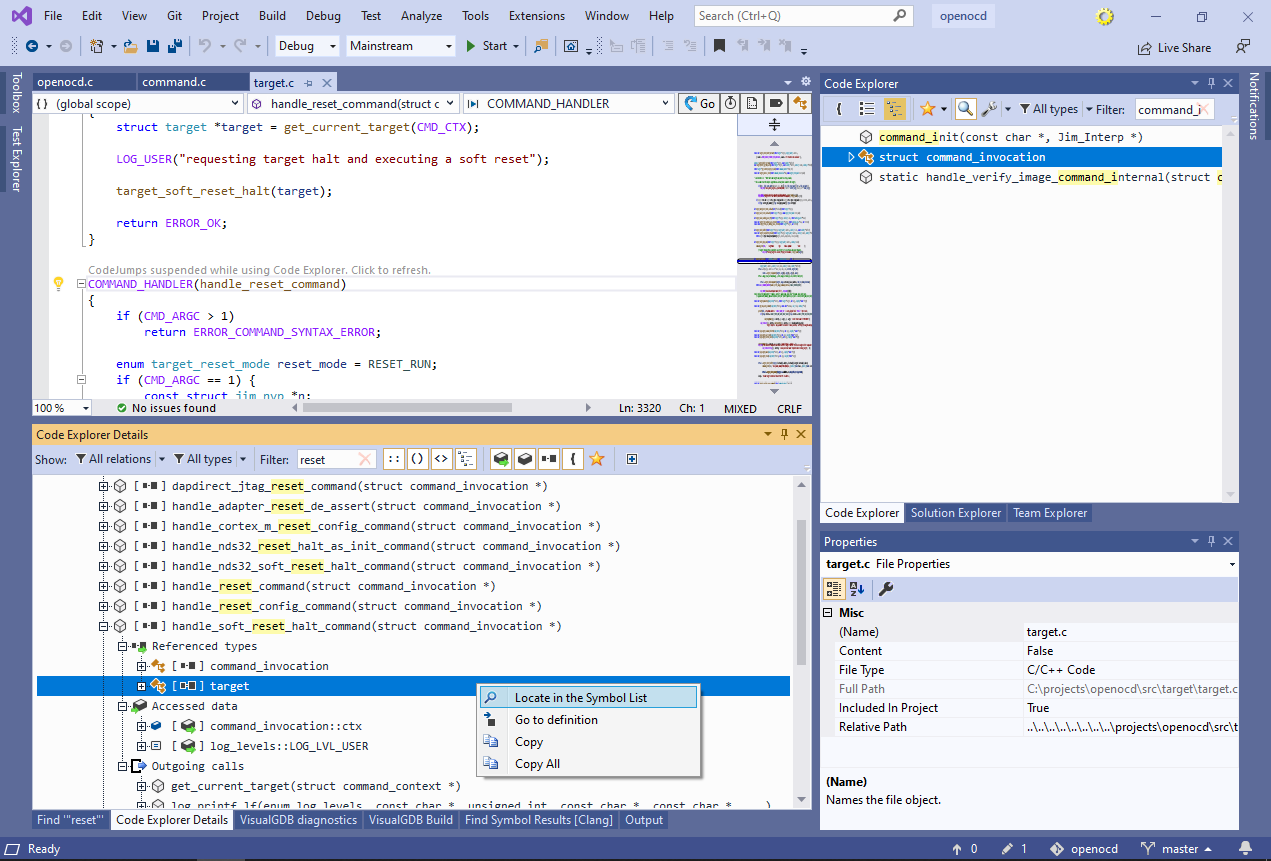 This shows the types of all parameters and local variables of the function. The “accessed data” section below shows all fields and global variables referenced by the function. Right-click on the “target” type and select “locate in the Symbol List”.
 - Code Explorer will now show the detailed information about the target struct. Note that the references list shows other types and functions that have a field/variable of this type, and the instances list shows the exact fields/variables:
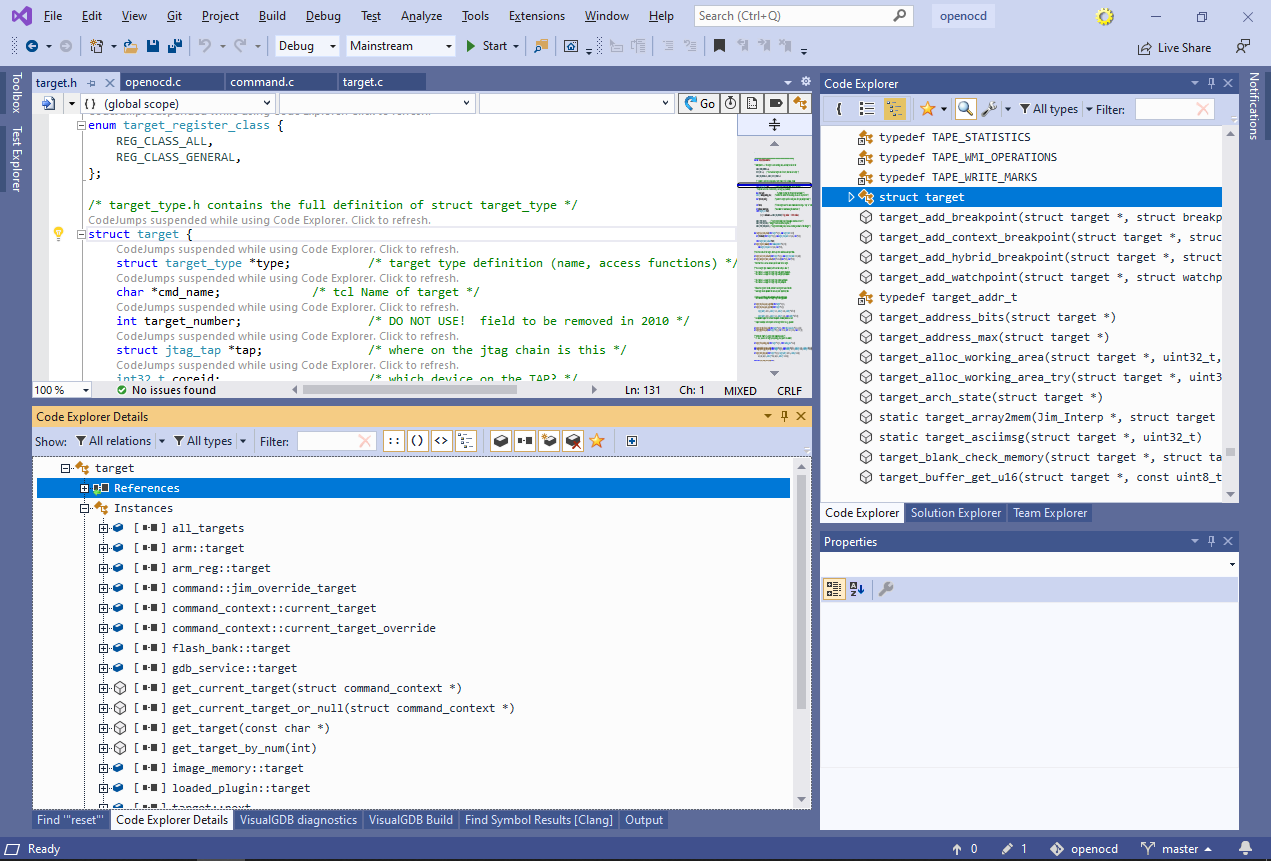
- Normally, Code Explorer will only index globally visible entities (i.e. not specific local variables), however you can change this behavior by setting the “index types of local variables and parameters” checkbox:
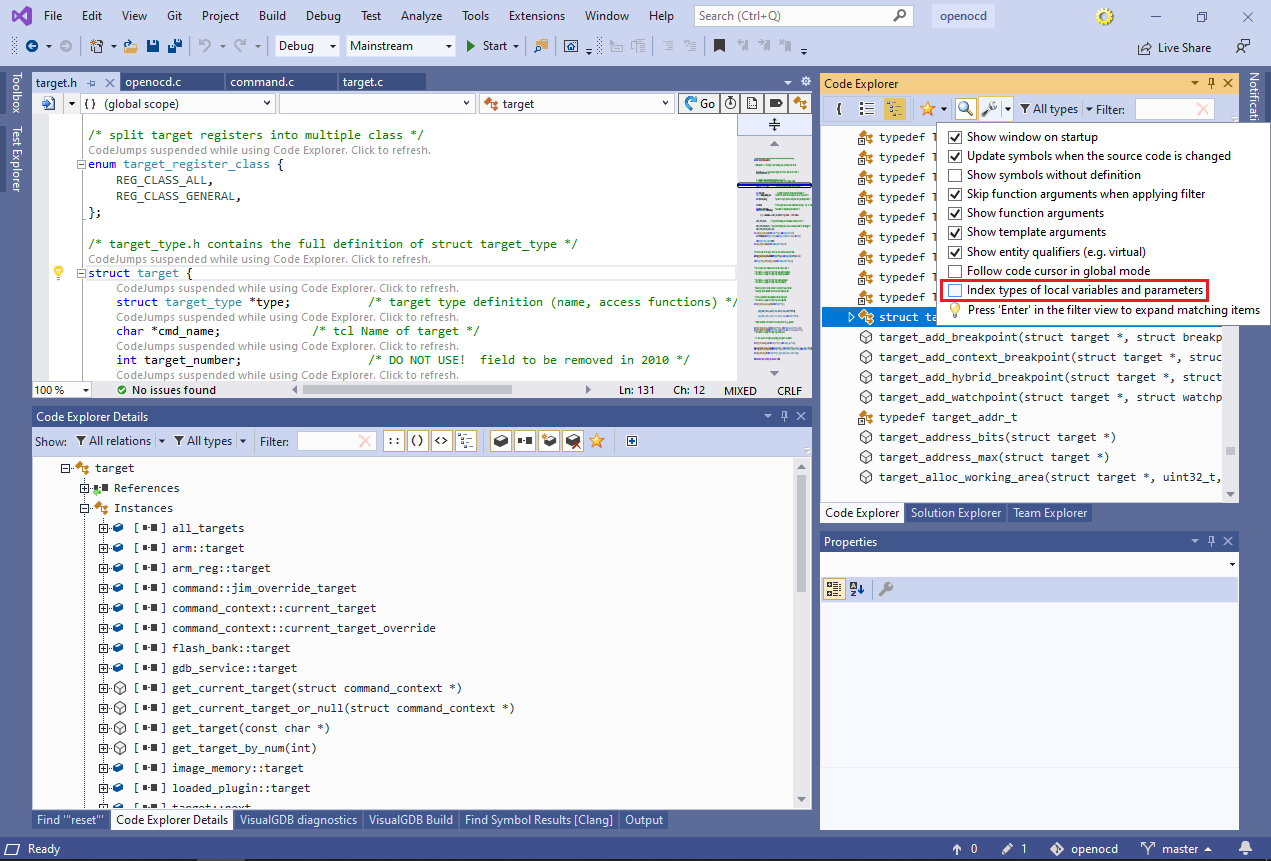
- Scroll the Details view to “referenced types” list. It shows all types referenced by fields of the target structure. Note how pointers and references are shown with different tags:
 Locate the target_type field and select “Locate in the Symbol List” from the context menu.
 - This will show all fields of struct target_type. Select the “add_breakpoint” field that contains a pointer to the target-specific breakpoint setting function to view all information about it:
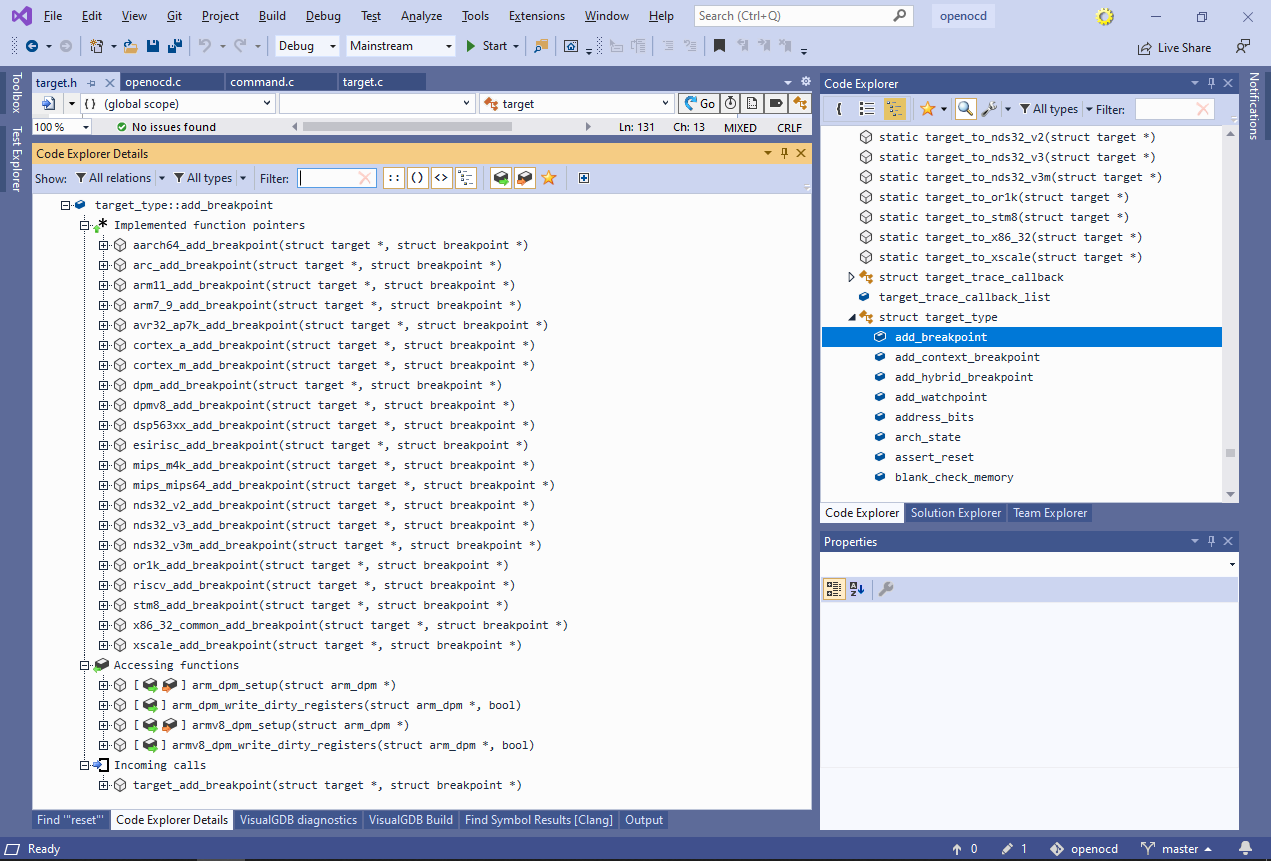 See how it shows all functions “implementing” this field (i.e. being assigned to it anywhere in the code), all functions reading/writing it, and the only function calling it.
 - We will now use Code Explorer to locate other breakpoint-related functions. Find “struct breakpoint” among the types referenced by target_add_breakpoint and select it in the symbol list. Then scroll the list of functions referencing it to the ones starting with “target”:
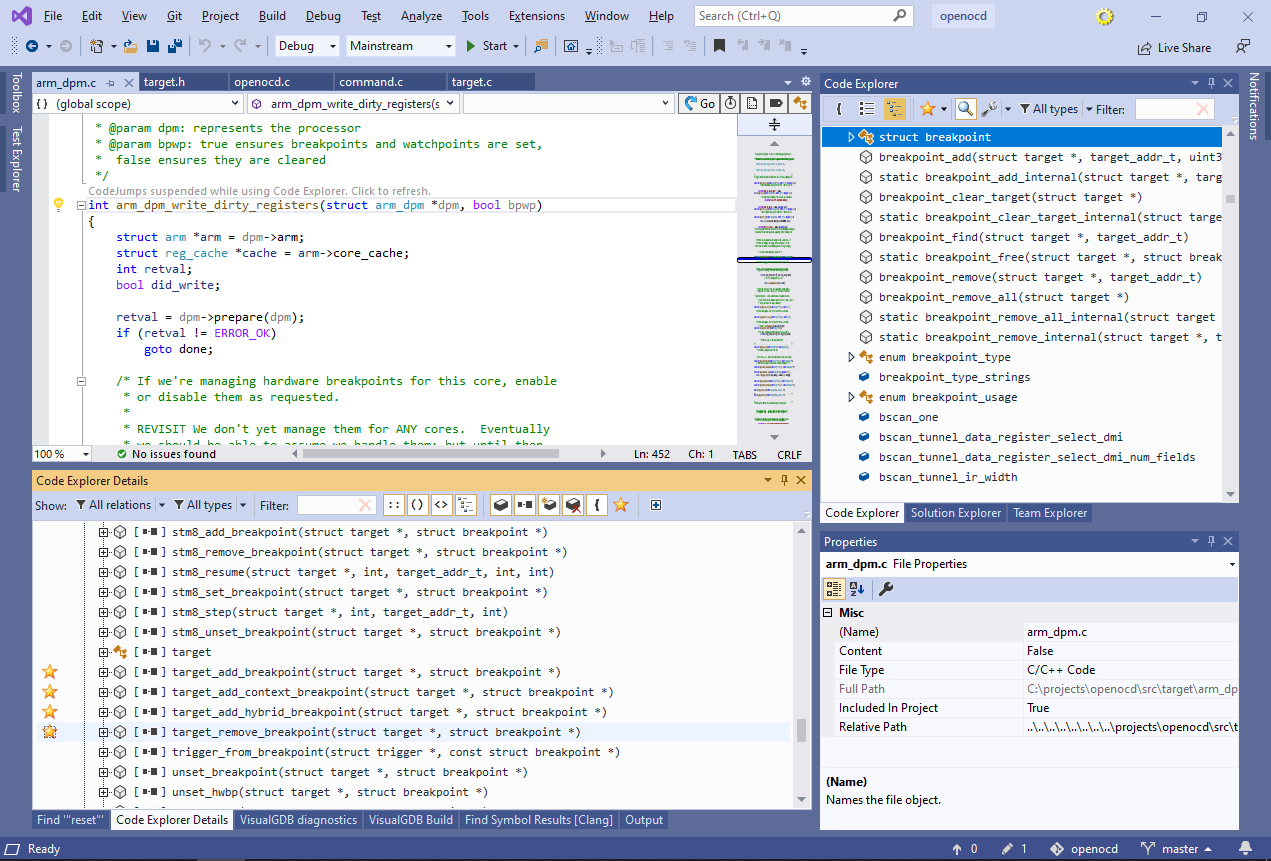 Flag the 4 functions shown above as “favorite” by clicking in the “favorite” column.
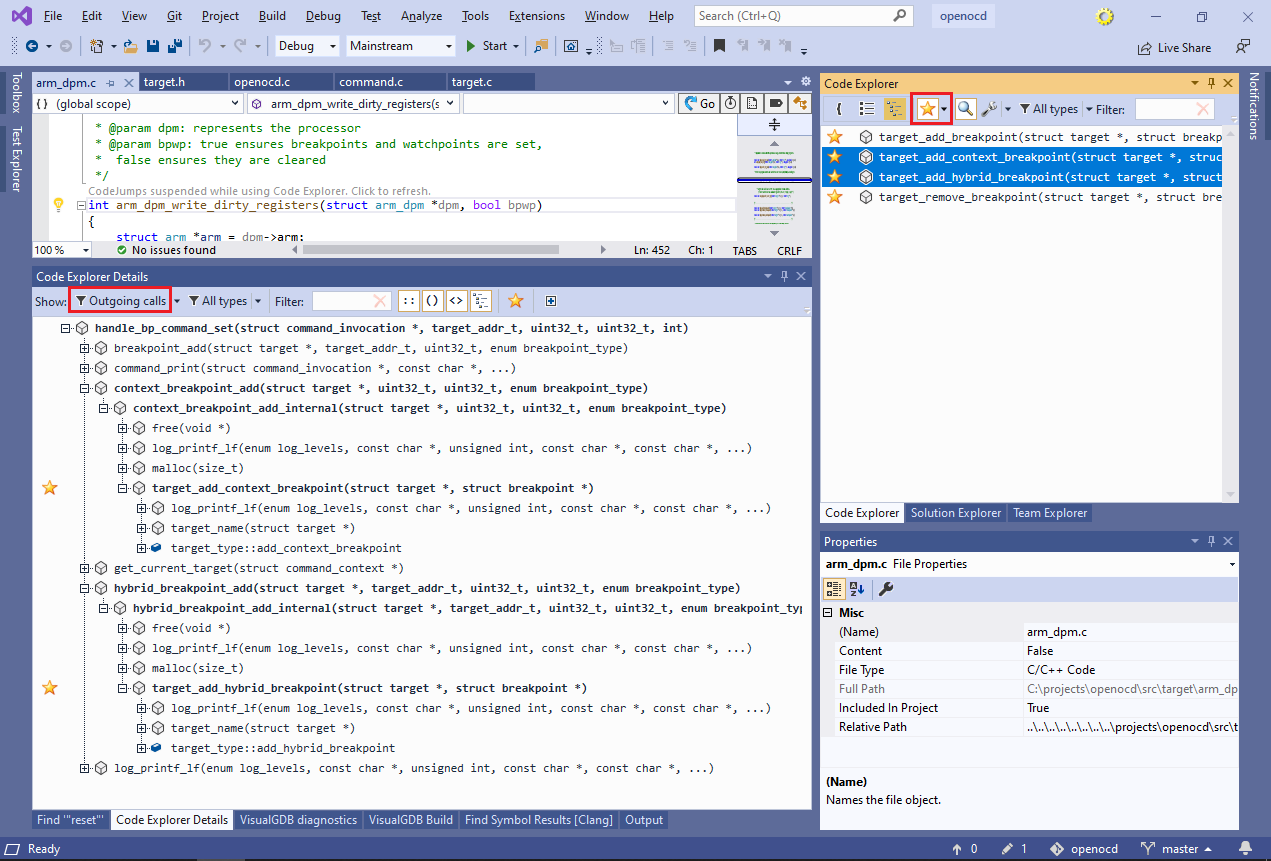
 - You can use the “favorite” flag to quickly flag functions for further review, and then instantly locate them in the symbol list. Enable the “favorites only” view in Symbol List, limit the displayed relations to Outgoing Calls, and select the “target_add_context_breakpoint()” and “target_add_hybrid_breakpoint()” functions:
 Code Explorer will find and display the common root – function that has all the selected function among its children on the call tree. If multiple roots are found, all of them will be displayed.
 - In large projects, the call tree can quickly grow huge even if inspecting a handful of functions. Use the “favorites only” filter in the Detail view to restrict it to favorite functions only:
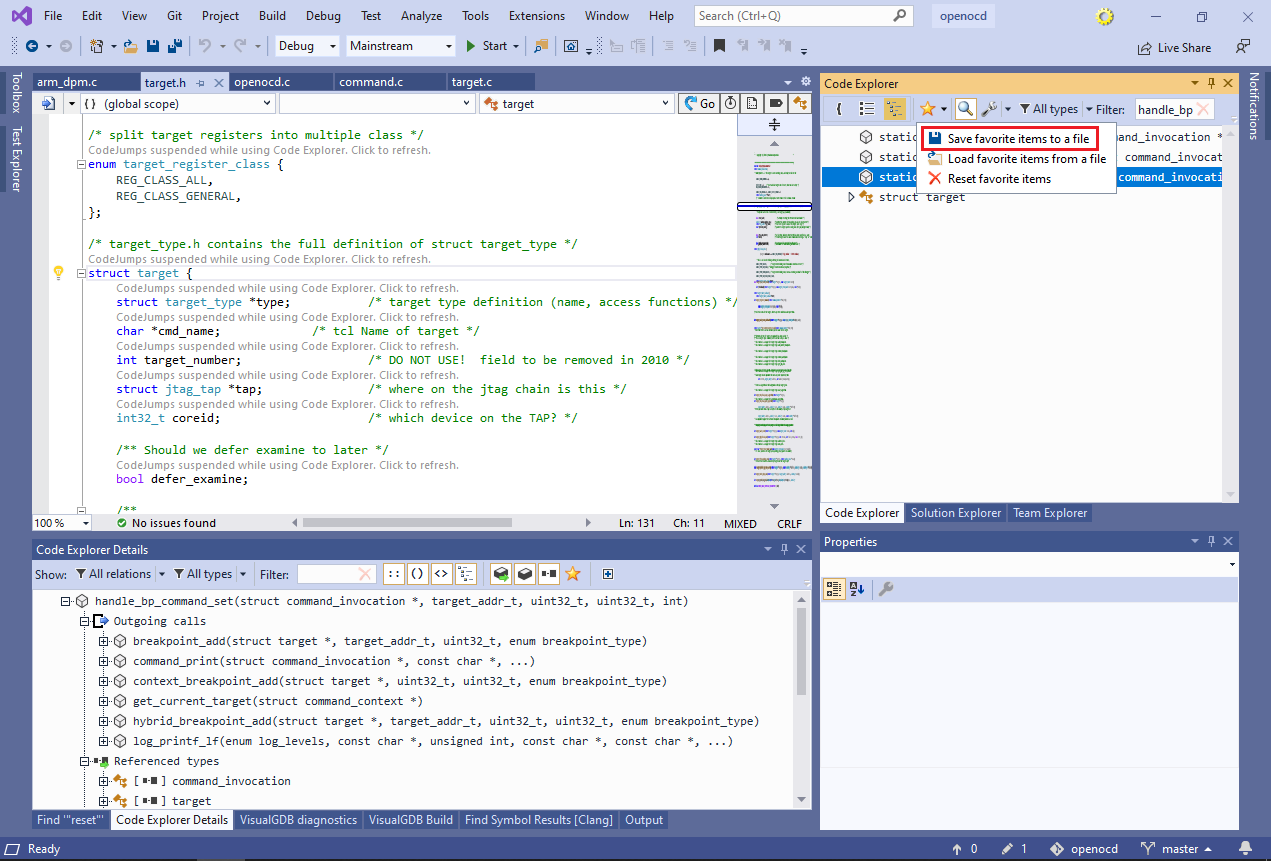
 This instantly shows that both target_add_context_breakpoint() and target_add_hybrid_breakpoint() can only be reached through a call to handle_bp_command_set() function.
 - You can manage multiple sets of favorite functions by saving the favorite lists to files. This allows revisiting certain combinations of functions (e.g. breakpoint-related functions) once the code base changes, and quickly getting up-to-date information about them: