Debugging programs built with Linux cross-compilers
This tutorial shows how to develop and debug applications built with a cross-compiler on one Linux machine and then deployed to another one.
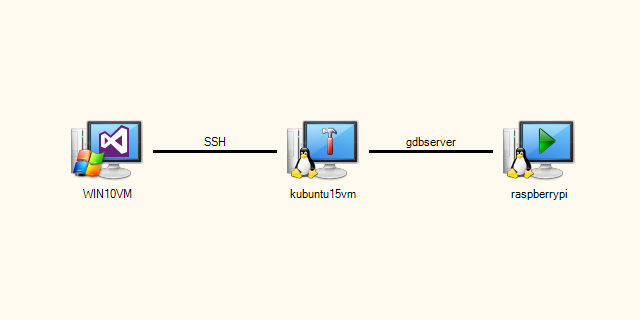
We will show how to configure VisualGDB to build a simple Raspberry Pi application on an x86 Linux machine, deploy it to Raspberry Pi and debug it there. Before you begin, install VisualGDB and ensure that your x86 Linux machine has the arm-linux-ghueabihf cross-compiler and a matching gdb.
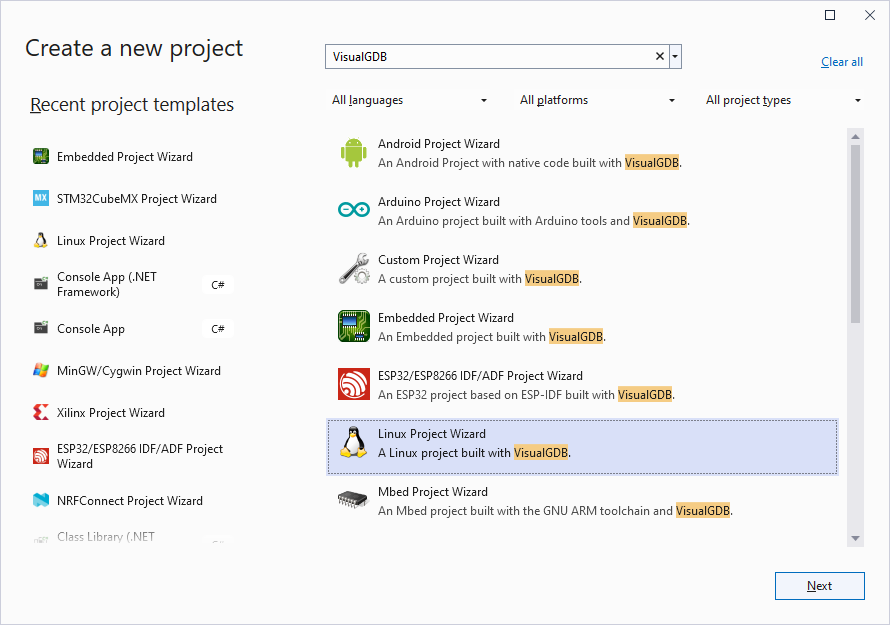
- Start Visual Studio and open the VisualGDB Linux Project Wizard:
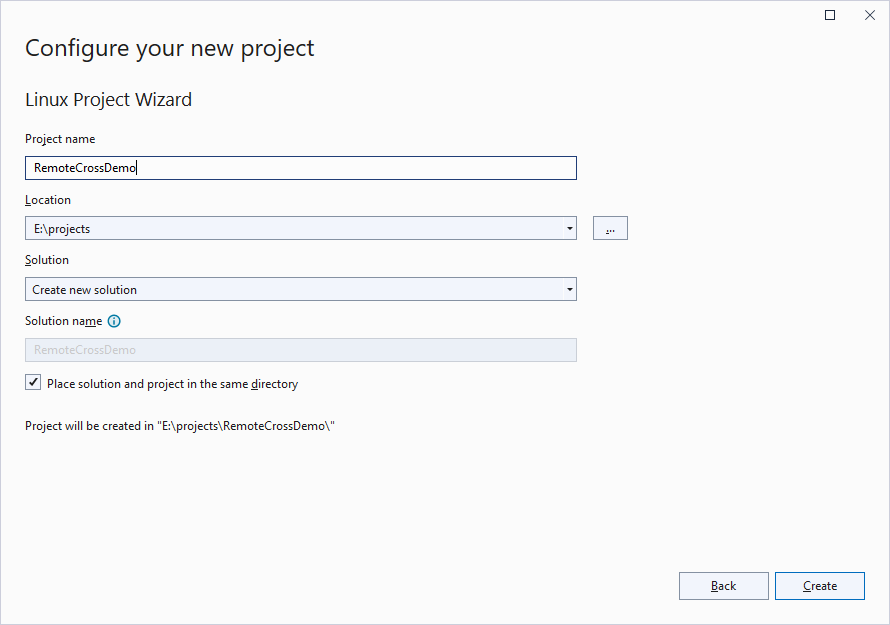
- Enter the name and location for your project:
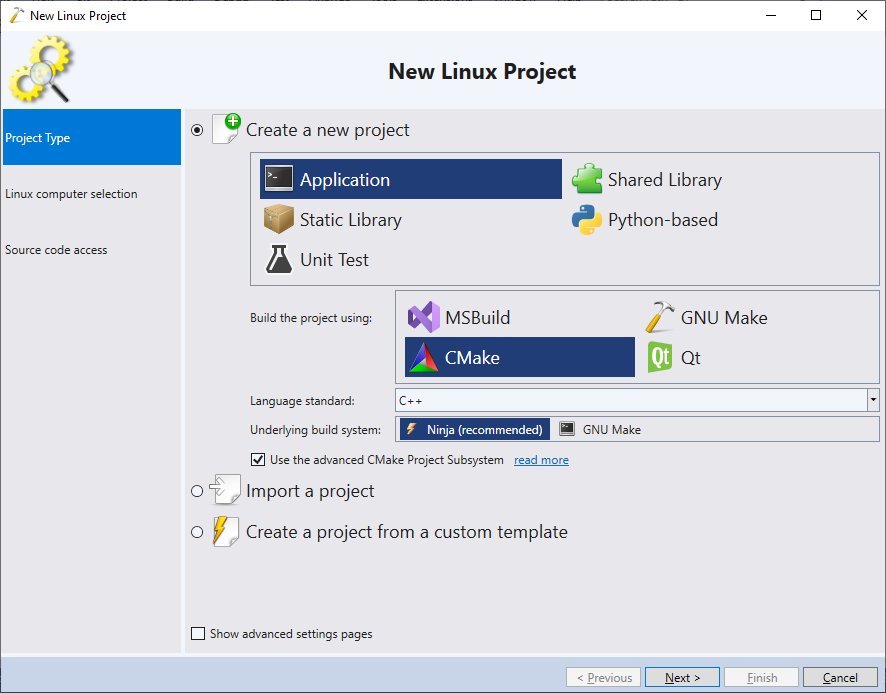
- Proceed with the default “Create a new project -> Application” setting. For most new projects we recommend using the Advanced CMake Project Subsystem:
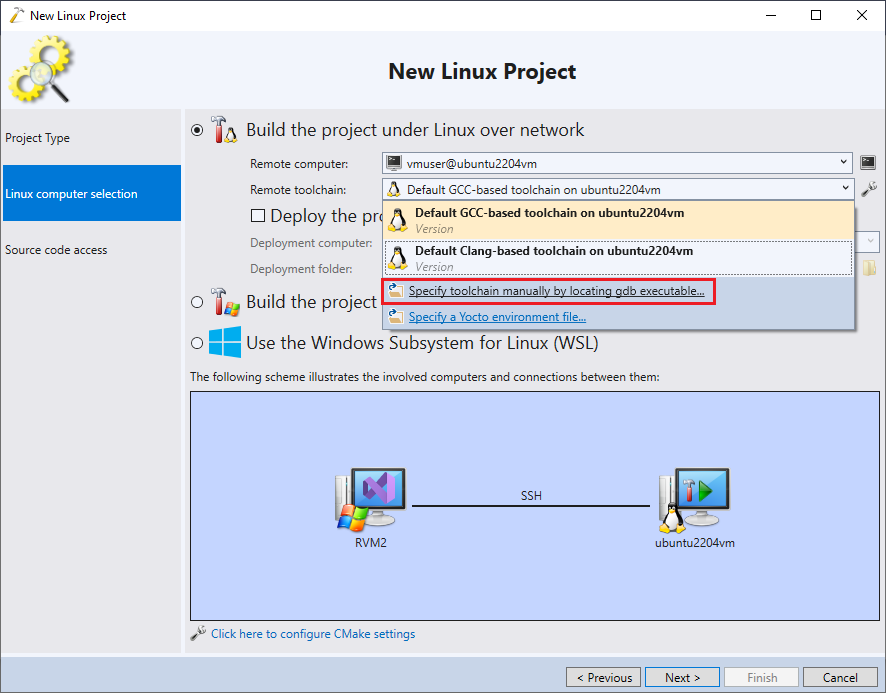
- On the next page select “Build the project under Linux over network” and select the build computer with the cross-toolchain. Then click “Specify toolchain manually by locating gdb“:
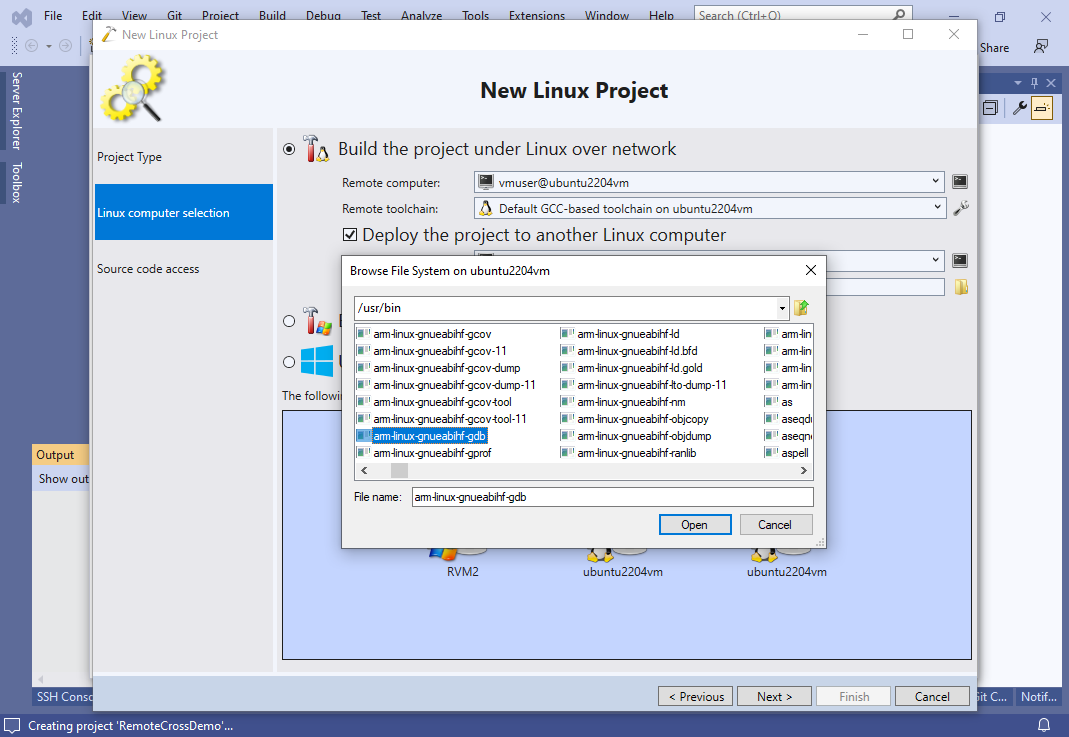
- VisualGDB will ask for the location of the gdb. Find it and click “Open”. In this example the gdb binary is called arm-linux-gnueabihf-gdb and is located in /usr/bin:
 Note that if you installed a cross-toolchain via a package manager (e.g. apt install gcc-arm-linux-gnueabihf or apt install g++-arm-linux-gnueabihf), it may not include a gdb executable. You can then install it via “apt install gdb-multiarch” and create a symbolic link to it via “sudo ln -s /usr/bin/gdb-multiarch /usr/bin/arm-linux-gnueabihf-gdb“.
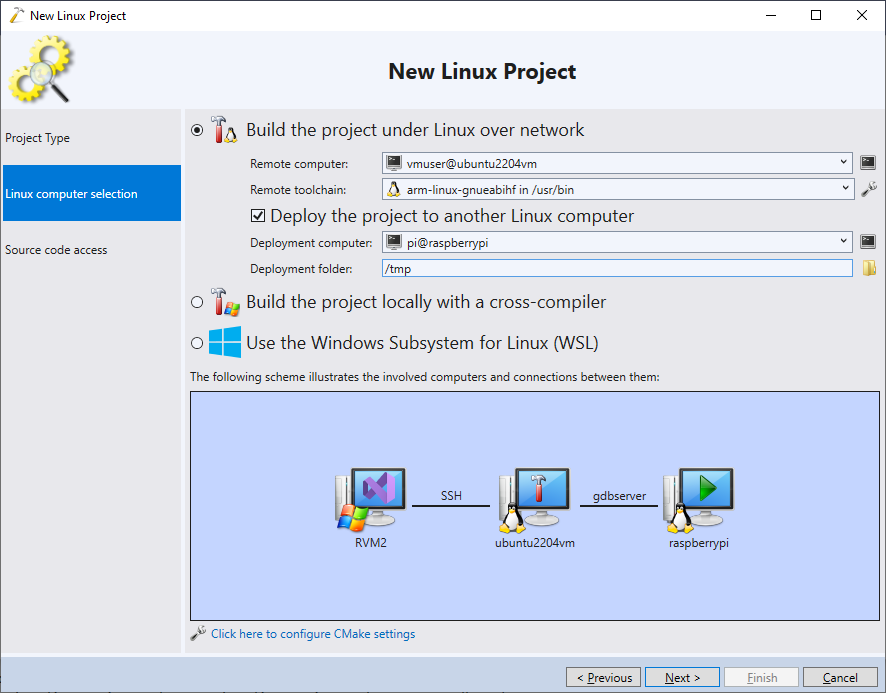
 - Enable the “Deploy” the project to another Linux computer checkbox and select your Raspberry Pi in the “Deployment computer” field:
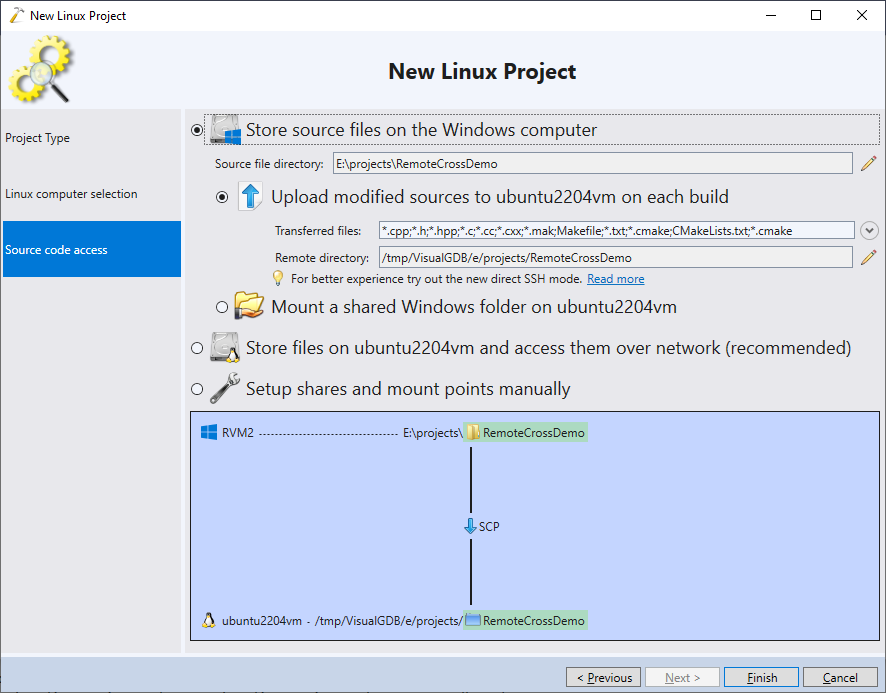
- On the next page select where should VisualGDB store your source files on the Linux machine. The easiest way is to proceed with the default settings and let VisualGDB manage the source file locations:
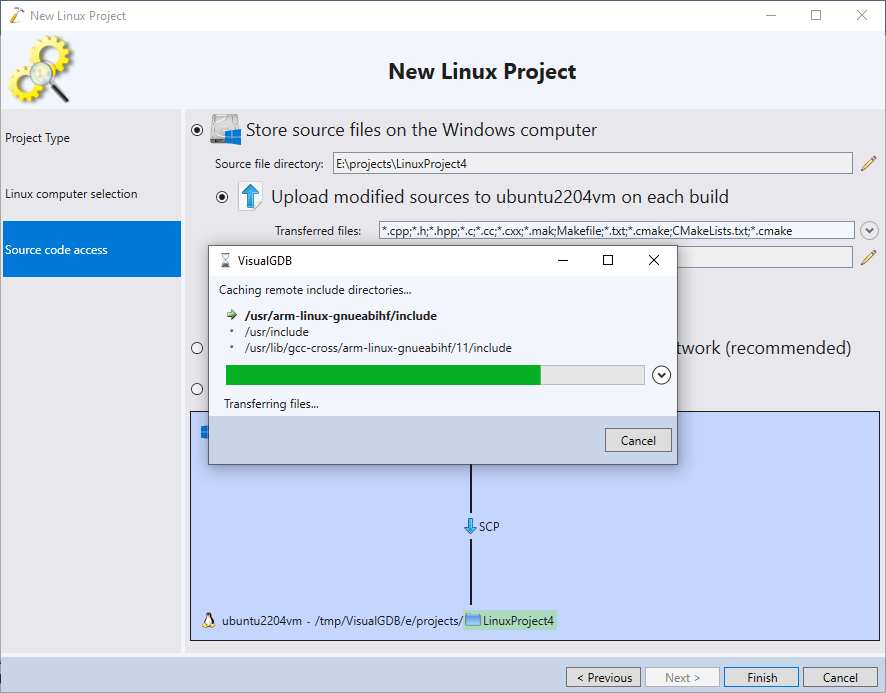
- Press “Finish” to generate your project. VisualGDB will automatically detect the include directories used by the cross-toolchain and cache them on the Windows machine to setup IntelilSense:
- Now we will slightly modify the project to actually print the hostname of the machine where it is running. Replace the contents of the main file with the following:
#include <iostream>
#include <unistd.h>

using namespace std;

int main(int argc, char *argv[])
{
    char hostname[1024] = { 0, };
    gethostname(hostname, sizeof(hostname));
    cout << "The host name is " << hostname << endl;    //<================= Put a breakpoint here
    return 0;
}
Then press F5 to build your project and start debugging it:
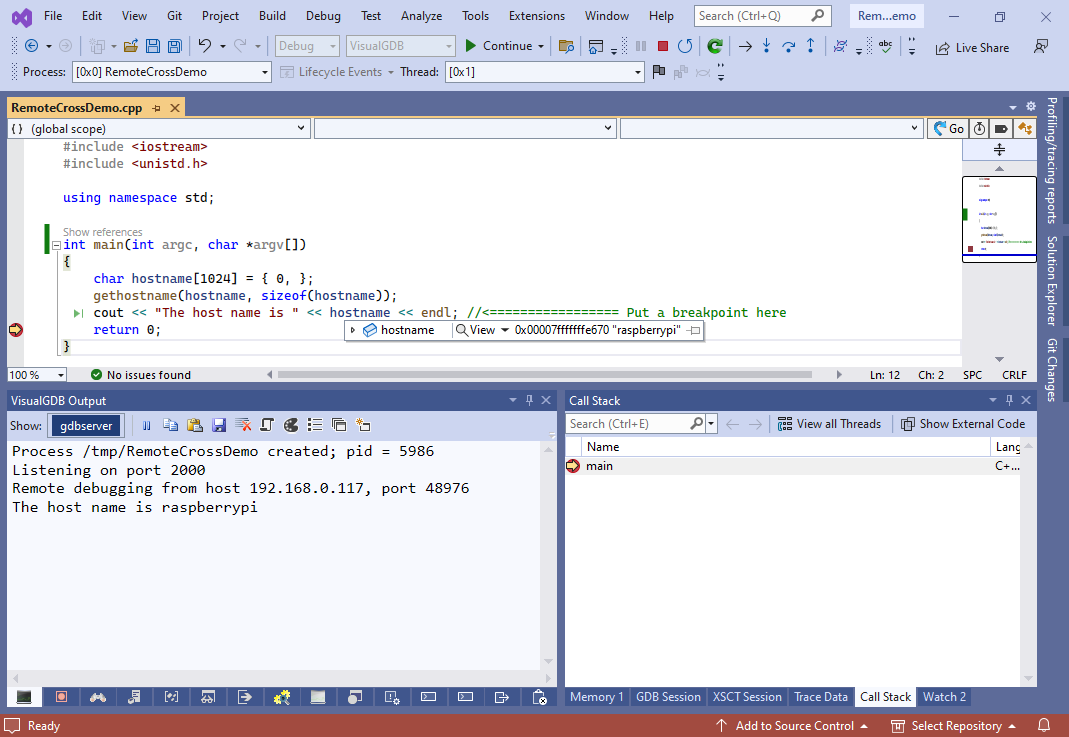 You will see that the project is built, deployed and the hostname matches the name of the deployment machine.
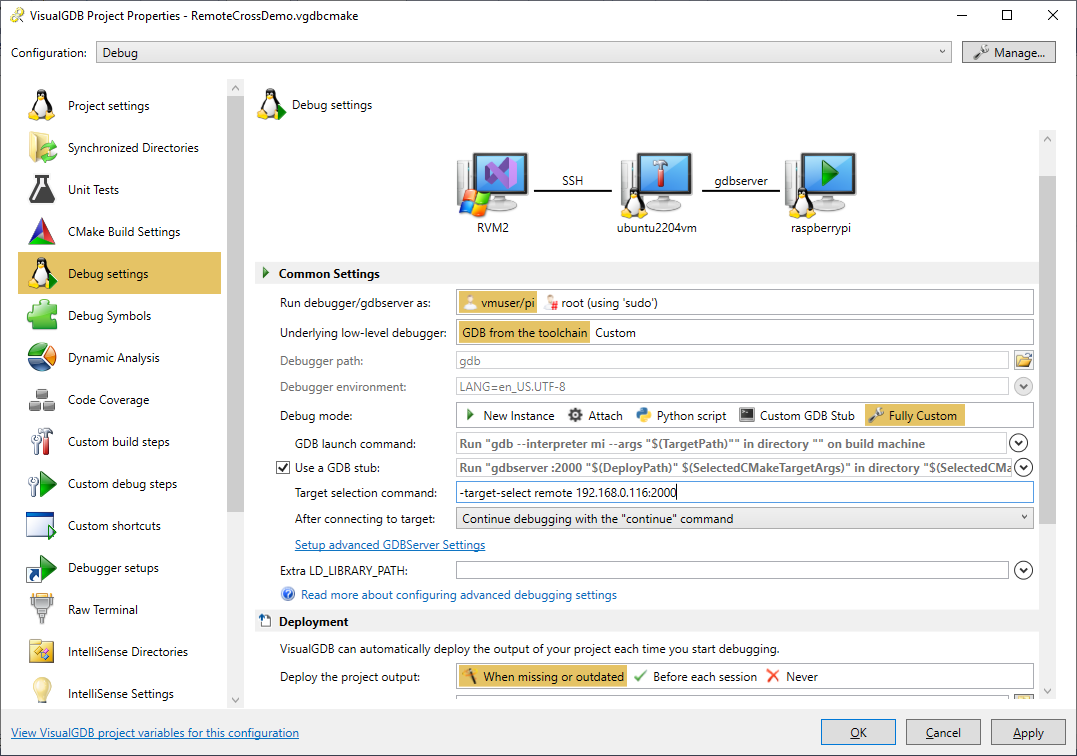
 - Sometimes the build machine cannot connect to the deployment machine because it cannot resolve the host name or it needs to use a different IP address. You can override this by opening VisualGDB Project Properties on the Debug Settings page and switching the target selection command to “target remote <IP>:<port>“. Ensure you set the “debugging start mode” to “Use ‘continue’ command“:
 You can double-check the command that VisualGDB uses to connect to the target by switching the GDB Session window to the “All GDB interaction” or “Raw output from GDB” mode and then searching for “target”:
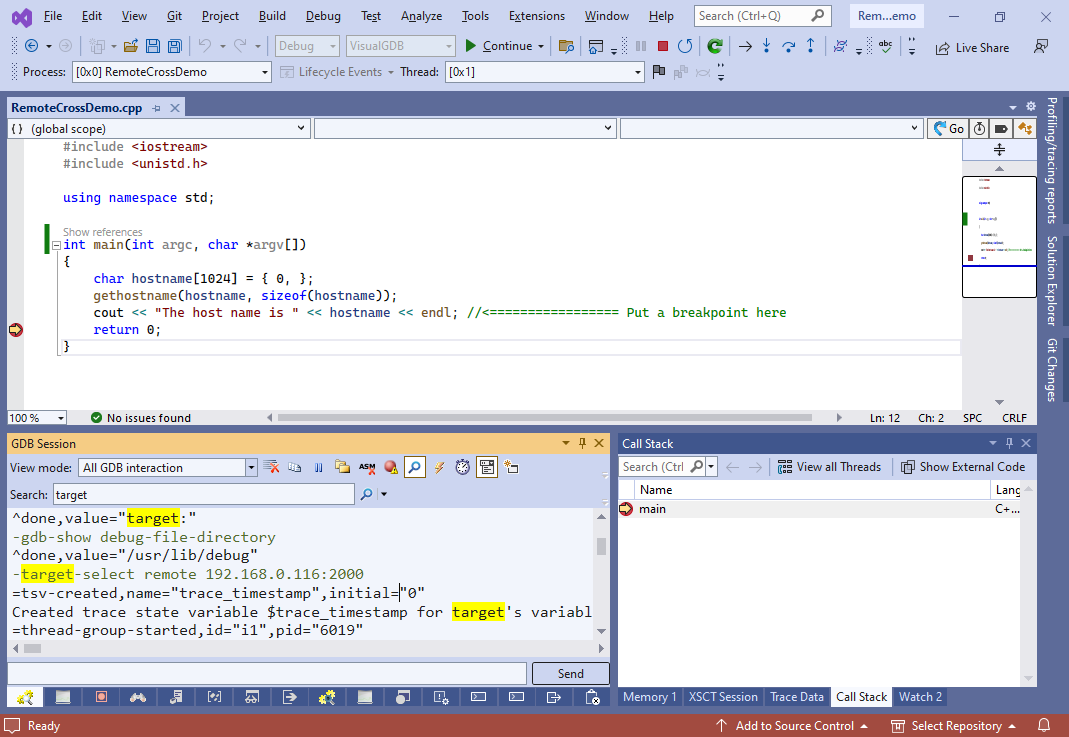
Note that normally VisualGDB would require the target to be accessible from the Windows machine via SSH. If there is no direct connection between the Windows machine and the target, but the target is accessible from the build machine, see this tutorial for detailed steps on configuring VisualGDB to handle it.