Debugging Windows Libraries built with GCC
This tutorial shows how to debug Windows libraries that were built using the GCC compiler and loaded into external applications. The library can be built either on Windows using the MinGW compiler, or on Linux using a cross-compiler (e.g. i686-w64-mingw32). As long as the library is built with sufficient debugging symbols, and you have its source code on the Windows machine, you can use VisualGDB to debug it.
In this tutorial we will create a very basic DLL using the MinGW compiler, load it into a C# application, and move the source directory to a different location to demonstrate the use of VisualGDB path mappings.
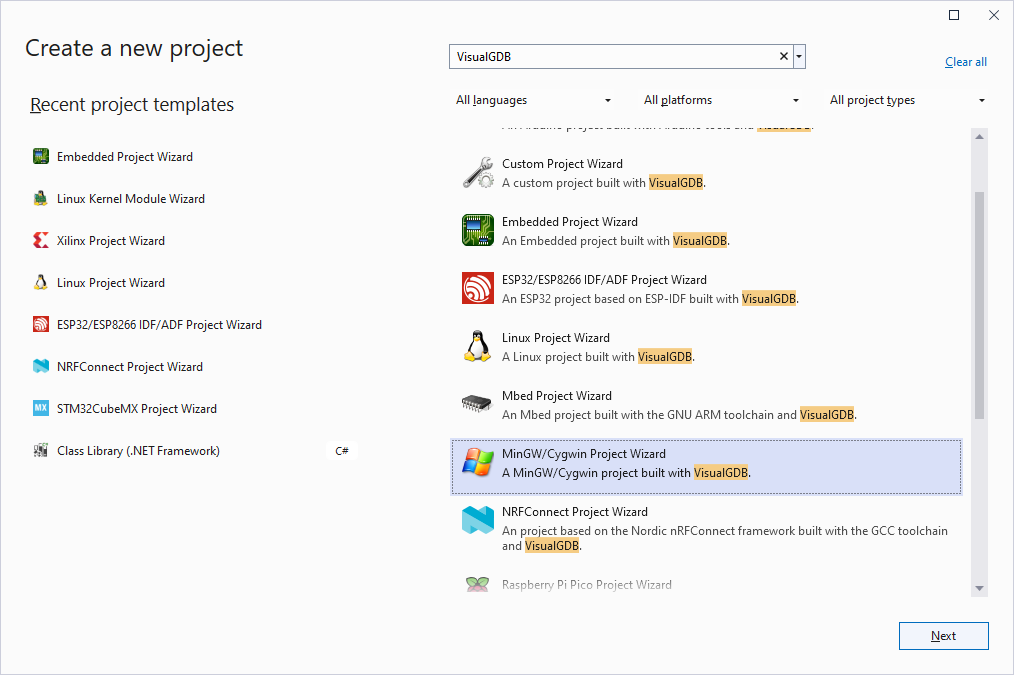
- Start Visual Studio and locate the VisualGDB’s MinGW/Cygwin project wizard. We will use it to create the DLL, so if you already have one, you can skip this part:
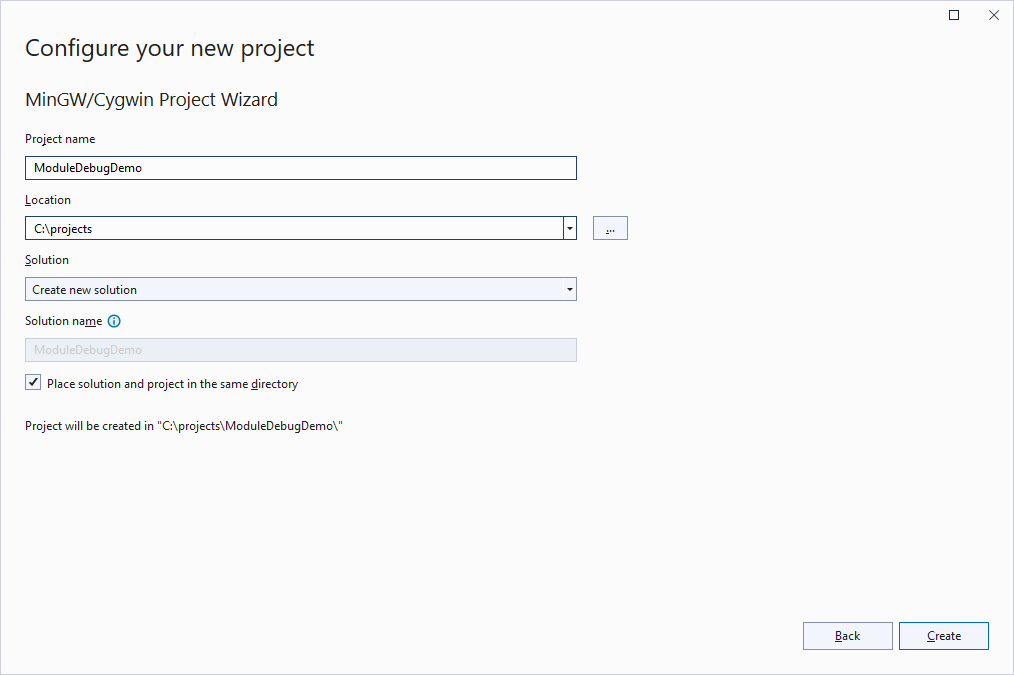
- Enter the name and location for your project:
- Select “Create a new project -> Shared Library -> CMake”:
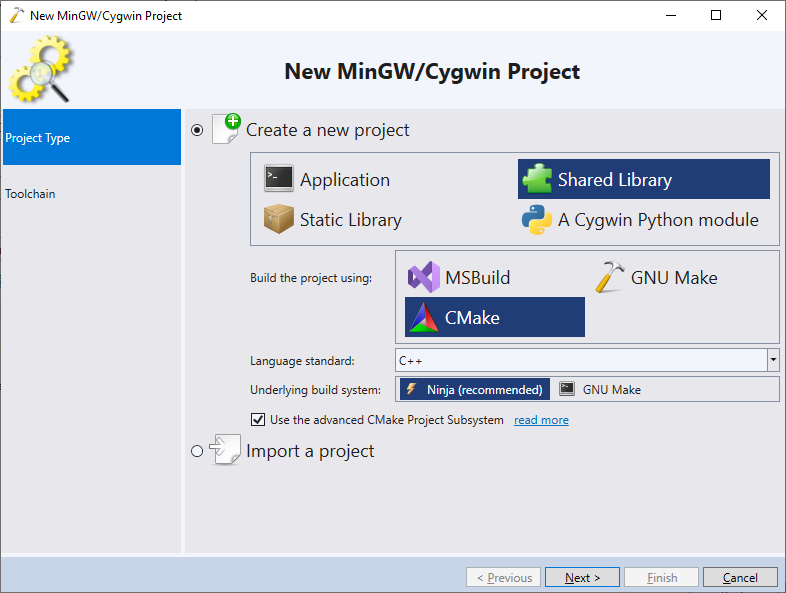
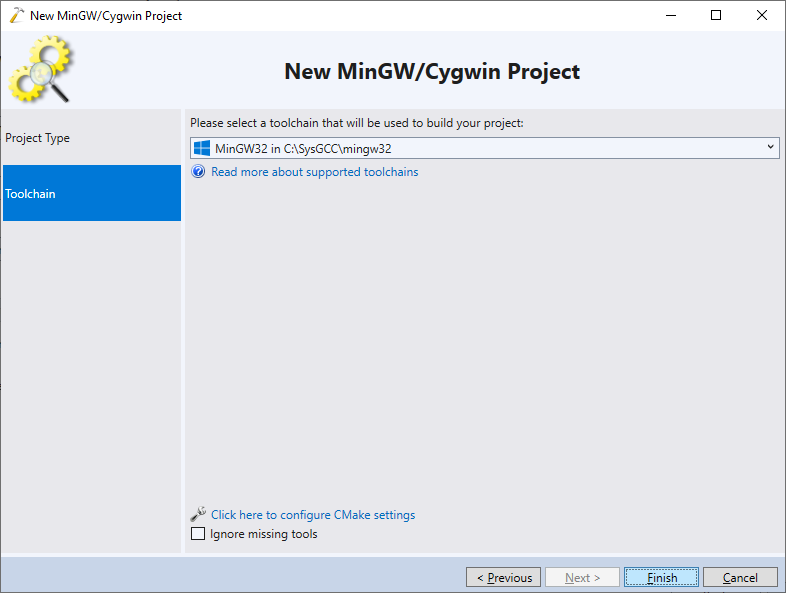
- Select the toolchain you would like to use. In this tutorial, we will build the library using the 32-bit MinGW toolchain:
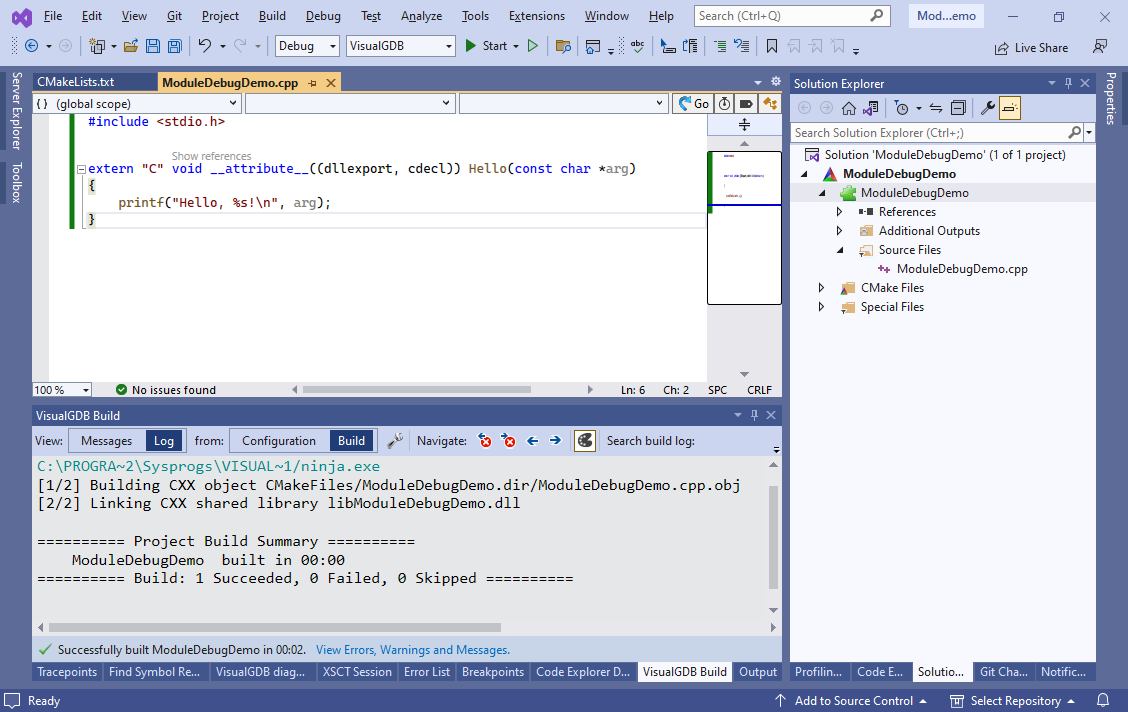
- Press “Finish” to generate the project. Replace the contents of the main source file with a very basic function that outputs a “Hello” message:
#include <stdio.h>

extern "C" void __attribute__((dllexport, cdecl)) Hello(const char *arg)
{
    printf("Hello, %s!\n", arg);
}
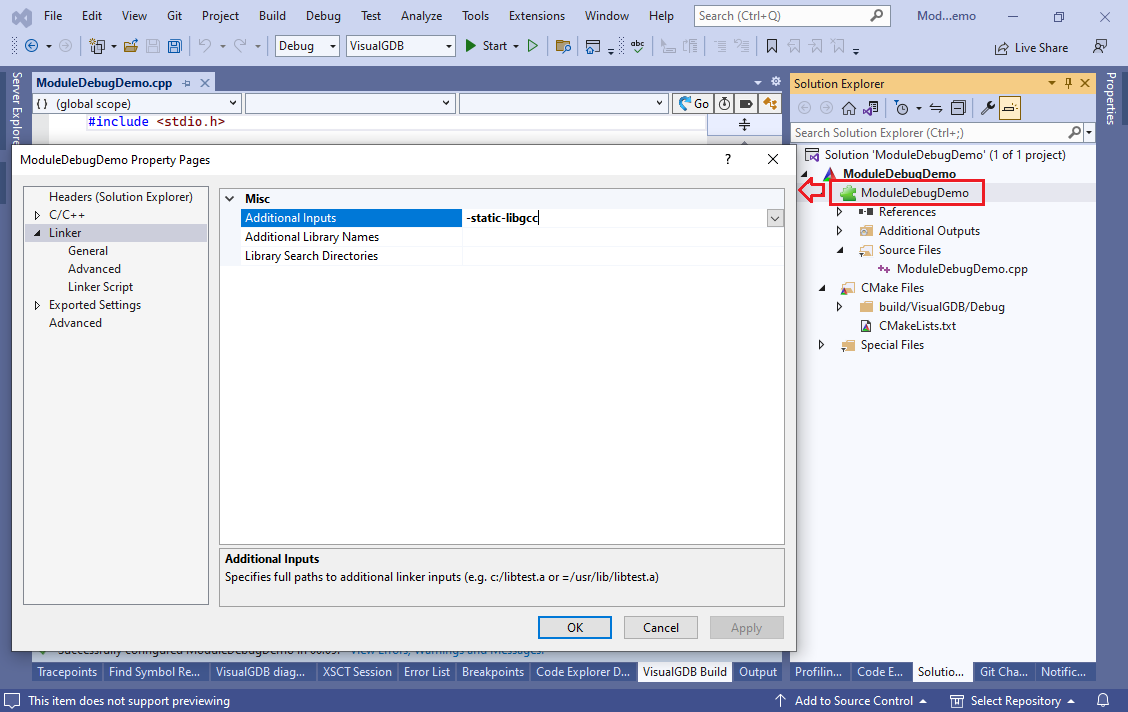
- Normally, MinGW will link the library against a dynamic version of libgcc (library implementing exceptions and other low-level functionality). To avoid it, add “-static-libgcc” to Linker->Additional Inputs for the DLL module:
 Then, use the Build->Build Solution command to build it.
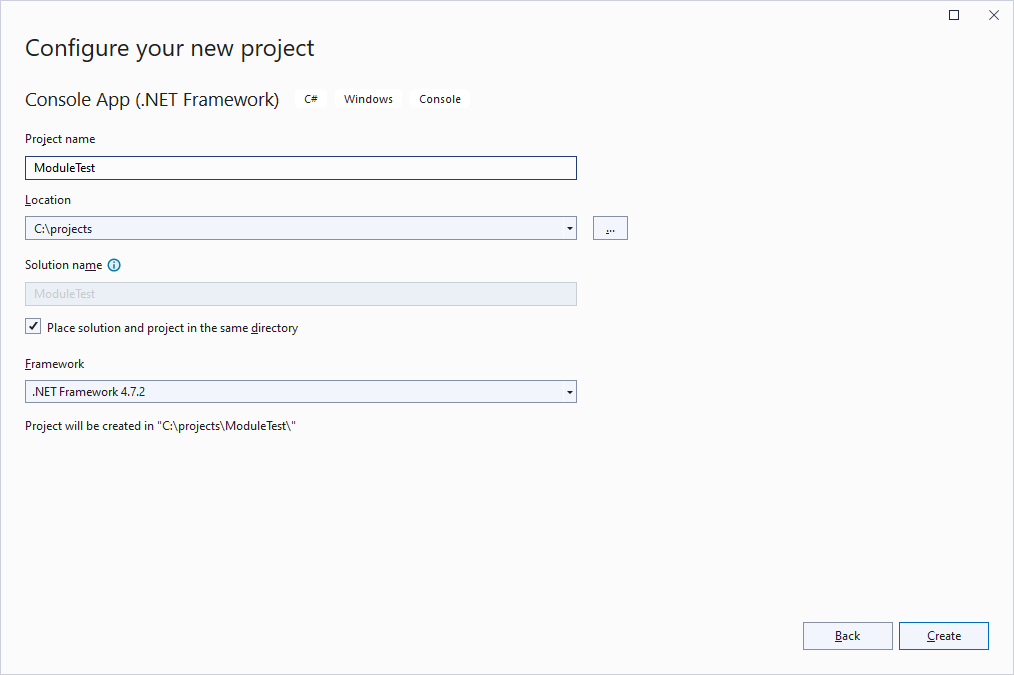
 - Now we will create a basic C# application that will load the library. If you already have an application that loads the DLL, you can skip this part as well. Otherwise, select the Console App (.Net Framework) wizard and proceed to creating a basic app:
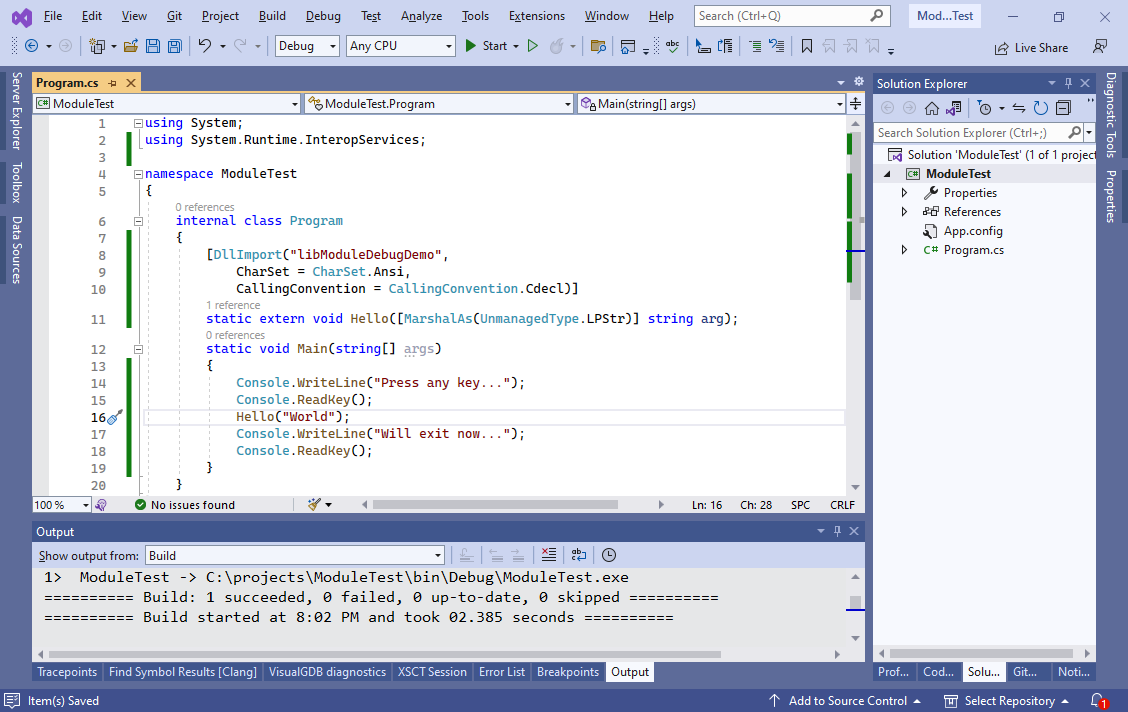
- Replace the main source file contents with this:
using System;
using System.Runtime.InteropServices;

namespace ModuleTest
{
    internal class Program
    {
        [DllImport("libModuleDebugDemo",
            CharSet = CharSet.Ansi,
            CallingConvention = CallingConvention.Cdecl)]
        static extern void Hello([MarshalAs(UnmanagedType.LPStr)] string arg);

        static void Main(string[] args)
        {
            Console.WriteLine("Press any key...");
            Console.ReadKey();
            Hello("World");
            Console.WriteLine("Will exit now...");
            Console.ReadKey();
        }
    }
}
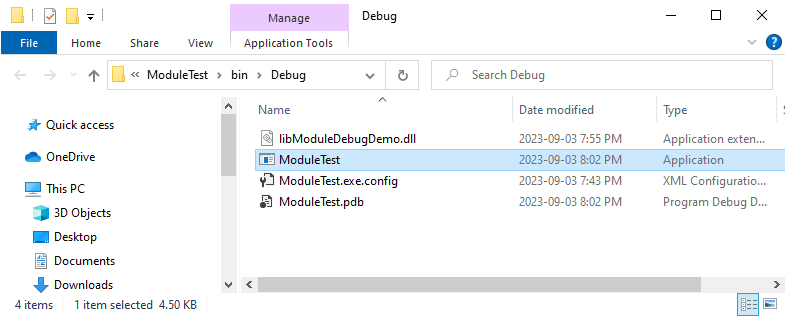
- Build the application and copy the libModuleDebugDemo.dll file to the directory containing the built executable:
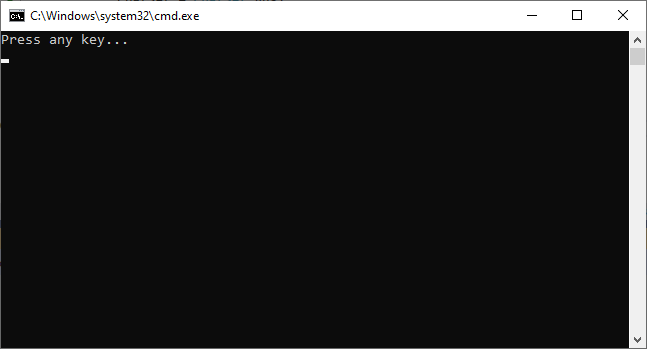
- Run the executable and wait for it to show the “Press any key” prompt. As soon as your press any key, the application will load the GCC-built library and will call a function from it:
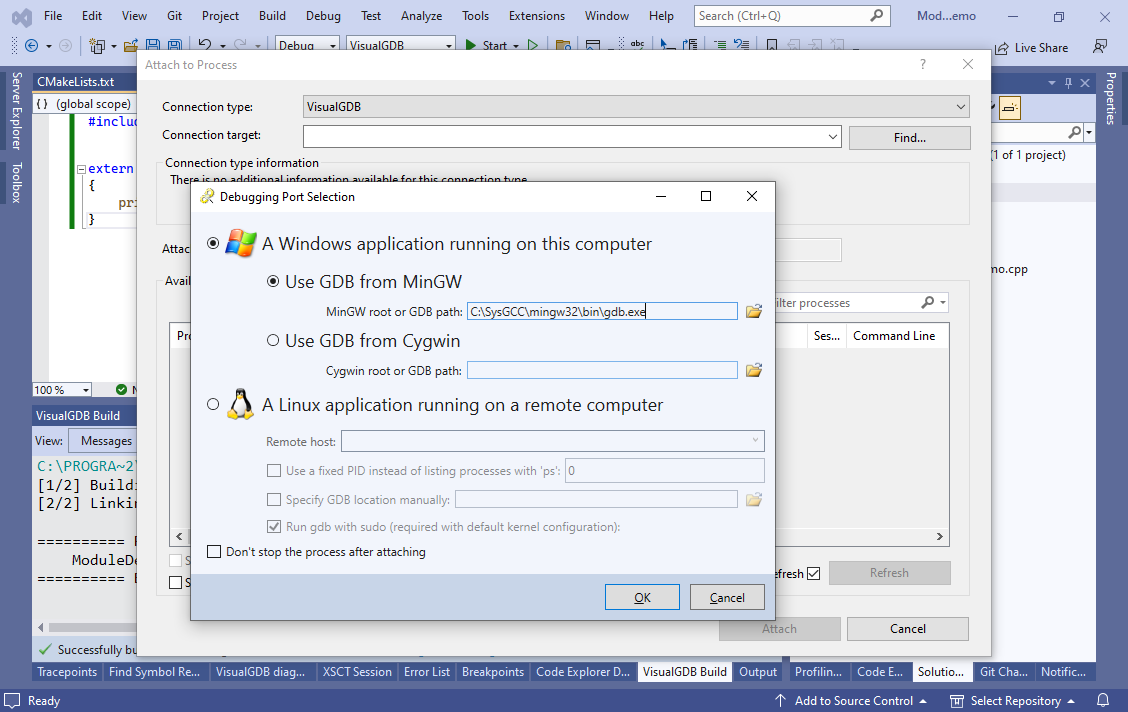
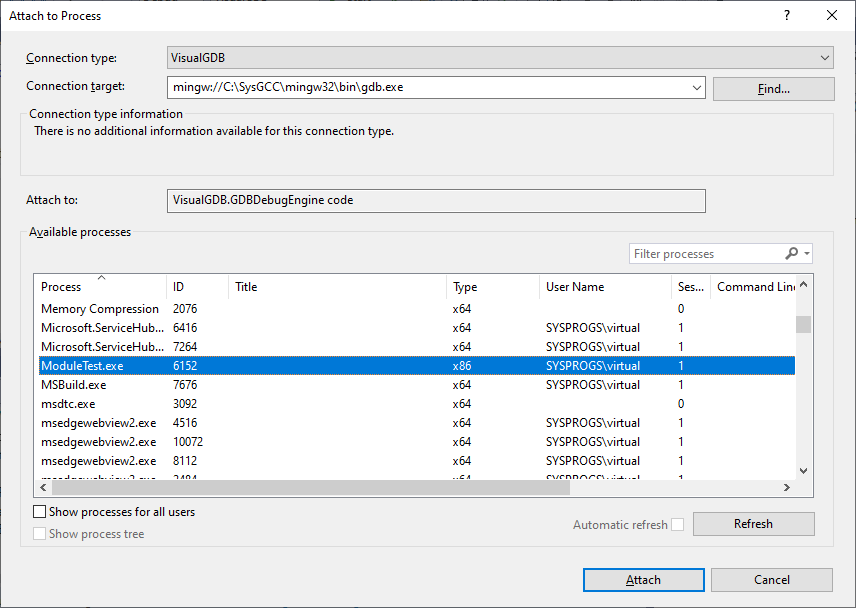
- There are 2 ways to debug our DLL with VisualGDB. The first option is to use the Debug->Attach command. It works the best if the application can wait before calling the functions you are intending to debug. Set Connection Type to VisualGDB and click “find” button next to the Connection Target selector. Then, point VisualGDB to your gdb executable (part of the MinGW toolchain, but can be downloaded separately):
- Select the process you would like to attach to and click “Attach”:
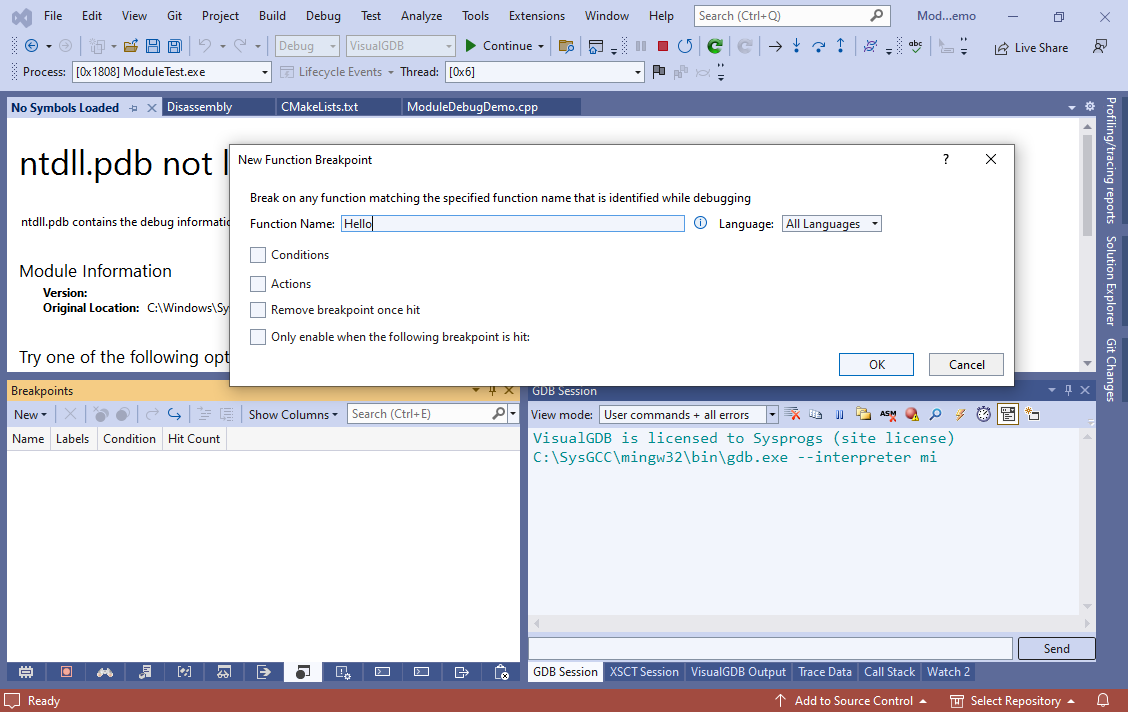
- Normally, VisualGDB would expect the source file paths in the debug symbols to match the paths on your system (we will show later how to tweak it). If you are not sure about the paths, you can set a breakpoint in any function by name using the Debug->Windows->Breakpoints window. Set a breakpoint in the Hello function and resume the application:
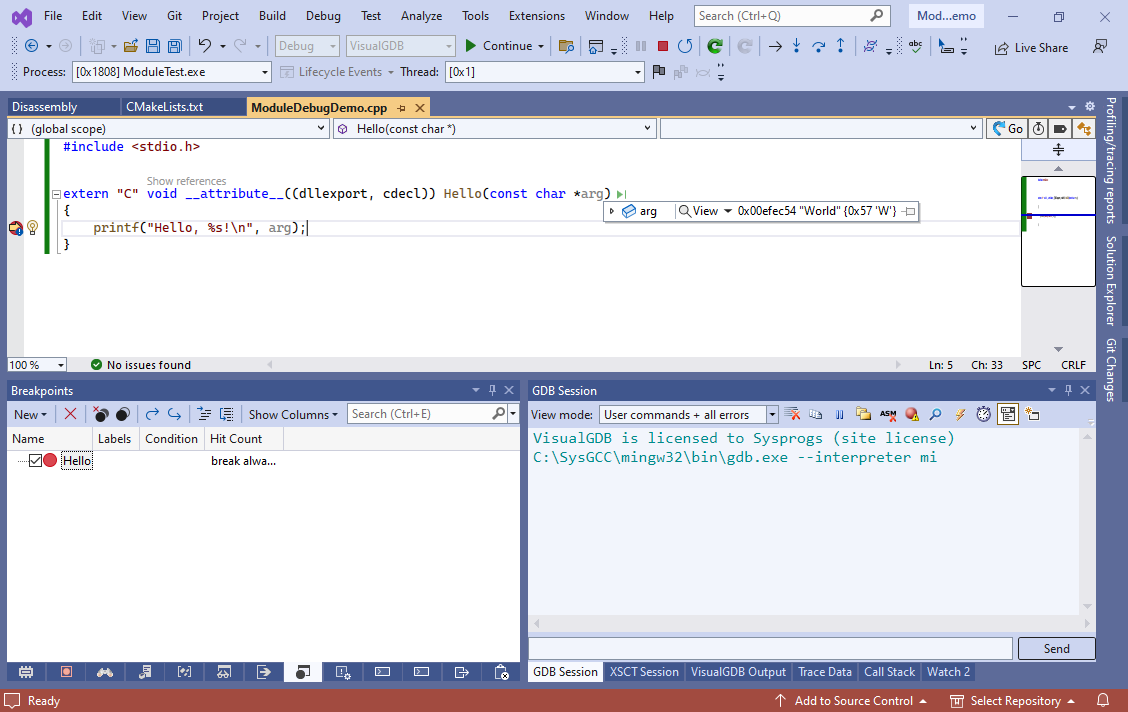
- Once you hit Enter in the C# application’s window, it will call the Hello() function and the breakpoint will trigger:
- We will now show a different way to debug the DLL that allows customizing additional parameters. Move the directory of the source files under a different name (to simulate a library that was built on a different machine). Then start another instance of Visual Studio, manually open the source file and set a breakpoint in it:
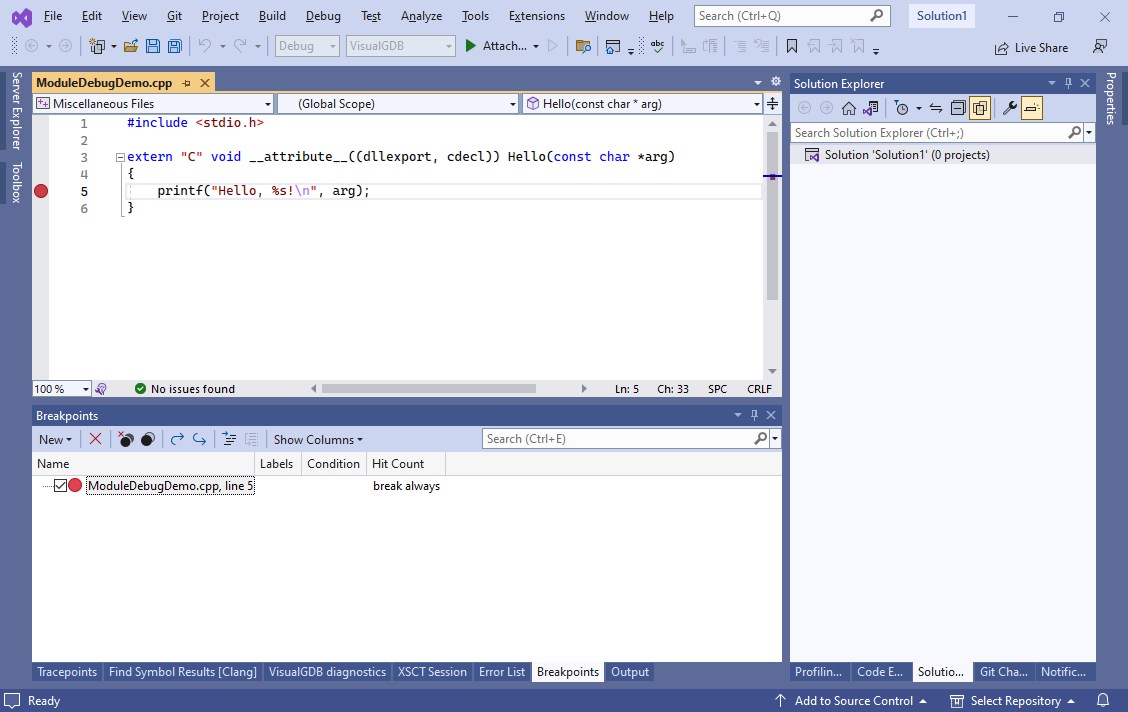 You do not need to create any projects or open any solutions, although if you already have a solution, you can reuse it.
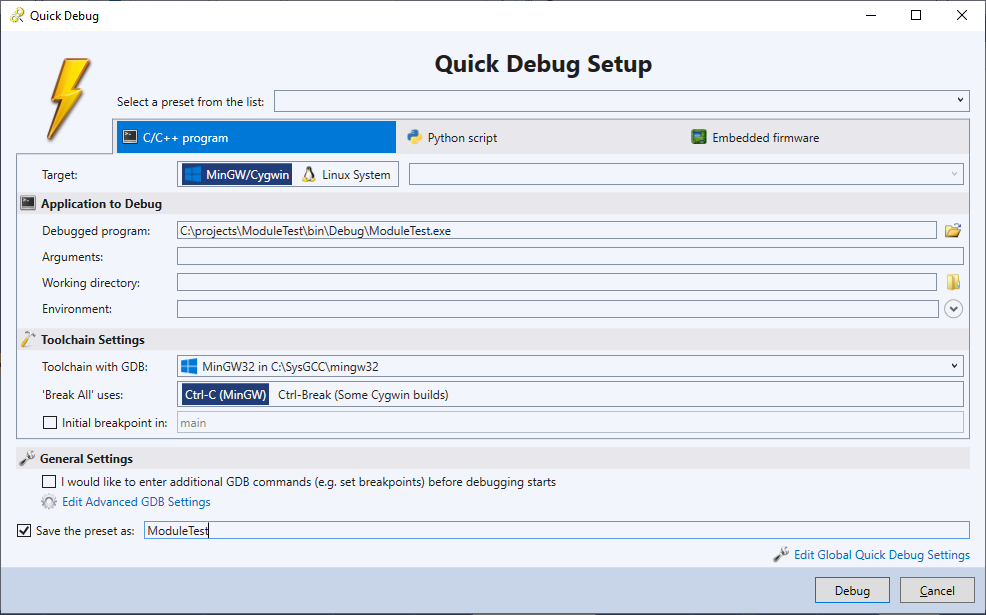
 - Click Debug->Quick Debug With GDB. Select the debuggable application, the toolchain with GDB, and click “save the preset as” to save these settings for later:
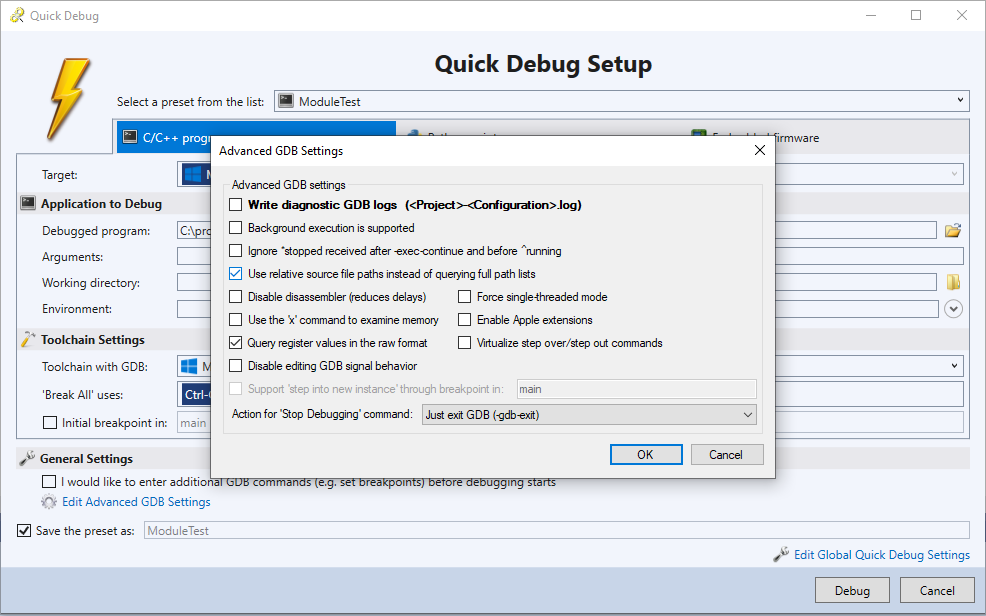
- Click “Edit advanced GDB Settings” and check the “Use relative source file paths” checkbox to allow easier matching of source files (e.g. c:\test.cpp will match /home/user/test.cpp recorded at build time):
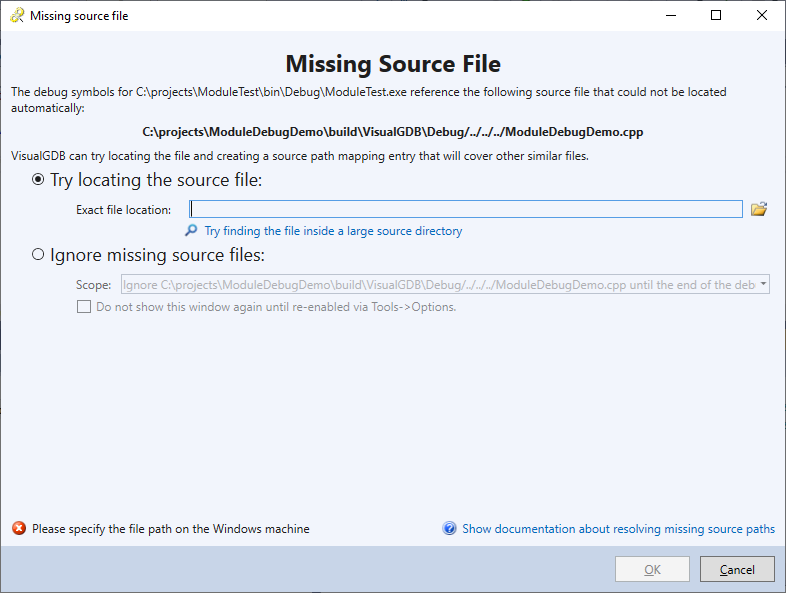
- Press “Debug” to start debugging and allow the C# application to call the function. The breakpoint will hit and VisualGDB will warn that the source file reported by gdb does not exist:
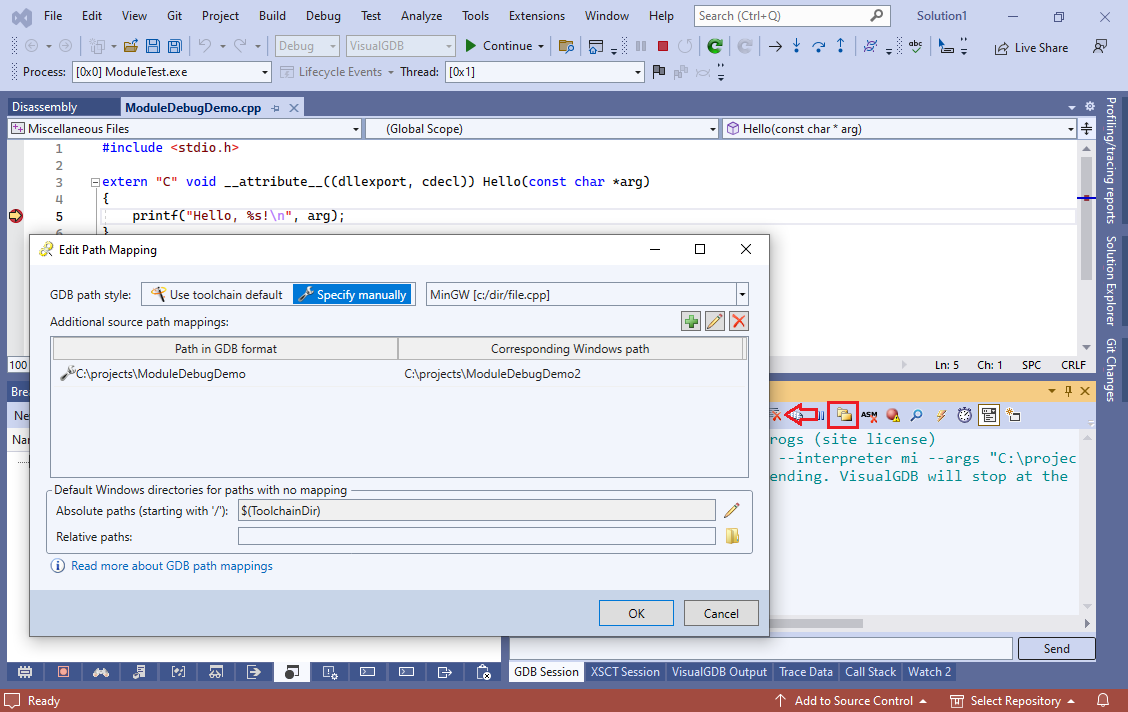
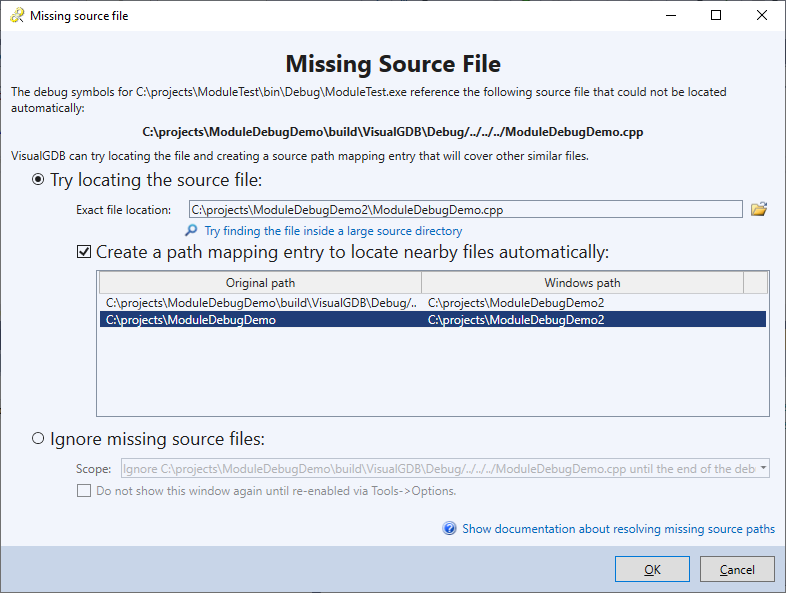
- Point VisualGDB to the ModuleDebugDemo.cpp file. It will suggest creating a path mapping automatically covering other similar sources. In this example, the most generic mapping is “C:\projects\ModuleDebugDemo => C:\projects\ModuleDebugDemo2“:
- Source-level debugging will now work just fine. You can use the Edit Path Mapping button in the GDB Session window to verify the mappings configured in the quick debug preset: