Analyzing Code Coverage for Linux Test Projects
This tutorial shows how to use VisualGDB to quickly analyze the code coverage of your Linux Unit Test projects. We will create a basic test project based on the GoogleTest framework and show how to quickly find functions with incomplete coverage. We will also show how to use the call information displayed by VisualGDB to quickly find potential causes for bugs.
Before you begin, install VisualGDB 5.3 or later.
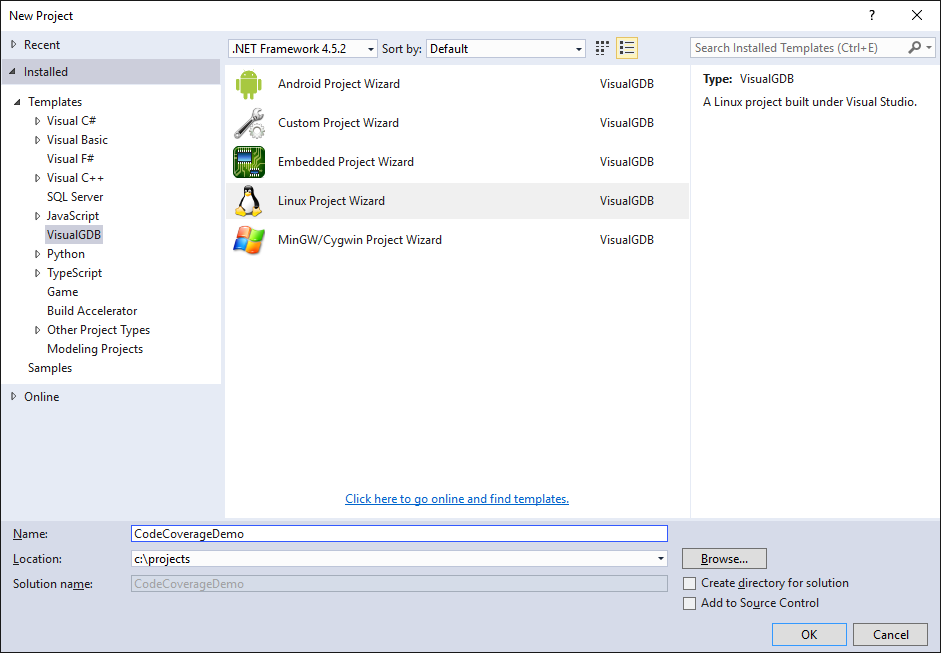
- Start Visual Studio and open the VisualGDB Linux Project Wizard:
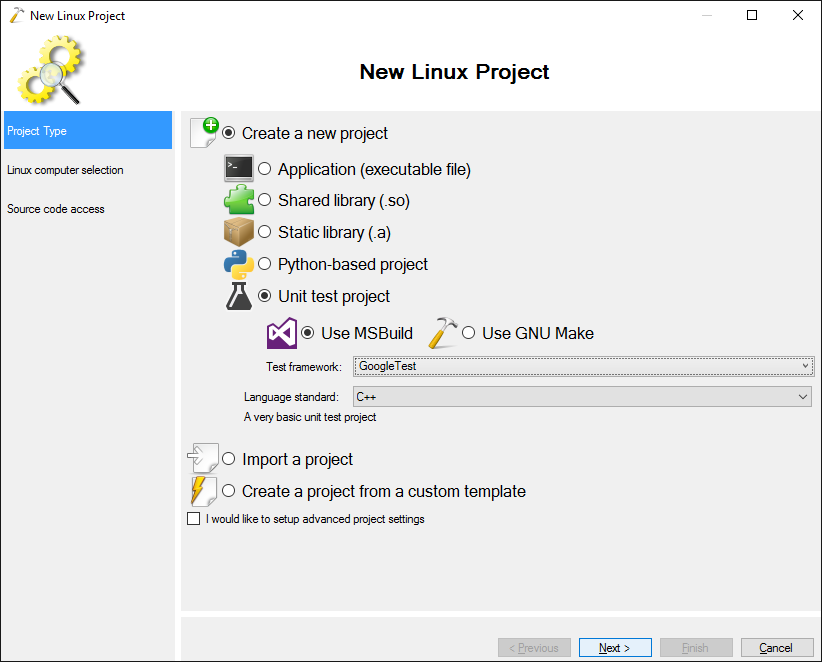
- On the first page of the wizard select “Unit test project -> Use MSBuild” and pick your test framework. In this example we will use GoogleTest:
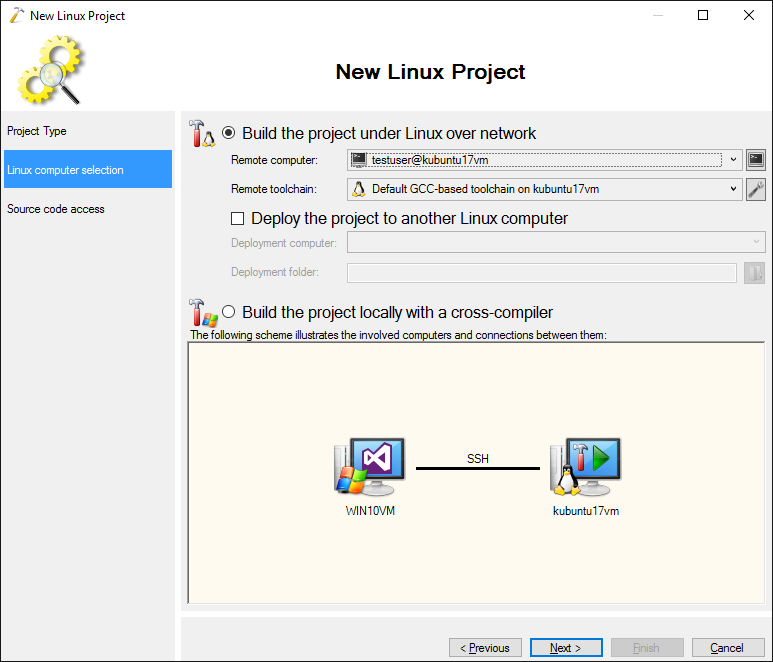
- On the next page select the remote computer you want to target. In this tutorial we will build the code directly on Linux and VisualGDB will automatically collect and analyze code coverage reports and transfer them to Windows. Once you have selected the remote computer, click “Next”:
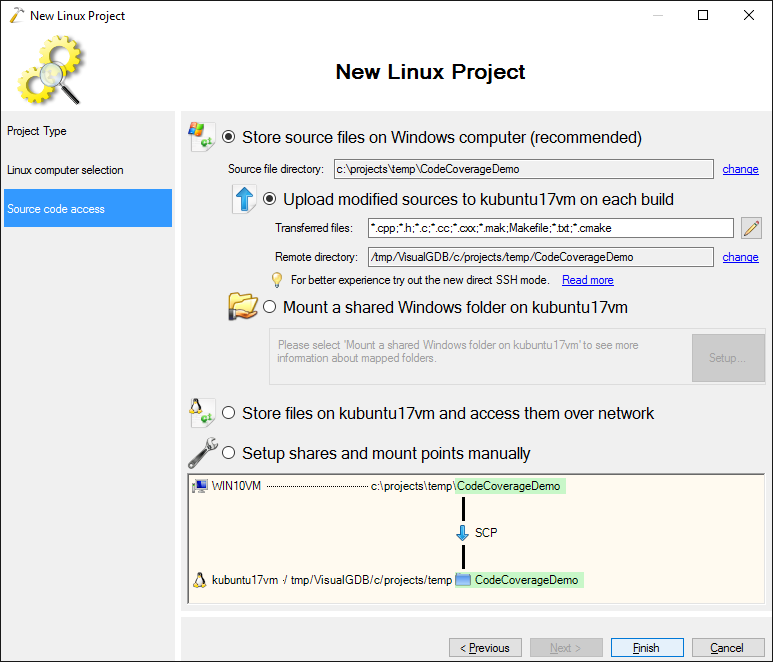
- Proceed with the default source access settings (upload modified sources via SSH) and click “Finish” to create the project:
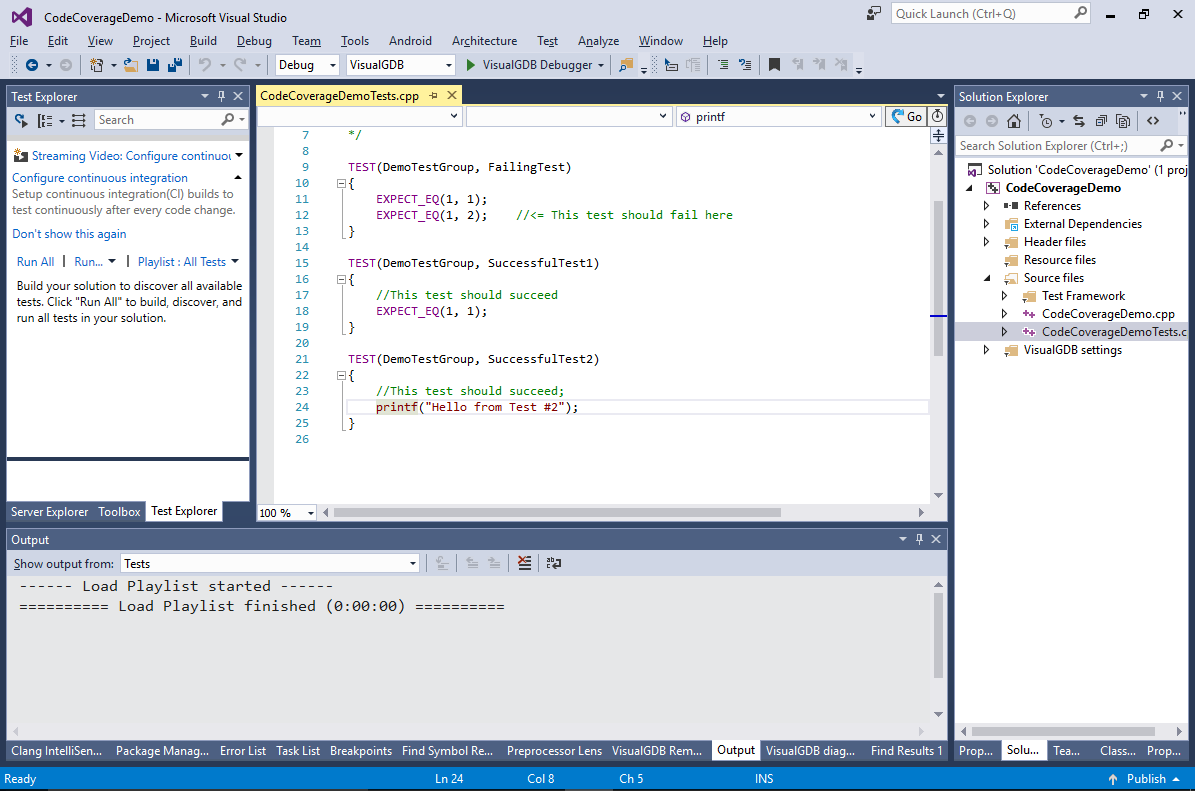
- VisualGDB will create a basic project including 3 unit tests based on the GoogleTest framework. Locate and open the <Project Name>Tests.cpp file that contains the generated tests:
- We will now create a very basic queue class capable of enqueuing and dequeuing elements one-by-one and will then add a unit test validating it. Replace the contents of the “tests” file with the following code:
#include <gtest/gtest.h>
#include <stdio.h>
#include <memory.h>

template <class _Element> class Queue
{
private:
    _Element *m_pData = nullptr;
    int m_ReadOffset = 0, m_WriteOffset = 0, m_Allocated = 0;

public:
    Queue(int reservedCount = 4)
    {
        if (reservedCount)
        {
            m_Allocated = reservedCount;
            m_pData = (_Element *)malloc(reservedCount * sizeof(_Element));
        }
    }

    ~Queue()
    {
        if (m_pData)
            free(m_pData);
    }

    int GetCount()
    {
        return m_WriteOffset - m_ReadOffset;
    }

    void Enqueue(const _Element *pElement)
    {
        if (GetCount() >= m_Allocated)
        {
            m_Allocated *= 2;
            m_pData = (_Element *)realloc(m_pData, m_Allocated * sizeof(_Element));
        }

        if (m_ReadOffset)
        {
            int base = m_ReadOffset;
            memmove(m_pData, m_pData + base, (m_Allocated - base) * sizeof(_Element));
            m_ReadOffset -= base;
            m_WriteOffset -= base;
        }

        m_pData[m_WriteOffset++] = *pElement;
    }

    bool Dequeue(_Element *pElement)
    {
        if (m_ReadOffset >= m_WriteOffset)
            return false;

        *pElement = m_pData[m_ReadOffset++];
        return true;
    }
};
Then add a basic test that will enqueue 3 elements and then dequeue them:
TEST(QueueTests, BasicTest)
{
    Queue<int> queue;
    for (int i = 0; i < 3; i++)
        queue.Enqueue(&i);

    for (int i = 0; i < 3; i++)
    {
        int tmp;
        ASSERT_TRUE(queue.Dequeue(&tmp));
        ASSERT_EQ(i, tmp);
    }
}
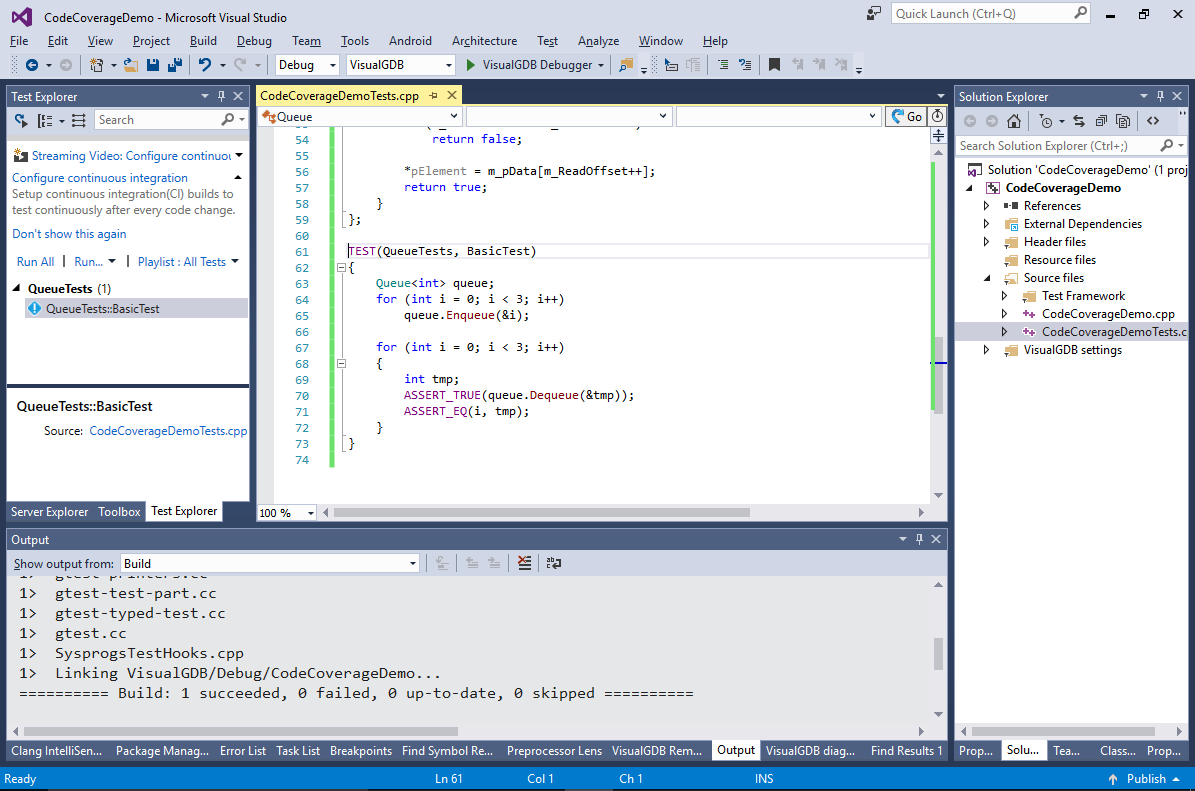
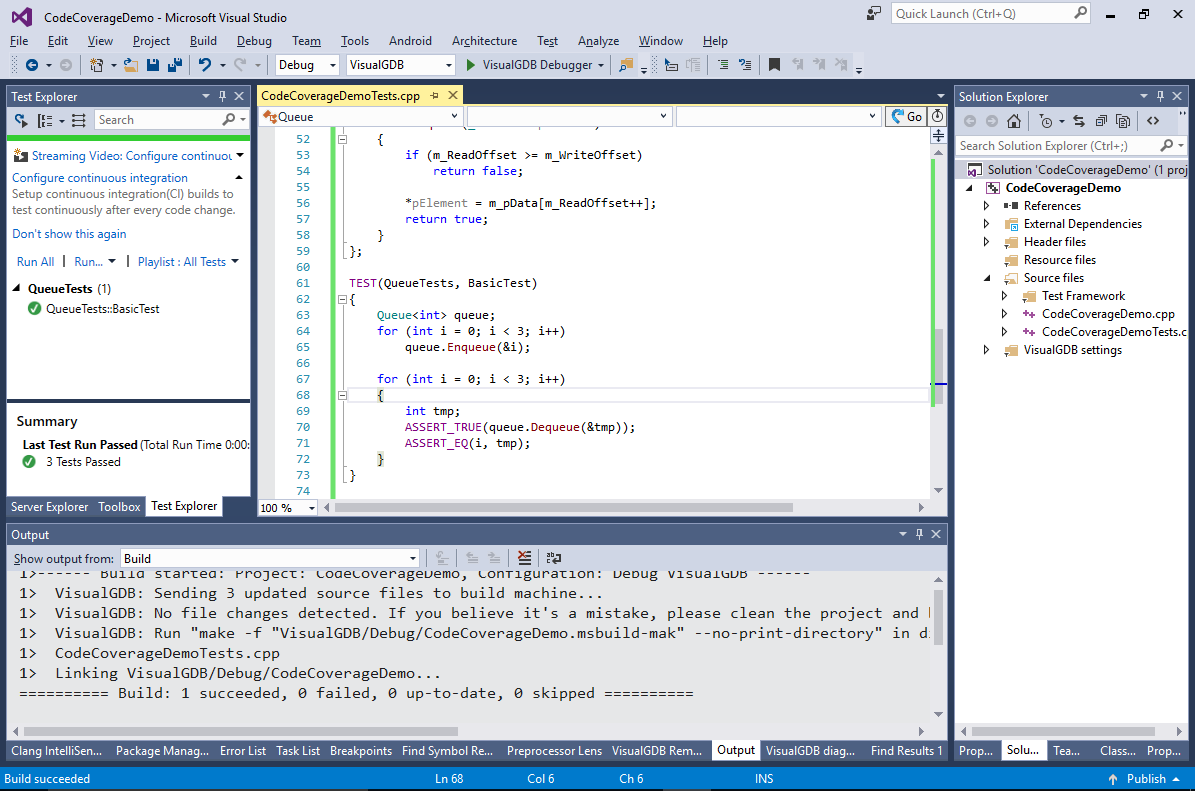
- Now you can use the Test Explorer window to run the test and verify that it succeeds:
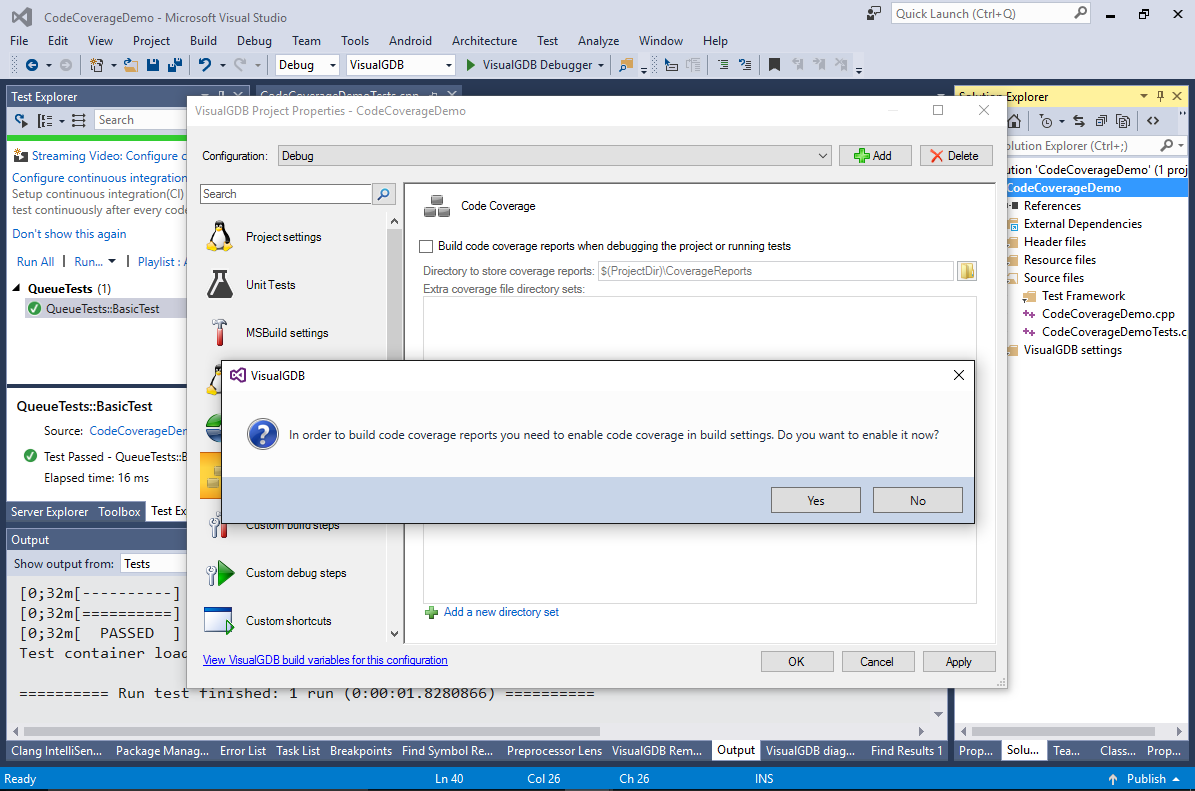
- The fact that the test succeeded means that the scenarios covered by the test work as expected, however it doesn’t indicate how much of the programs’ code was actually tested. Code coverage reports fill this gap by providing detailed statistics on functions, blocks and lines executed during the test run. Open VisualGDB Project Properties, go to the Code Coverage page and enable the “Build code coverage reports” checkbox. VisualGDB will suggest automatically enabling code coverage instrumentation:
- Instrumenting your program for code coverage will add significant run-time overhead, making your program slower than the non-instrumented version. You can then temporarily disable it via Visual Studio Project Properties -> Instrumentation -> Generate Code Coverage Reports (the option in VisualGDB Project Properties will stop VisualGDB from downloading and parsing the report files, but won’t disable the instrumentation):
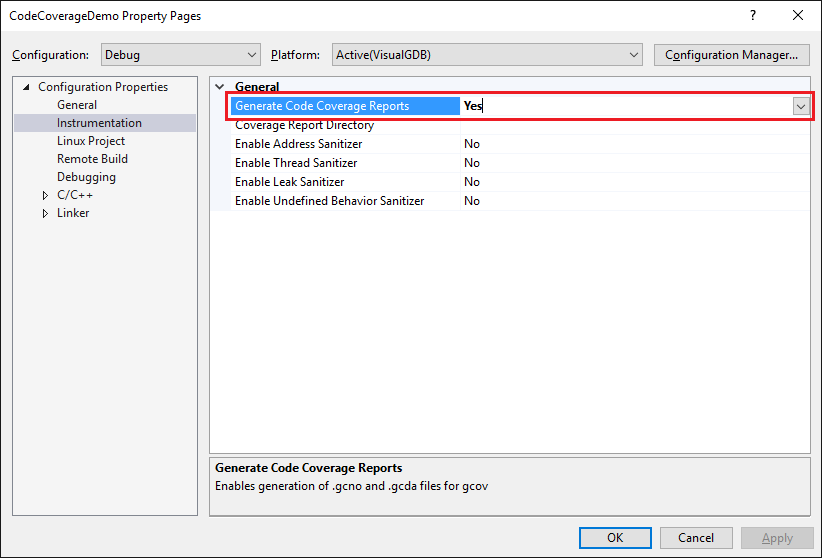 As the instrumentation settings are stored separately for each configuration, you can create a separate configuration via VisualGDB Project Properties and use it solely for checking code coverage so that your regular test performance won’t be affected.
 - It is also recommended to disable code coverage instrumentation for the files from the test framework itself. This will slightly improve the performance and remove unnecessary information from the coverage reports. You can do this by selecting those files in Solution Explorer, opening Visual Studio Properties and disabling report generation under Configuration Properties -> C/C++ -> Instrumentation:
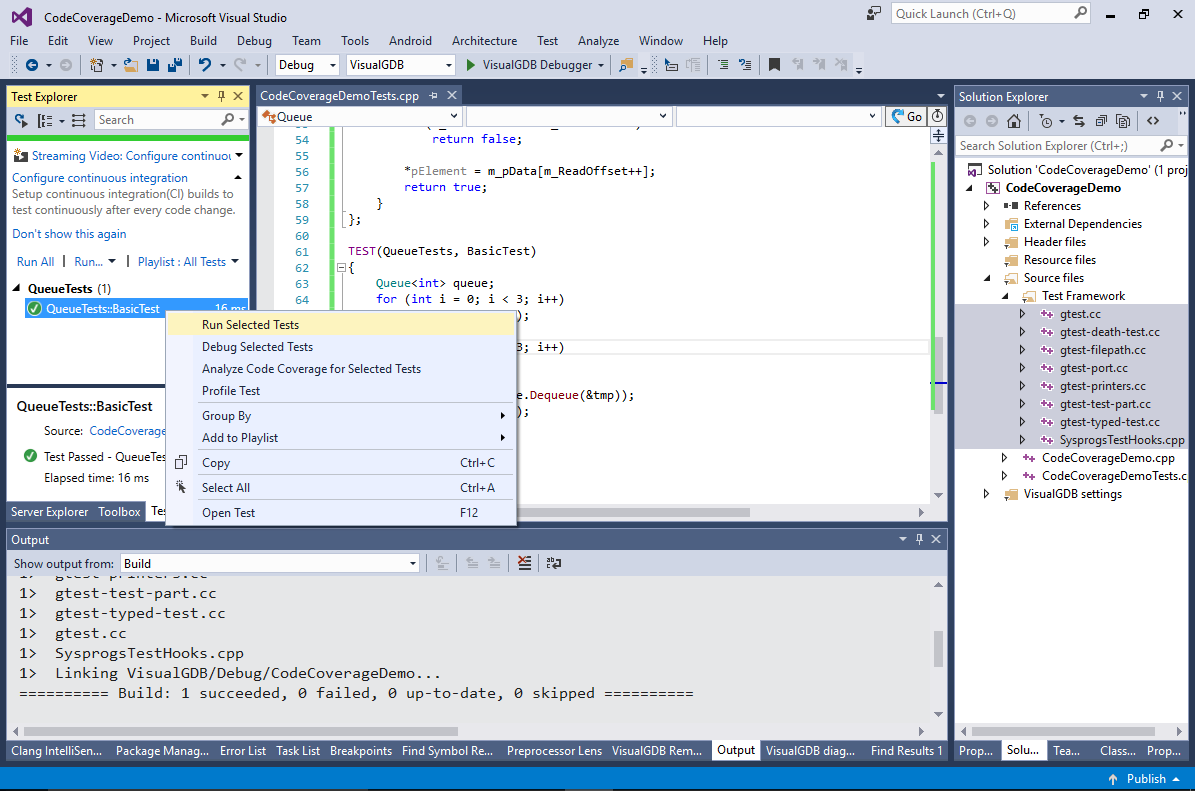
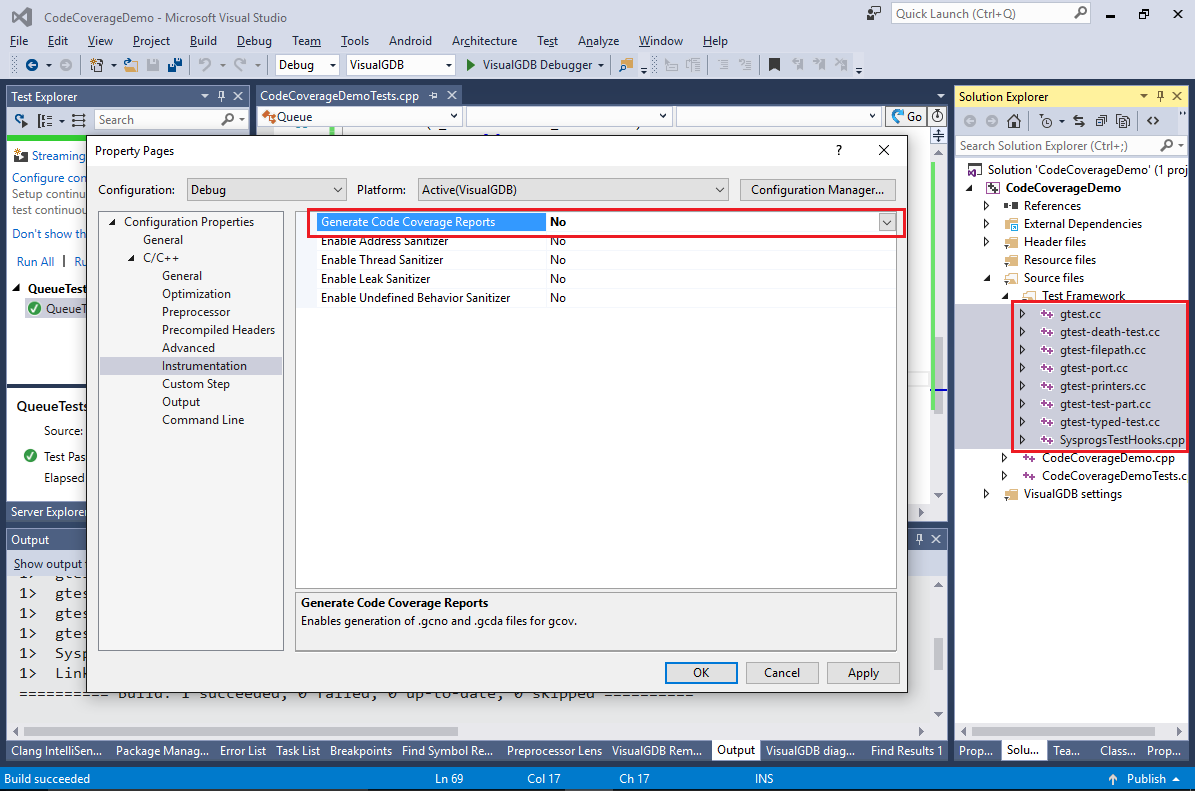 Note that the settings under the C/C++->Instrumentation only affect the compiler (but not the linker). If you are editing global project settings manually, use the Configuration Properties->Instrumentation page instead:
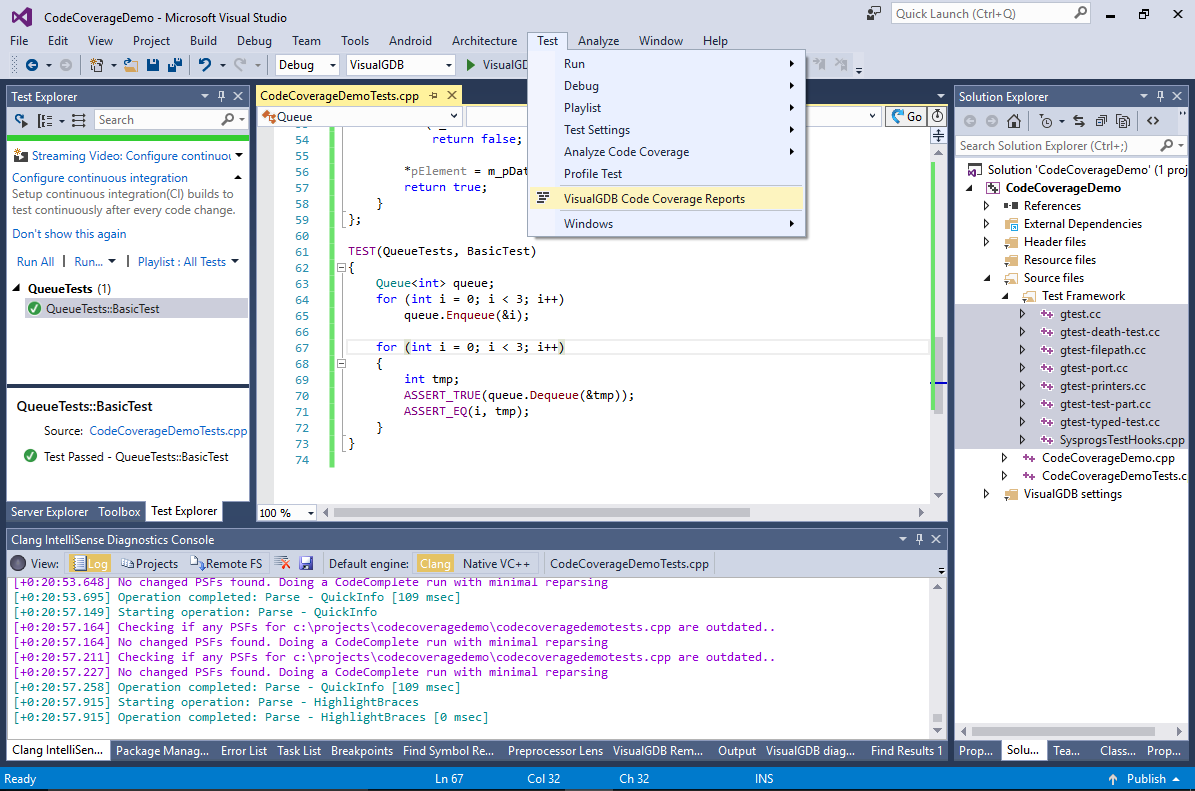
- Run the test again. When it is completed, open the coverage report viewer via Test->VisualGDB Code Coverage Reports:
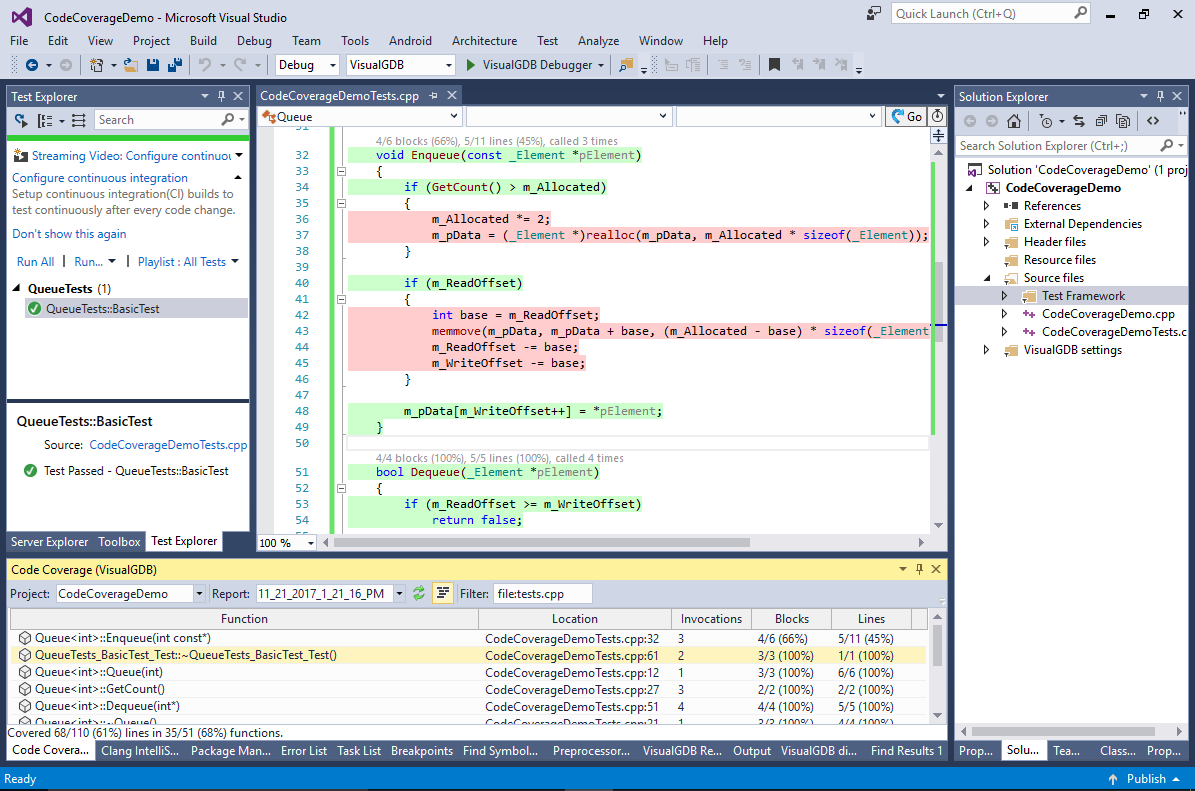
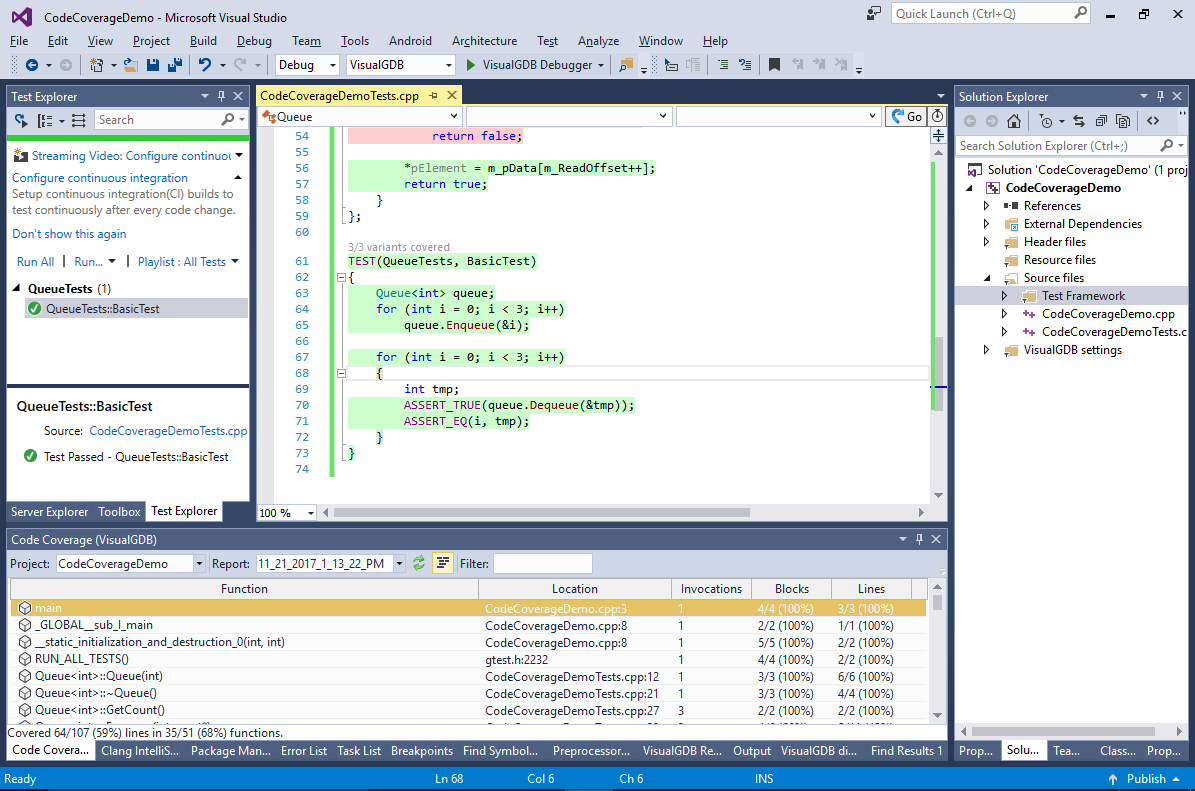
- VisualGDB will display the list of functions along with their invocation count and coverage statistics. It will also highlight the covered lines directly in the source code:
- Click on the “lines” column to sort the functions by the fraction of covered lines, then enter “file:tests.cpp” in the “filter” field to limit the displayed functions to your main source file:
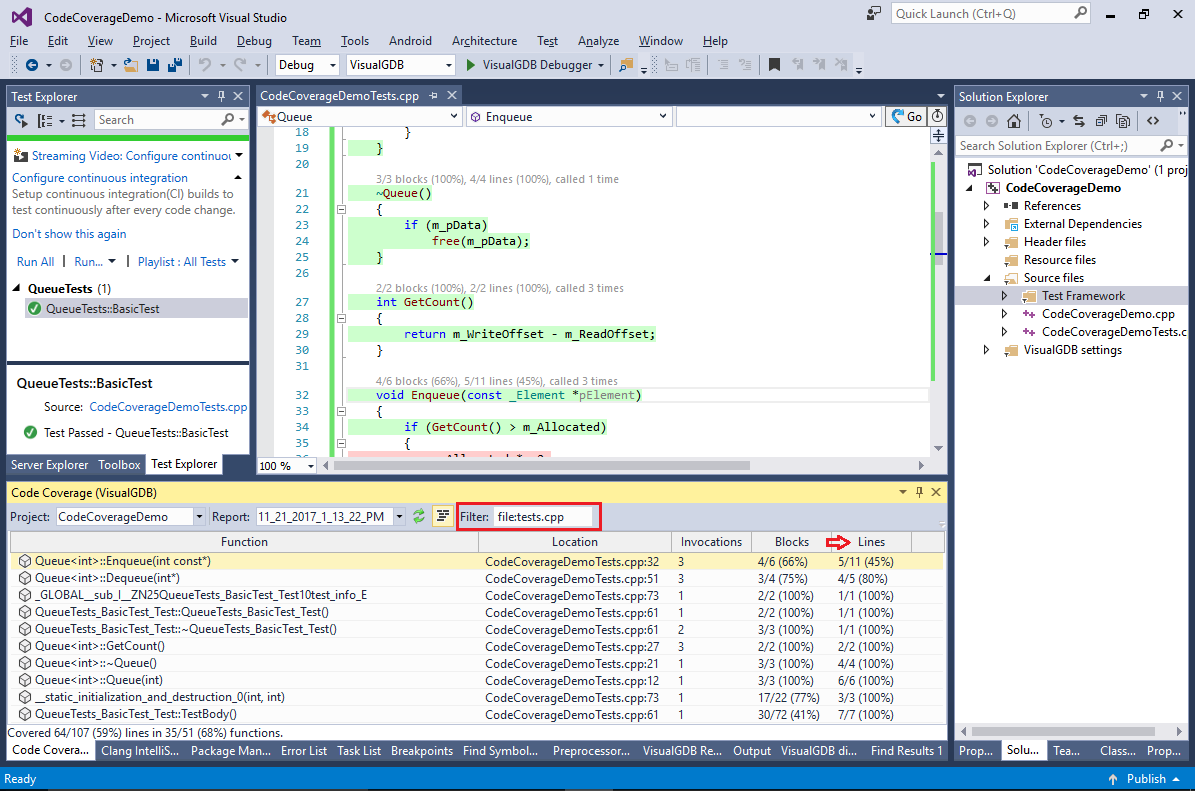 You can hover the mouse over the ‘filter’ field to view help on supported filter expressions.
 - The report will show that the Queue<int>::Enqueue() method has only 45% line. Double-click on it to navigate to its definition in the code:
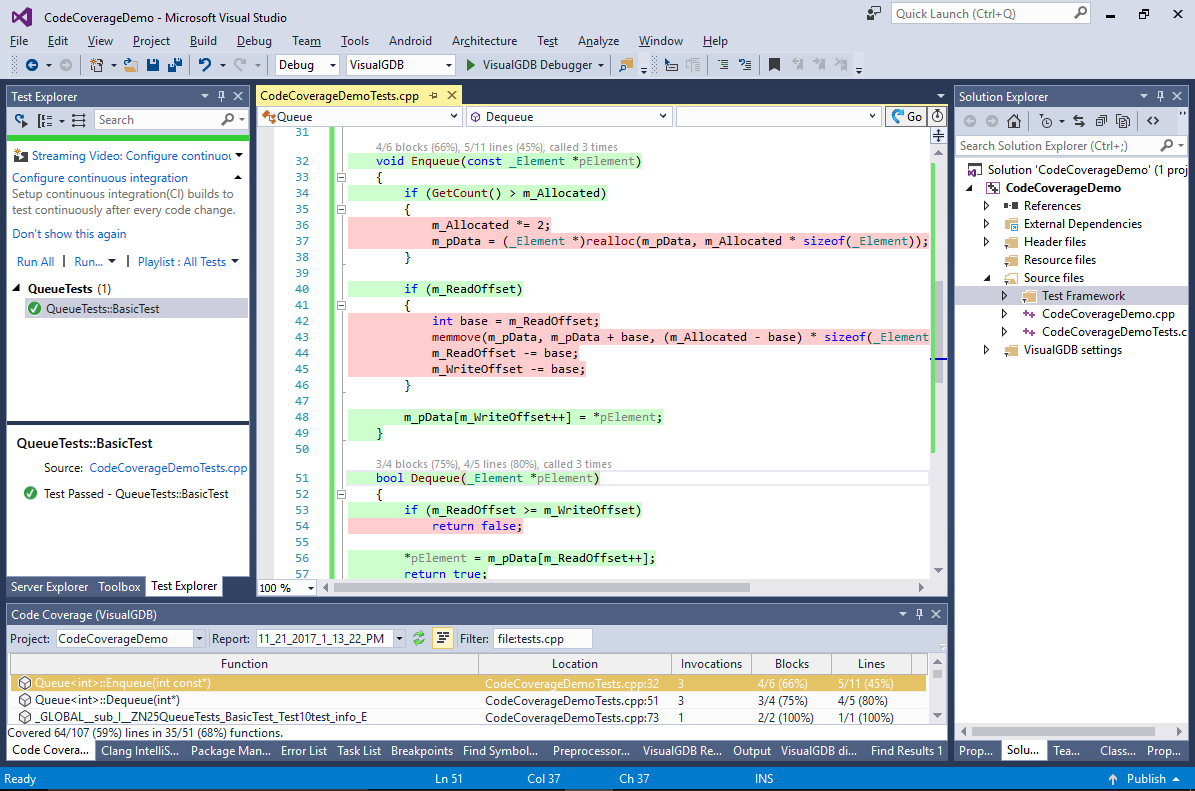 The coverage report quickly shows that the following branches are not covered:
- The branch checking whether the queue is empty before dequeuing
- The branch checking whether enough memory is allocated before enqueuing more elements
- The branch moving the enqueued elements to the beginning of the buffer before adding more (the current implementation is not optimal, but clearly demonstrates 2 different conditions)
- The easiest branch to cover is the empty queue check. Adjust the test method as follows, build the project and re-run the test:
TEST(QueueTests, BasicTest)
{
    Queue<int> queue;
    for (int i = 0; i < 3; i++)
        queue.Enqueue(&i);

    for (int i = 0; i < 4; i++)
    {
        int tmp;
        bool done = queue.Dequeue(&tmp);
        if (i == 3)
        {
            ASSERT_FALSE(done);
        }
        else
        {
            ASSERT_TRUE(done);
            ASSERT_EQ(i, tmp);
        }
    }
}
- Covering both reallocation and moving requires interleaving enqueuing and dequeuing operations and increasing the batch sizes. To do this, replace the test code with the following:
void EnqueueConsecutive(Queue<int> &queue, int first, int count)
{
    for (int i = 0; i < count; i++)
    {
        int tmp = i + first;
        queue.Enqueue(&tmp);
    }
}

void DequeueConsecutive(Queue<int> &queue, int first, int count)
{
    for (int i = 0; i < count; i++)
    {
        int tmp;
        ASSERT_TRUE(queue.Dequeue(&tmp));
        ASSERT_EQ(i + first, tmp);
    }
}

void CheckEndOfQueue(Queue<int> &queue)
{
    int tmp;
    ASSERT_FALSE(queue.Dequeue(&tmp));
}

TEST(QueueTests, BasicTest)
{
    Queue<int> queue;
    EnqueueConsecutive(queue, 0, 3);
    DequeueConsecutive(queue, 0, 3);
    CheckEndOfQueue(queue);
}
Then build and run the tests to ensure that all the code is now covered:
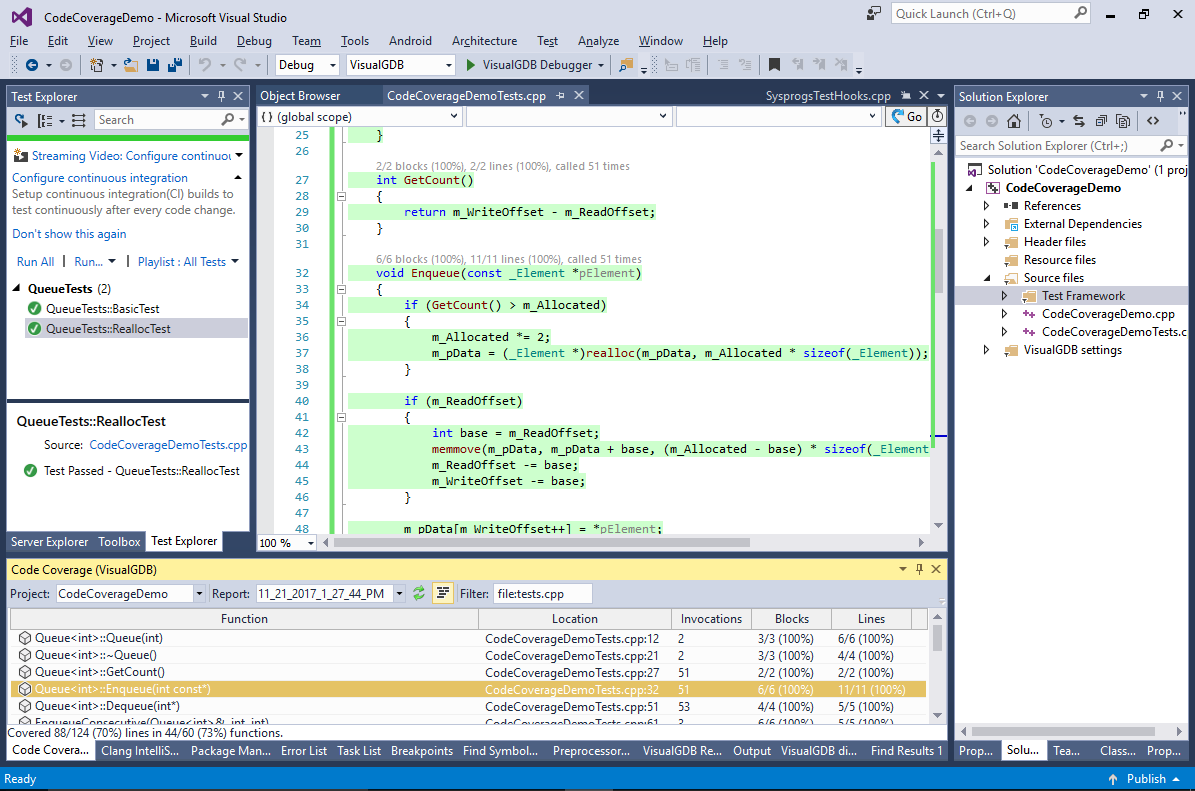 Note that the test coverage reports always show the coverage for the tests scheduled during a test run. I.e. if you only run 1 test out of 2, the functions checked by the second tests will be shown as not covered.
 - Now we will show how VisualGDB manages the coverage reports internally. Open the project folder in Windows Explorer and go to the CoverageReports subdirectory:
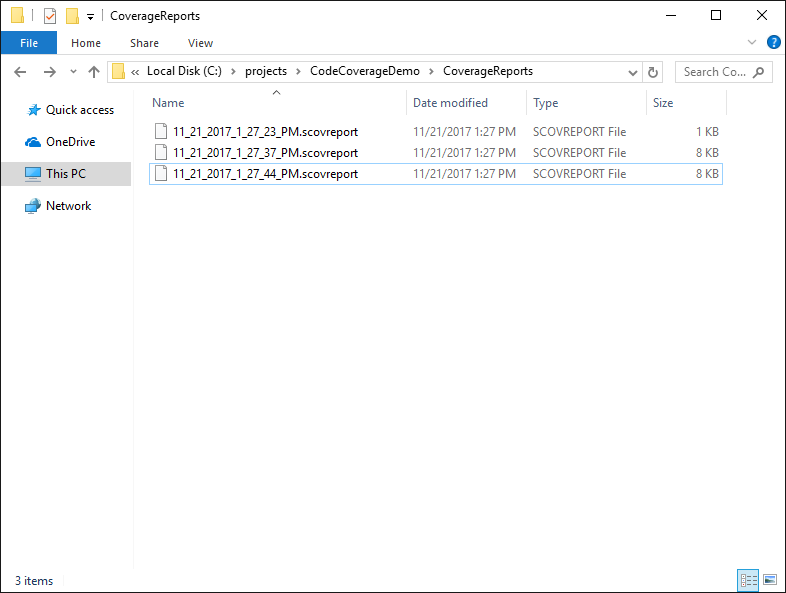 Each .scovreport file corresponds to one coverage report from one test run.
 - You can delete the old report files either manually, or in the Coverage Report viewer. VisualGDB will also automatically remove the old report files when their amount exceeds the limit specified via global settings:
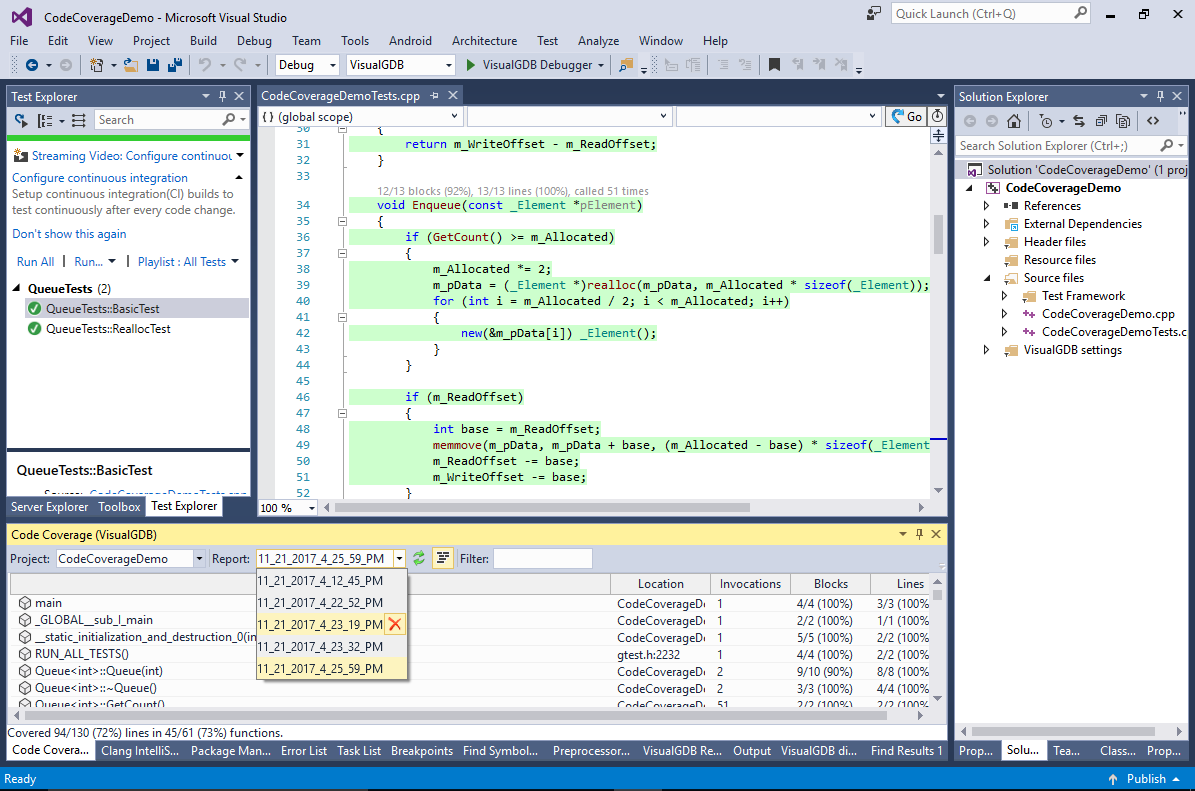
- If the coverage reports appear inconsistent, open VisualGDB settings (from Tools->Options) and enable the “Keep raw coverage reports” setting:
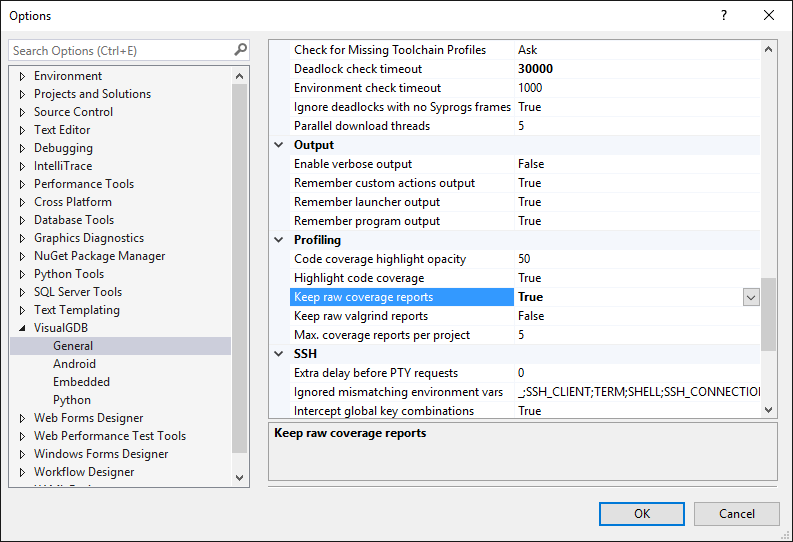
- VisualGDB will then keep the original gcov report files downloaded for each session:
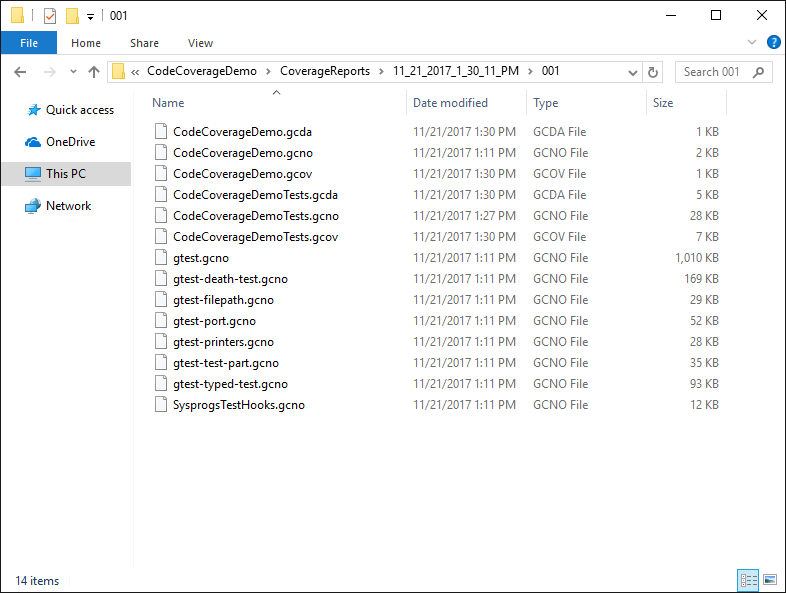
- You can check the consistency of the reports by looking at the job.txt and the .gcov files referenced from it:
 The job.txt file contains lines starting with “>” that specify the base source directories followed by paths of .gcov files listing line and function coverage (VisualGDB automatically runs the gcov tool to generate .gcov files from .gcda and .gcno files). If the .gcov files appear inconsistent, check that you are using a recent version of the compiler.
 - Finally we will show how to use the code coverage to quickly spot inconsistencies in the program behavior. We will add a very basic smart pointer class and try to use it with our custom queue:
class SmartPointer
{
private:
    char *m_Pointer;

public:
    SmartPointer()
    {
        m_Pointer = nullptr;
    }

    SmartPointer(const SmartPointer &right)
    {
        if (right.m_Pointer)
            m_Pointer = strdup(right.m_Pointer);
        else
            m_Pointer = nullptr;
    }

    void operator=(const SmartPointer &right)
    {
        if (m_Pointer)
            free(m_Pointer);
        if (right.m_Pointer)
            m_Pointer = strdup(right.m_Pointer);
        else
            m_Pointer = nullptr;
    }

    ~SmartPointer()
    {
        if (m_Pointer)
            free(m_Pointer);
    }
};

TEST(QueueTests, SmartPointerTest)
{
    Queue<SmartPointer> queue;
    SmartPointer sp;
    for (int i = 0; i < 10; i++)
        queue.Enqueue(&sp);
}
If you run the test now, VisualGDB will trigger an “invalid memory access” error in the assignment operator:
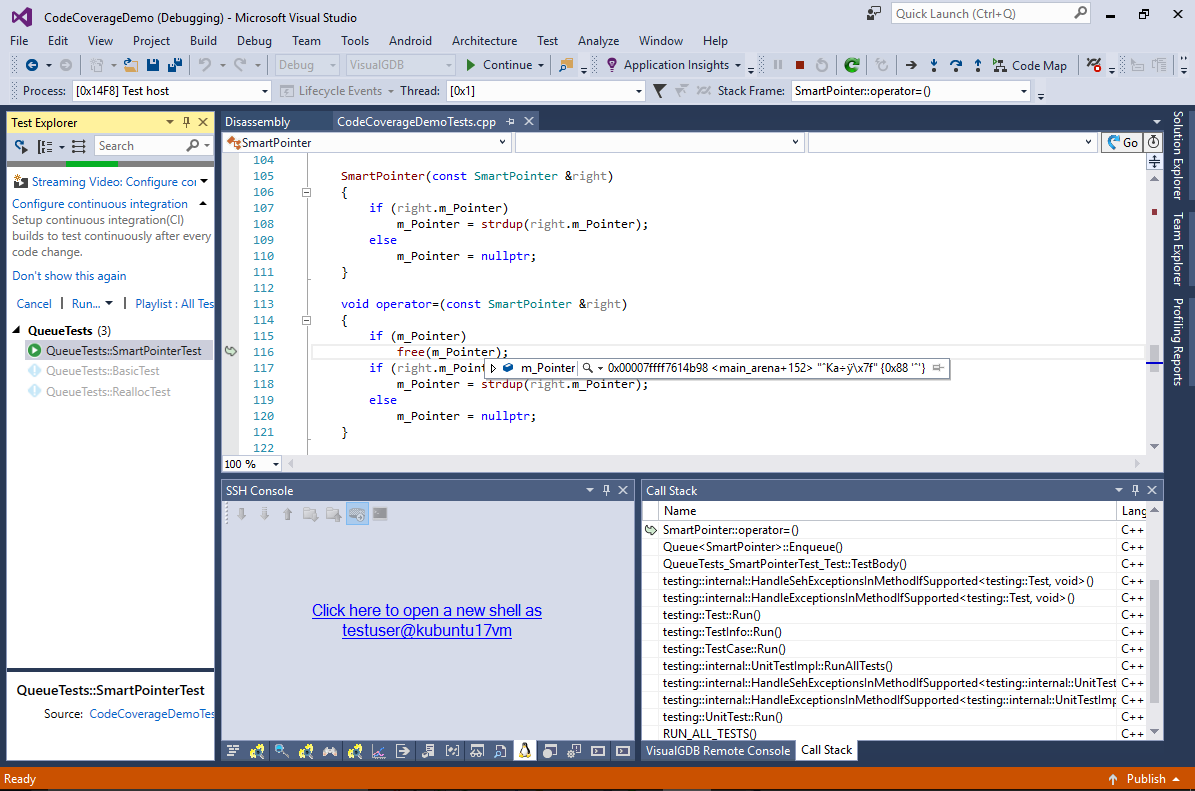
- Try commenting it out and run the test again. Note how the code coverage shows 10 invocations of the operator=(), but only one invocation of the constructor:
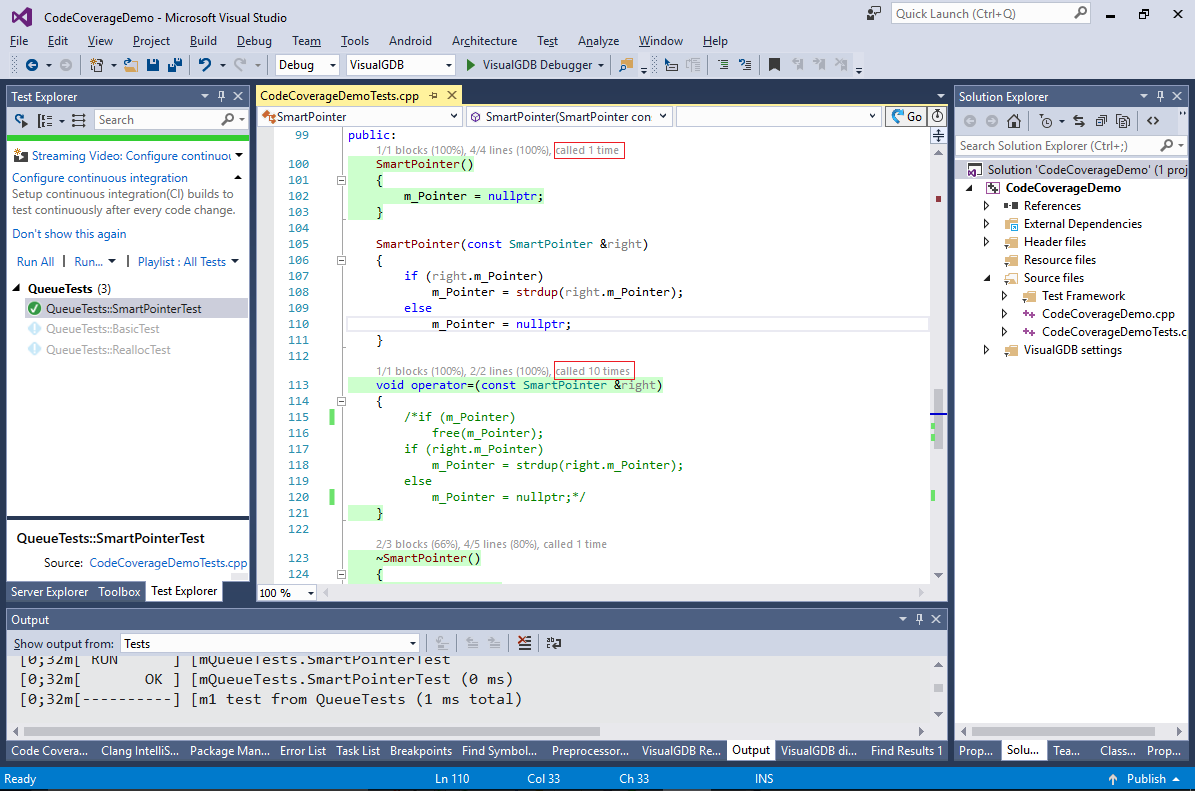
- As a result, operator=() is trying to free a pointer that was never initialized and contains garbage. You can address this by modifying the Queue() constructor to call the placement new each time it allocated an object, acting similarly to the new[] operator:
    Queue(int reservedCount = 4)
    {
        if (reservedCount)
        {
            m_Allocated = reservedCount;
            m_pData = (_Element *)malloc(reservedCount * sizeof(_Element));
            for (int i = 0; i < reservedCount; i++)
                new(&m_pData[i]) _Element();
        }
    }
The reallocation logic should also contain a call to placement new for each allocated object:
        if (GetCount() >= m_Allocated)
        {
            m_Allocated *= 2;
            m_pData = (_Element *)realloc(m_pData, m_Allocated * sizeof(_Element));
            for (int i = m_Allocated / 2; i < m_Allocated; i++)
                new(&m_pData[i]) _Element();
        }
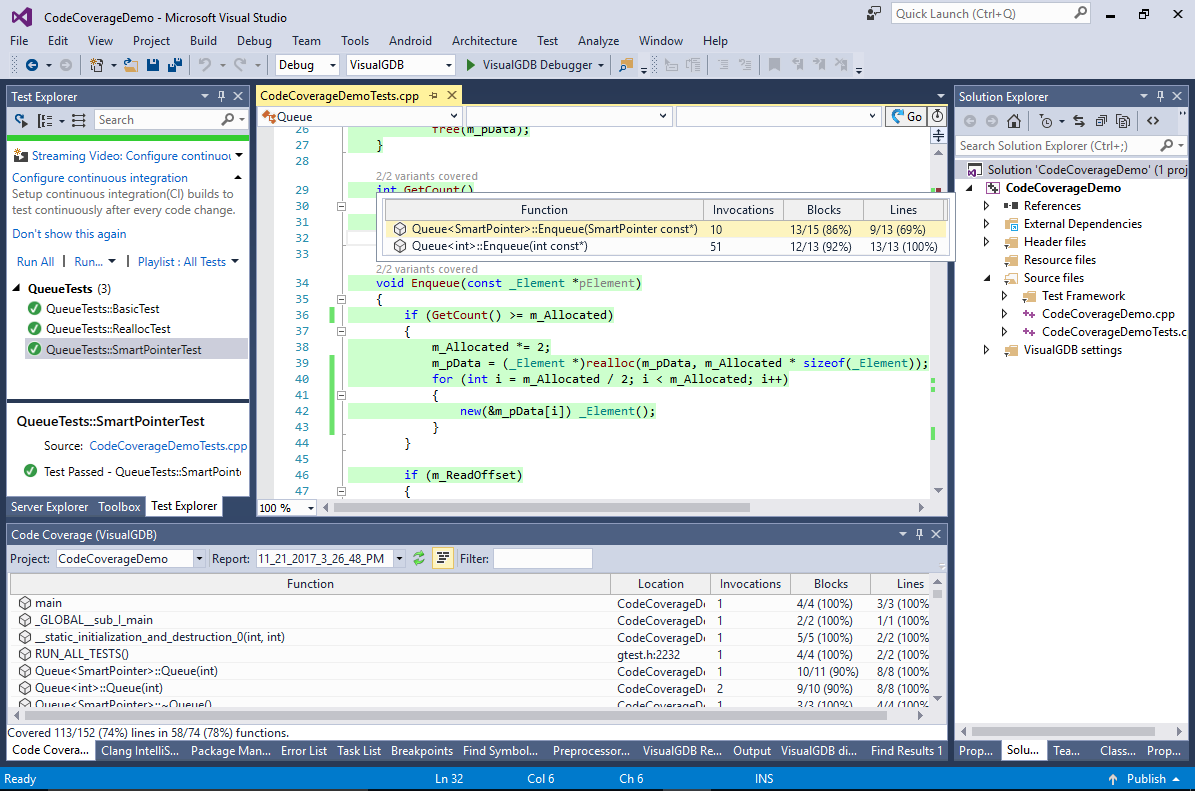
- Build and run the project now to see that the tests pass. Note that now the Enqueue() method declaration corresponds to 2 physical methods: Queue<int>::Enqueue() and Queue<SmartPointer>::Enqueue(). VisualGDB can distinguish between them and will show you the detailed statistics once you click on the “2/2 variants covered” link above the method declaration:
You can find the source code for the program shown in this tutorial in our Github repository.

