Speeding Up Raspberry Pi Debugging by Running GDB Locally
This tutorial shows how to improve debugging performance for projects built directly on your Raspberry Pi by running the gdb debugger on the Windows machine. We will start with creating a regular remotely built project and will show how to modify it to run gdb locally, explaining why this results in a performance boost. Before you begin, install VisualGDB 5.3 or later.
- Start Visual Studio and open the VisualGDB Linux Project Wizard:
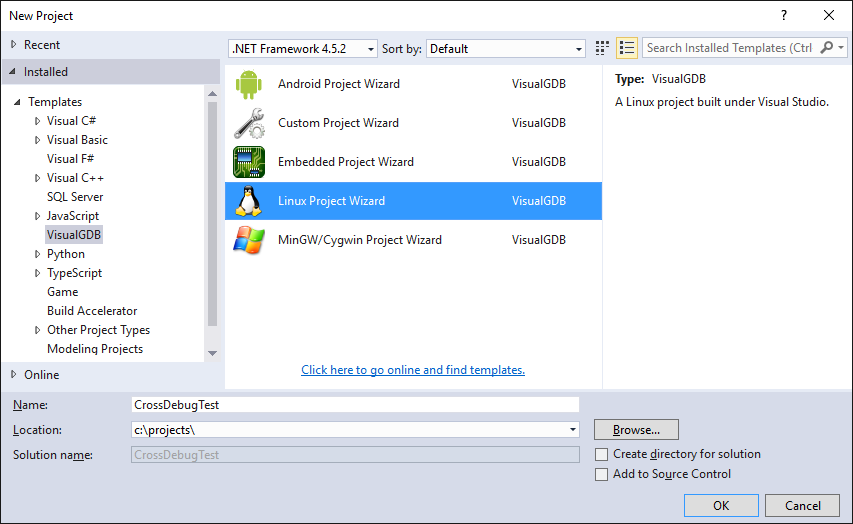
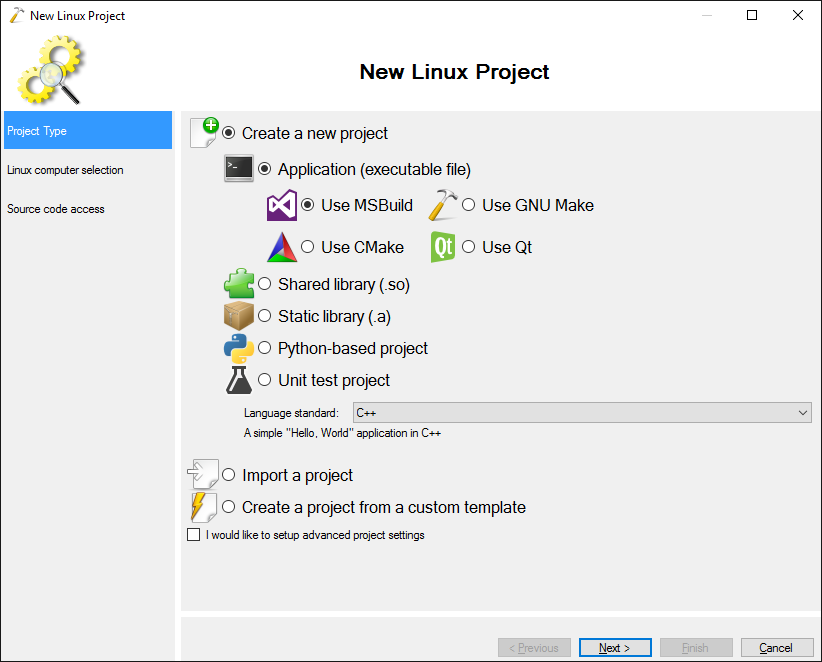
- Select “Create a new project -> Application -> MSBuild”. Note that the techniques shown in this tutorial will also work for other project types:
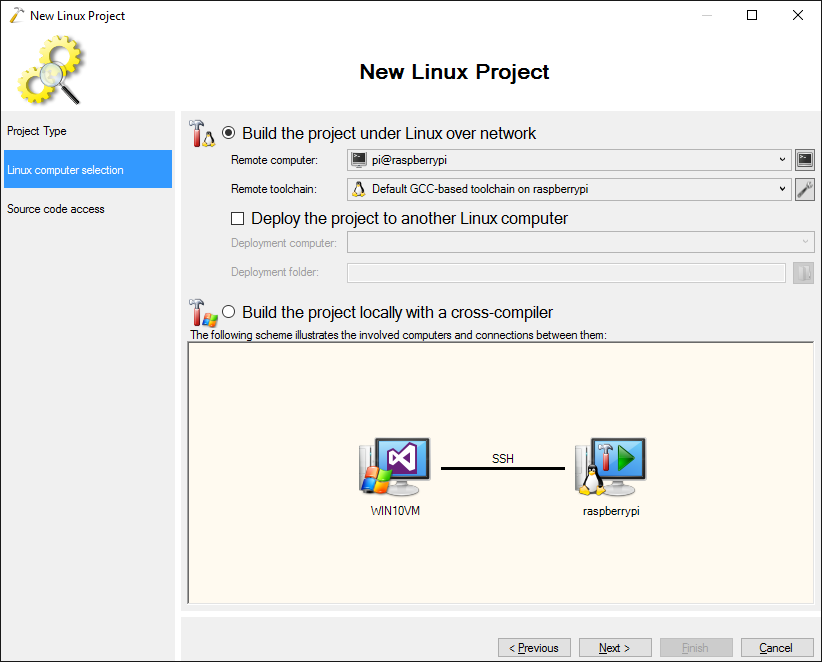
- Select “Build the project under Linux over network” and select your Raspberry Pi as the remote computer:
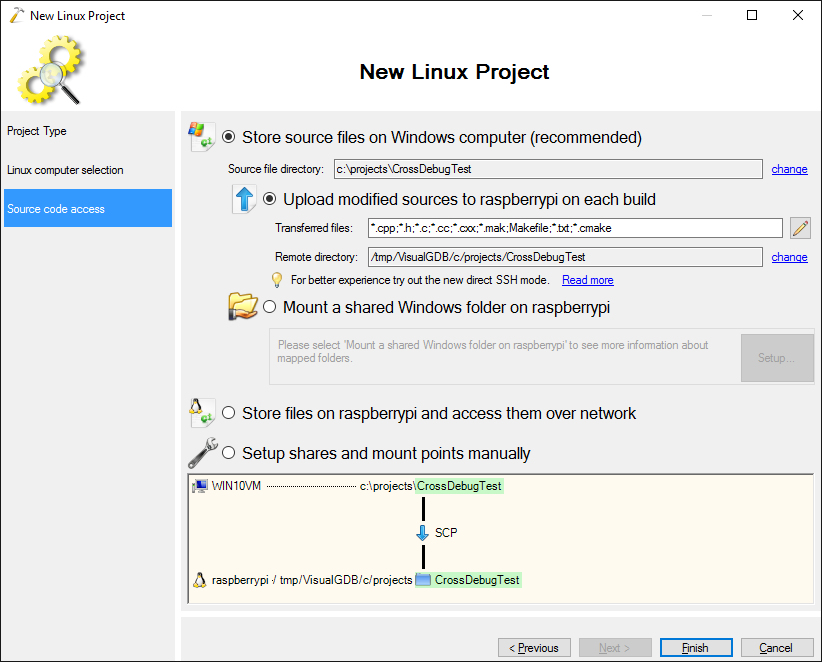
- Proceed with the default source location settings (store locally, upload during build):
- Press “Finish” to generate a basic project:
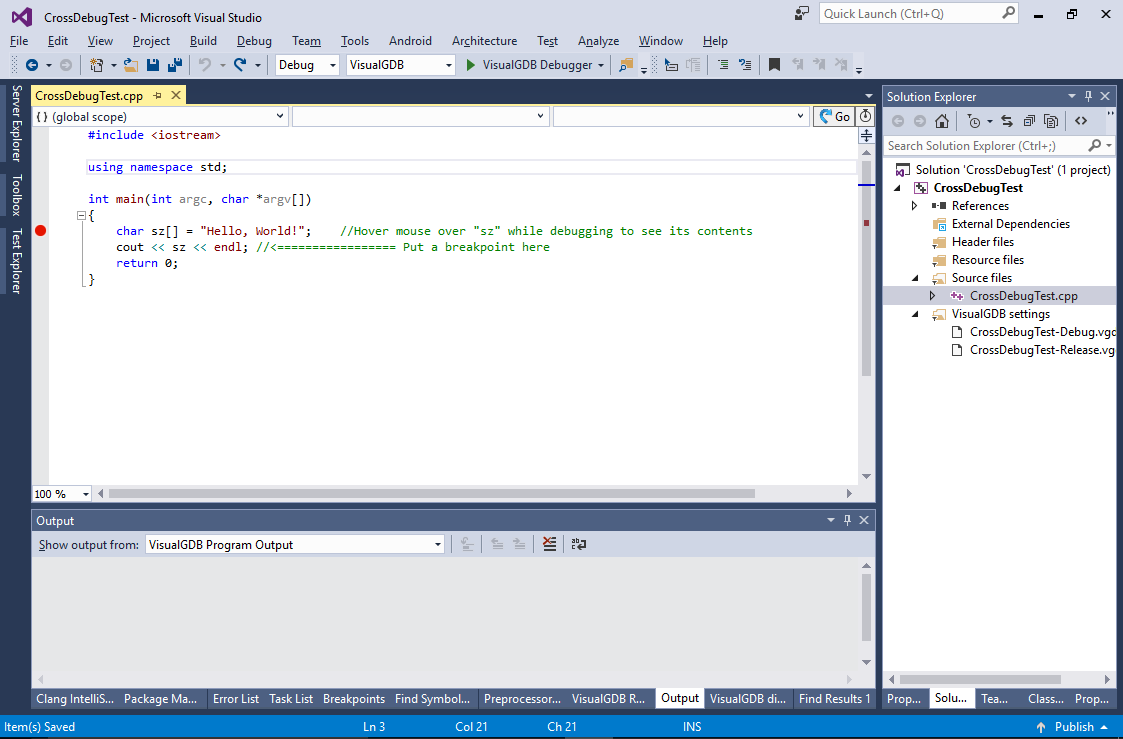
- Replace the contents of the main source file with the following code:
#include <iostream>
#include <list>
#include <string>

using namespace std;

int main(int argc, char *argv[])
{
    std::list<std::string> list;
    for (int i = 0; i < 10; i++)
        list.push_back("test");

    char sz[] = "Hello, World!";    //Hover mouse over "sz" while debugging to see its contents
    cout << sz << endl;    //<================= Put a breakpoint here
    return 0;
}
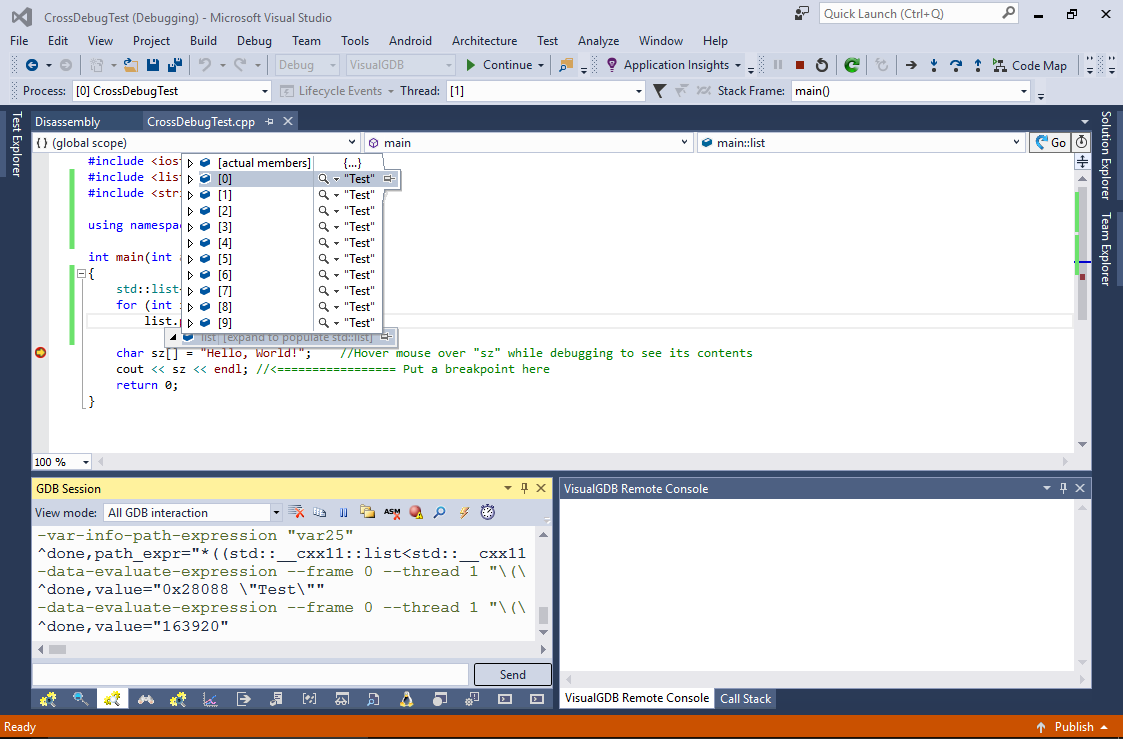
- Evaluating a list of STL strings involves non-trivial computations on the gdb side, so doing them on the Raspberry Pi would cause noticeable delays. Step into the main() function and hover the mouse over list to see the values:
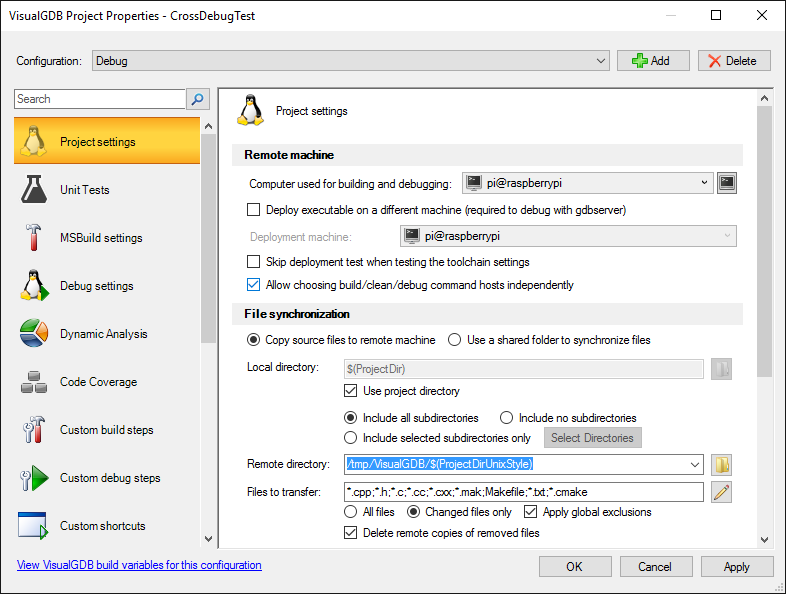
- Now we will change the project setup to run gdb on Windows so all the expression parsing and symbol handling is done on your development machine. Open VisualGDB Project Properties and set the “Allow choosing build/clean/debug command hosts independently” checkbox (requires Custom edition or higher):
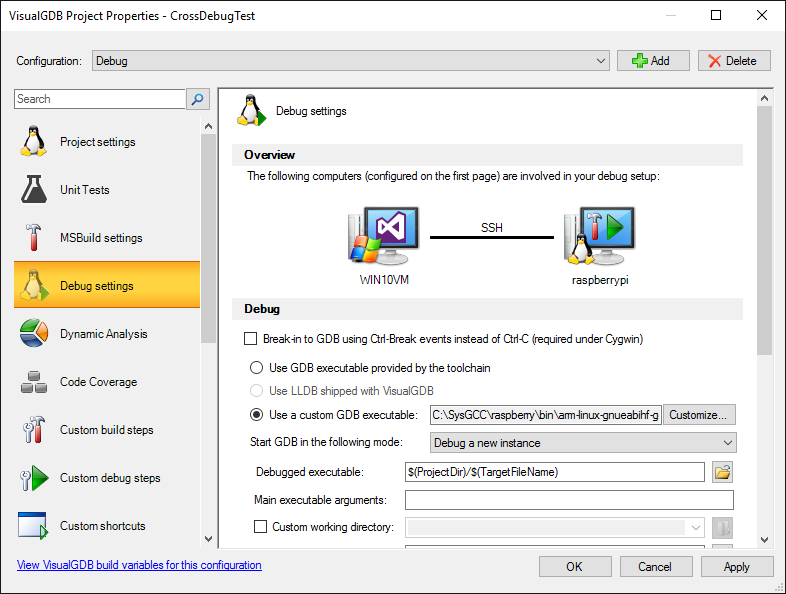
- Go to the Debug Settings page, select “ust a custom GDB executable” and click “Customize”:
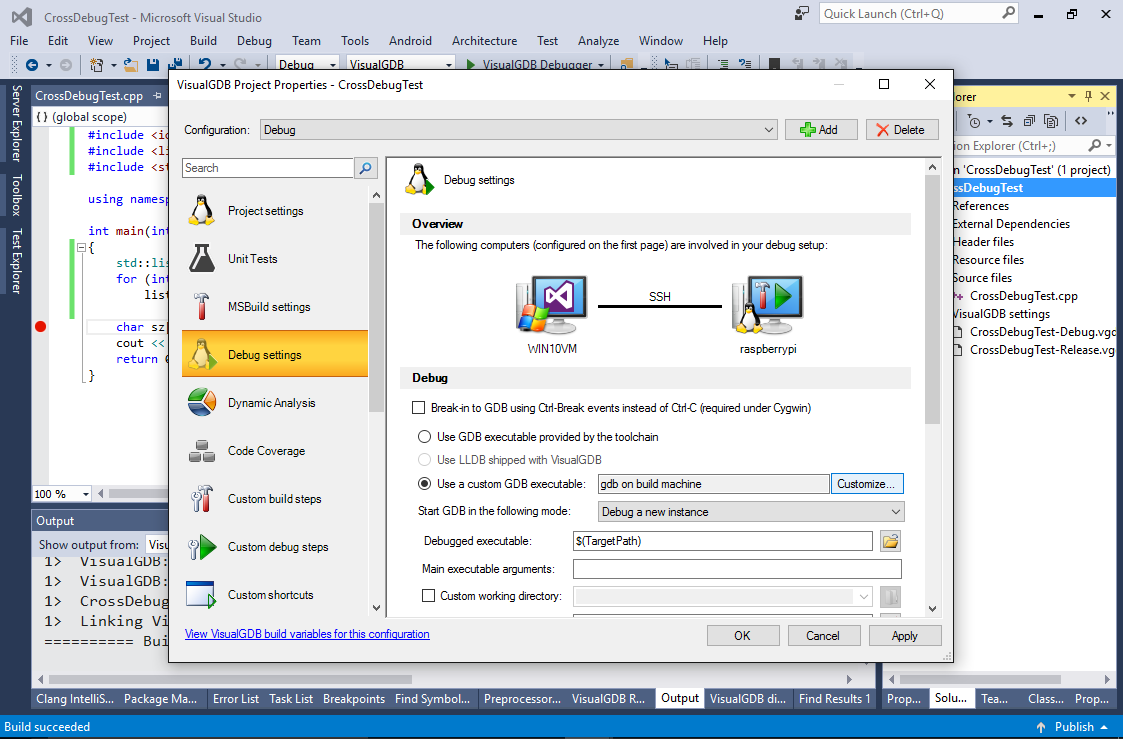
- Ensure you have a Raspberry Pi toolchain compatible with the target image installed. Then select “Computer containing GDB: (local computer)” and locate the gdb executable:

- As the executable is built on the Raspberry Pi, we would need to download it to the Windows machine and configure gdb to use it. Enter “$(ProjectDir)/$(TargetFileName)” in the “Debugged executable” field:
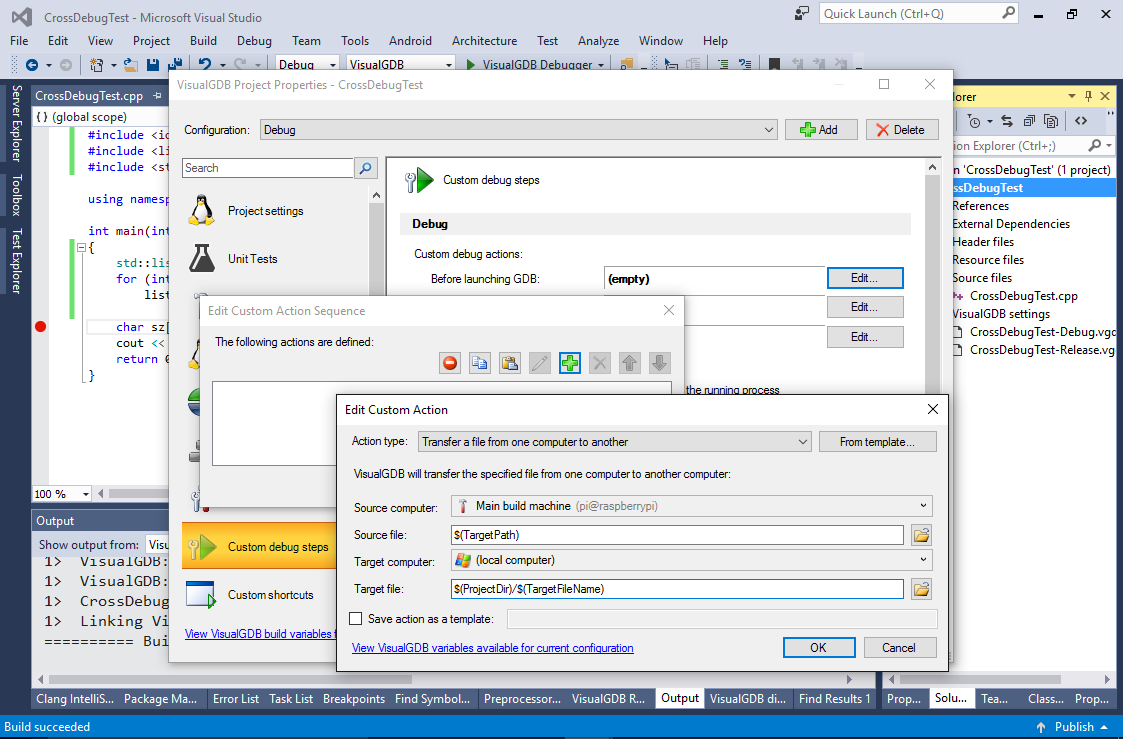
- Now we will configure VisualGDB to download the executable before debugging. Go to the Custom Debug Steps page, click “Before launching GDB -> Edit” and add a custom action to download $(TargetPath) to $(ProjectDir)/$(TargetFileName):
- Start debugging again. VisualGDB will automatically launch gdbserver on the remote machine and connect gdb to it:
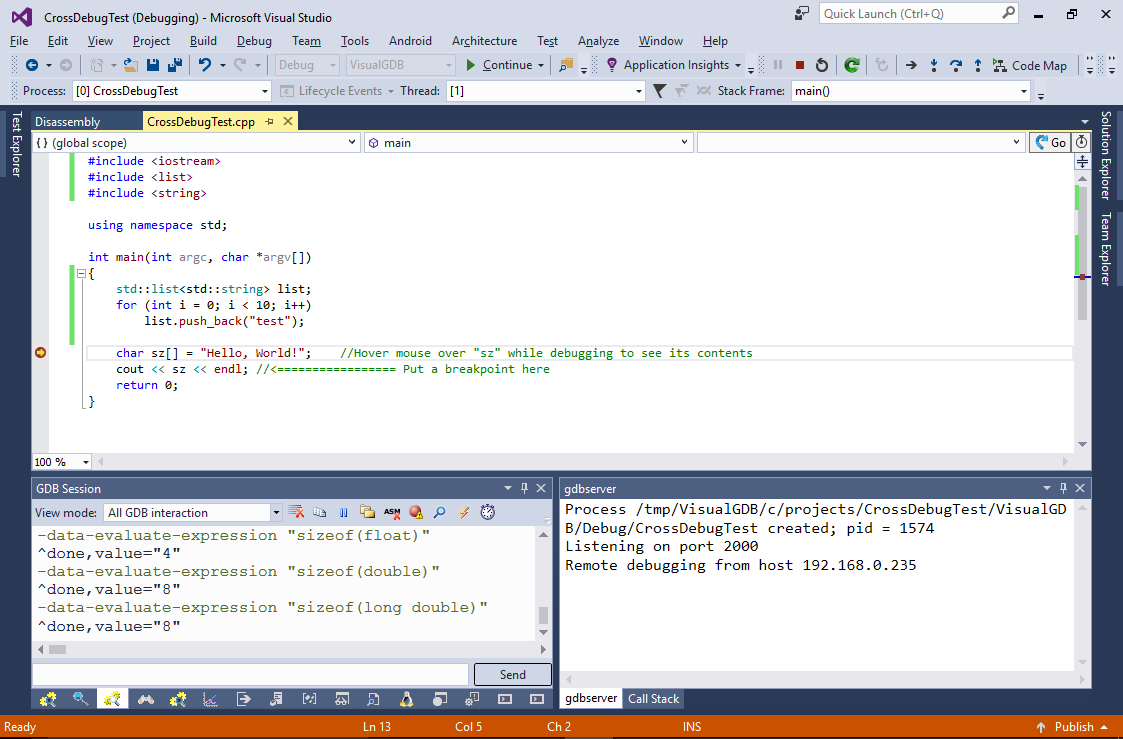
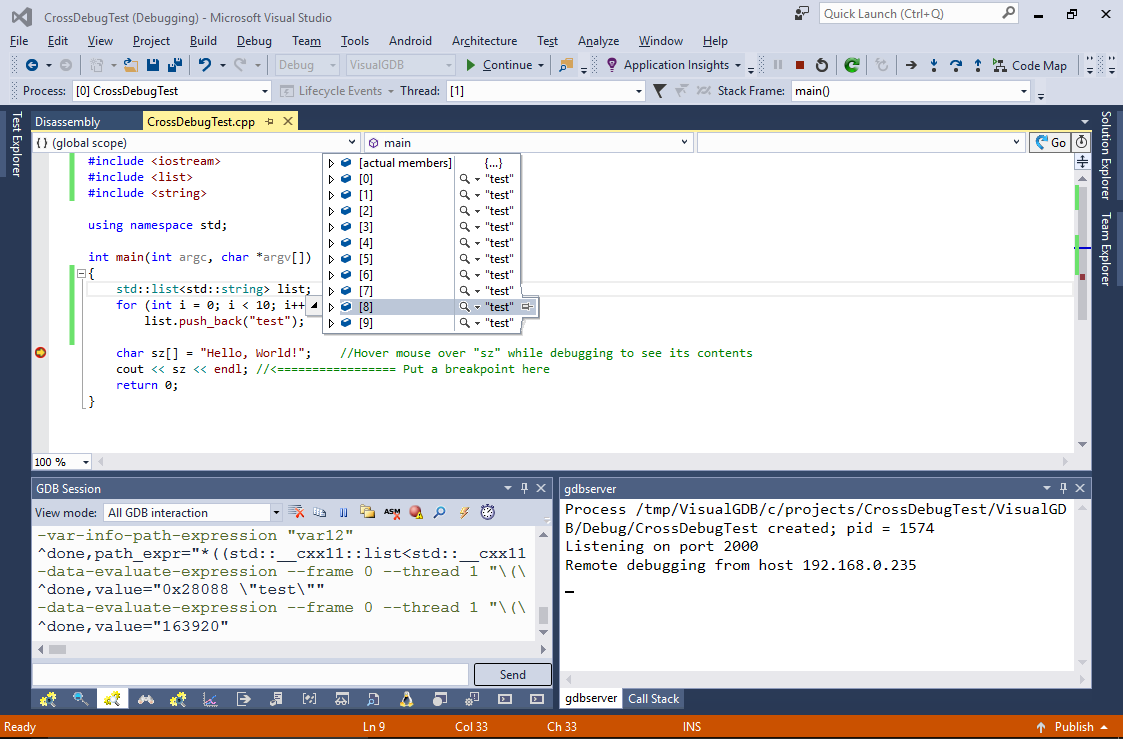
- Observe how evaluating the complex expressions is now faster because most of the computations are done on the Windows computer:
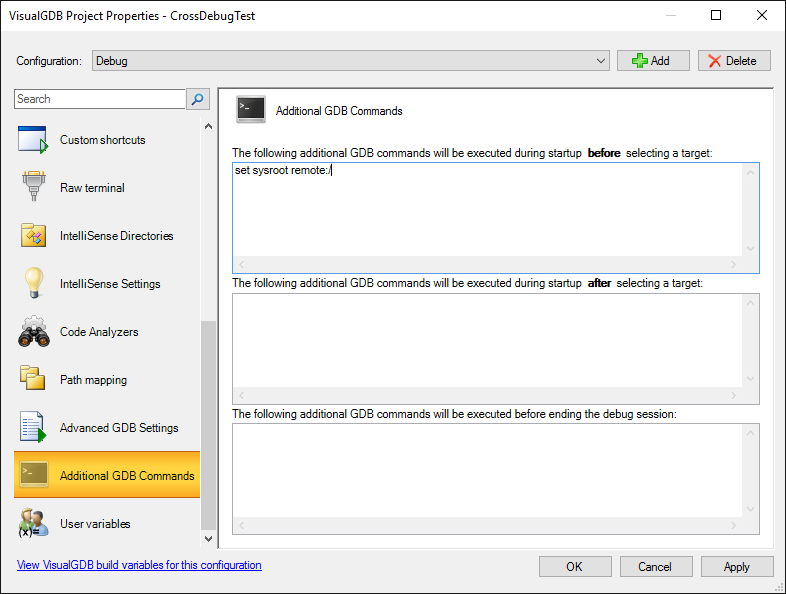
- If you are running gdb locally, you need to keep up-to-date local copies of your Raspberry Pi libraries so that gdb can load symbols from them. Alternatively you can configure it to automatically fetch the libraries from the remote machine by adding “set sysroot remote:/” to the startup command list:
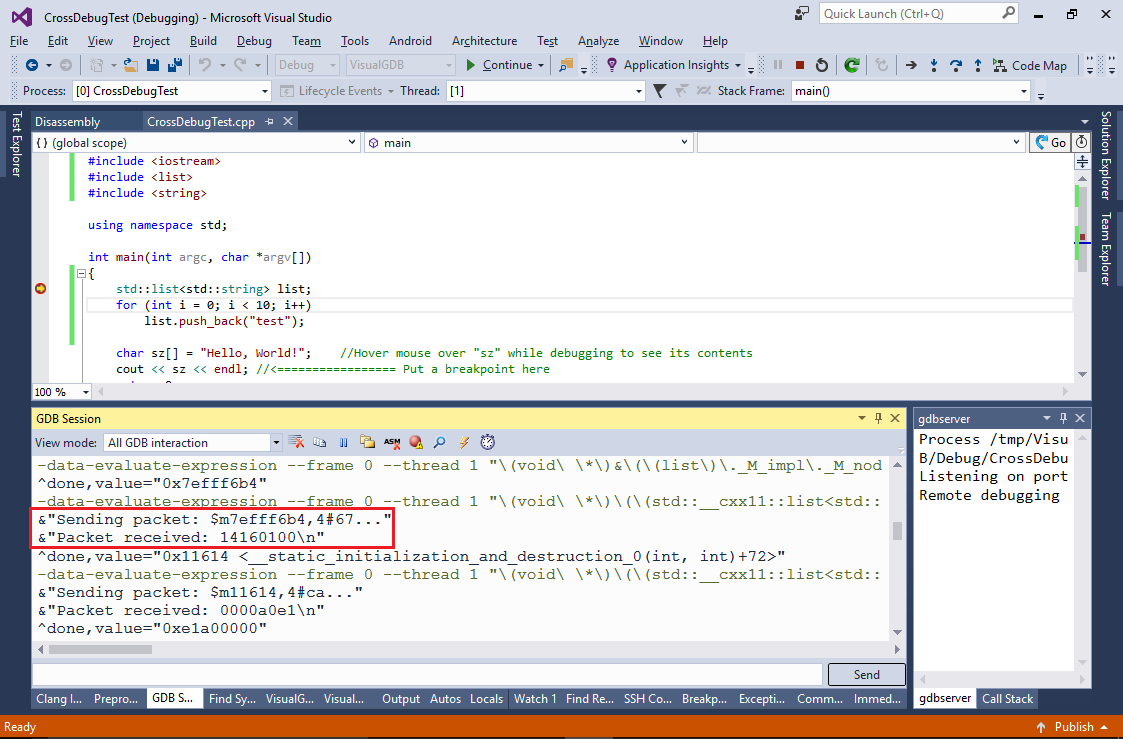
- You can get a quick idea about the simplification done by gdb on the Windows side by running the “set debug remote 1” command in the GDB Session window and then observing the packets sent by GDB to gdbserver. See how gdb translates complex expressions to simple commands like “read 4 bytes at address XXX” that are then quickly handled by gdbserver running on your Raspberry Pi: