Using Embedded Profiler on Platforms with no Cycle Counter
This tutorial shows how to use the VisualGDB Instrumenting Profiler and Real-time Watch on devices that do not support debug instruction count registers. We will create a basic project for the STM32F7Discovery board, try to measure function run time using the default real-time watch configuration and show how to fix the problems that will arise.
Before you begin, install VisualGDB 5.2R8 or later.
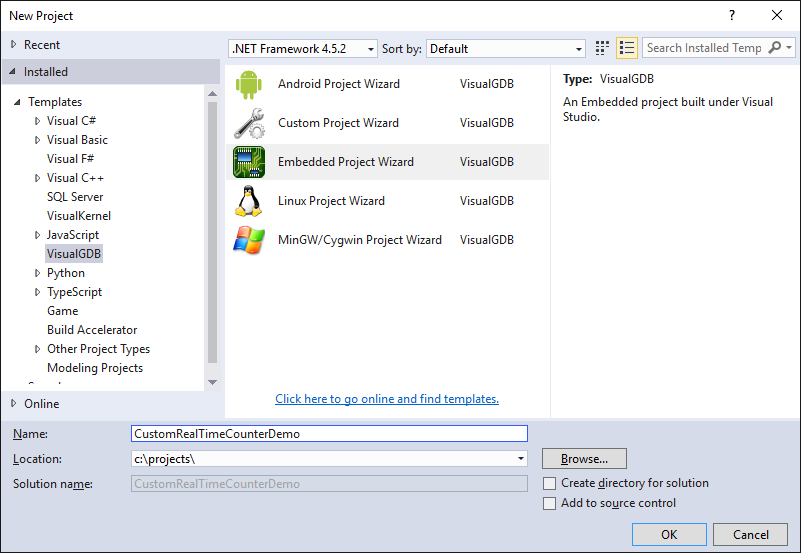
- Start Visual Studio and open the VisualGDB Embedded Project Wizard:
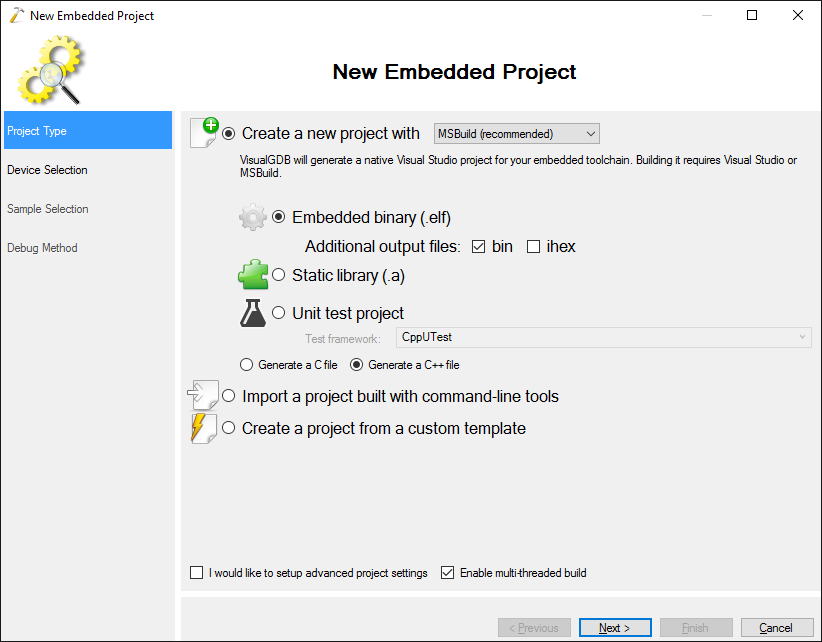
- Proceed with creating the normal application project:
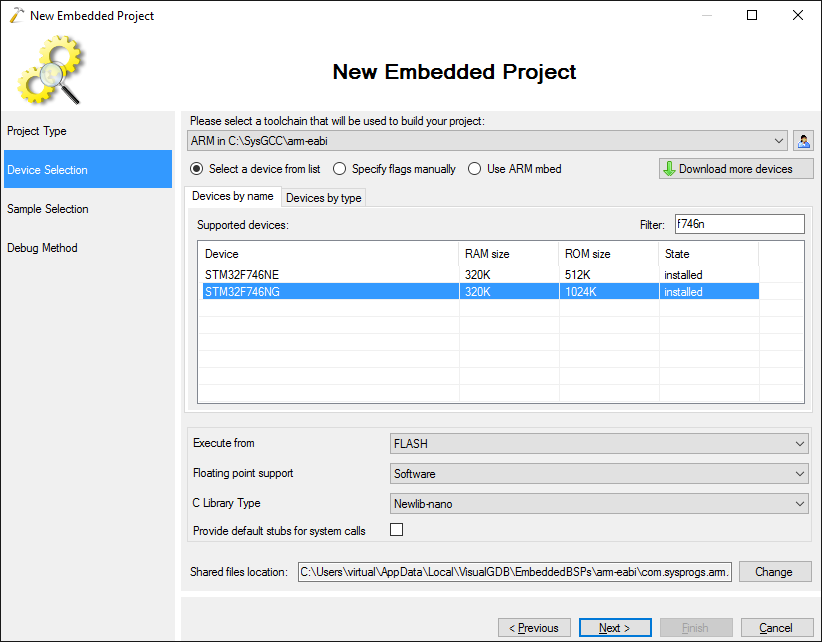
- Select the ARM toolchain and your device. In this tutorial we will use the STM32F7-Discovery board that comes with the STM32F746NG chip:
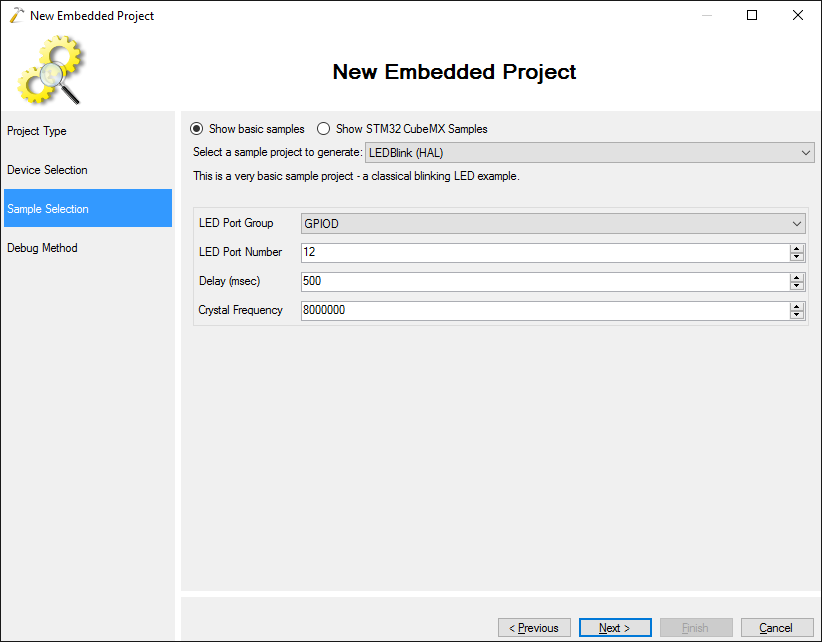
- Select the regular LEDBlink sample:
- Finally select the debug method that works with your board. In this example we will use OpenOCD with the on-board ST-Link:
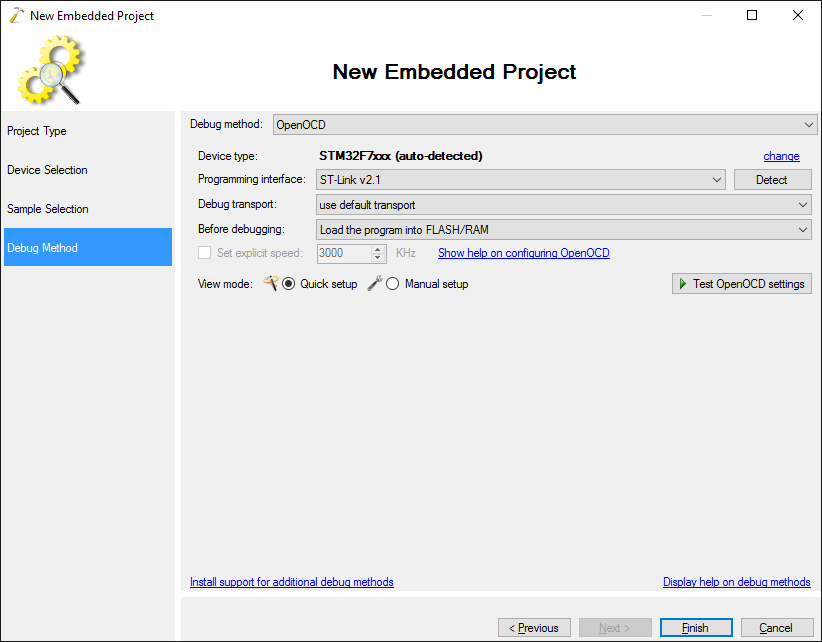
- Press “Finish” to create the project. Then open VisualGDB Project Properties, go to the Dynamic Analysis page and enable tracing of function calls:
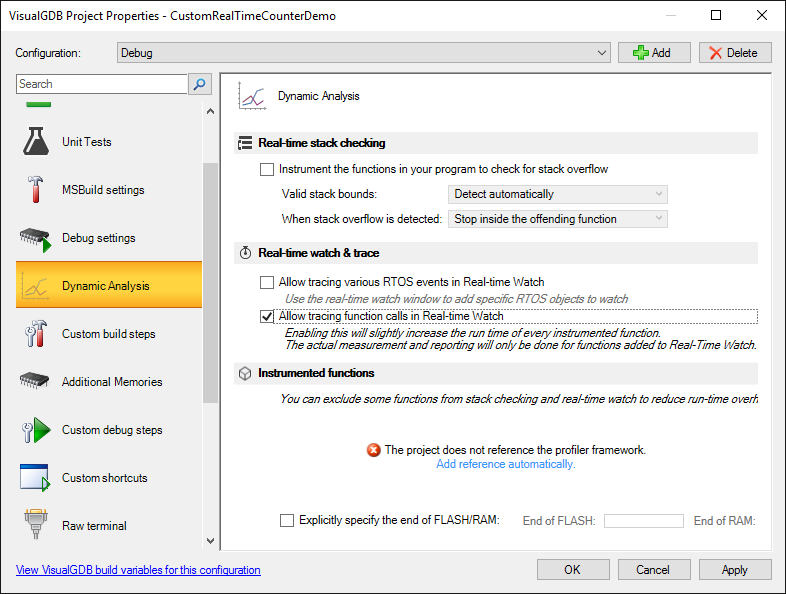 Don’t forget to click “Add reference automatically” to automatically add and configure the profiler framework.
 - Start debugging your program and add “HAL_Delay” to real-time watch:
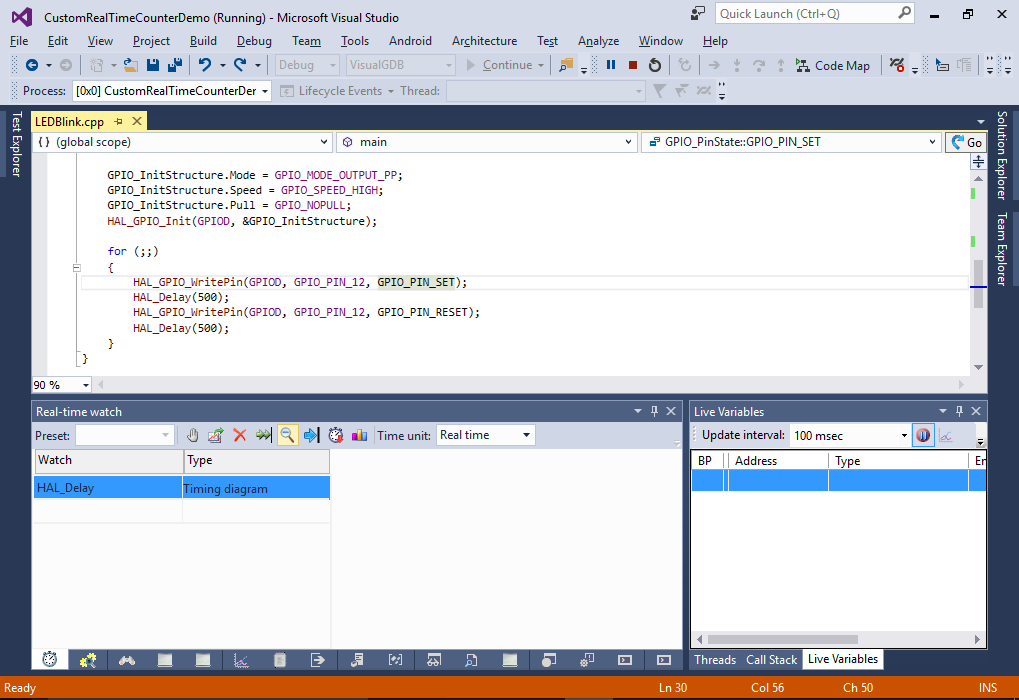
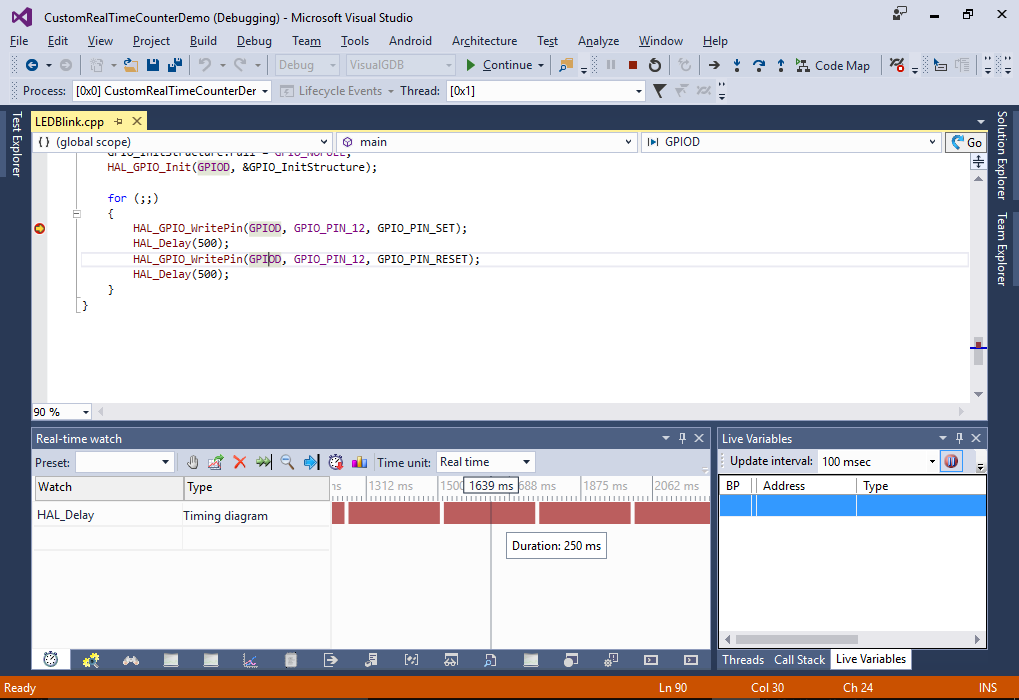
- You will see that real-time watch window will be empty. This happens because the default implementation of the instrumenting profiler and real-time watch relies on the debug cycle count register (DWT_CYCCNT) that is not supported on STM32F7 and is hence always zero:
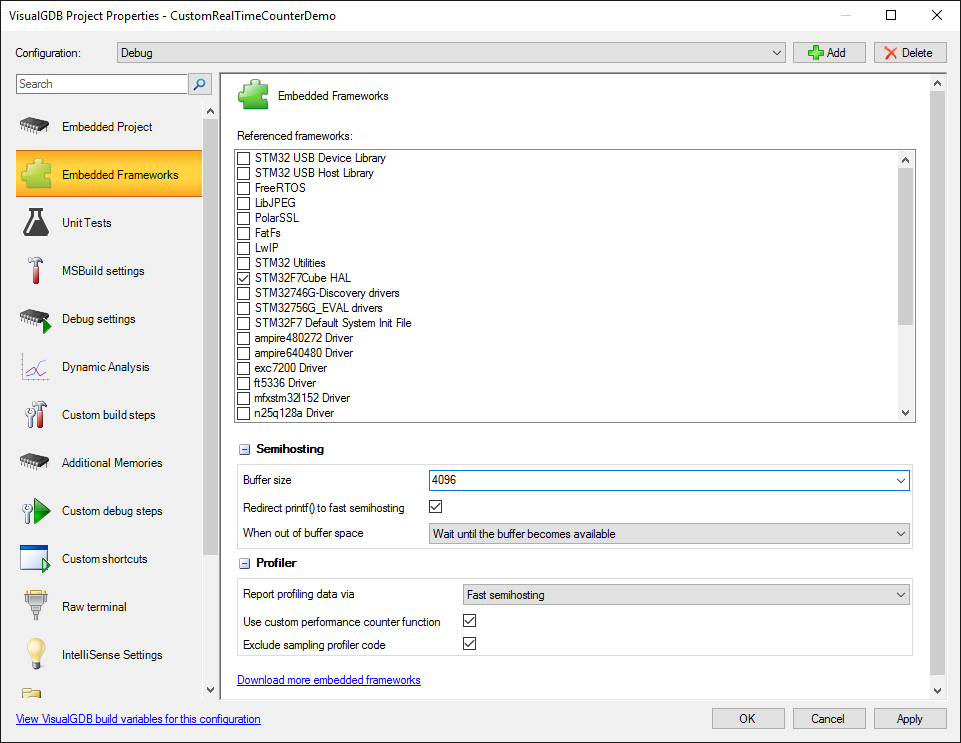
- We will now replace the original function used to query the cycle counter with a custom one that will use the STM32 timers. First, open VisualGDB Project Properties and enable the “Use custom performance counter function” checkbox on the Embedded Frameworks page:
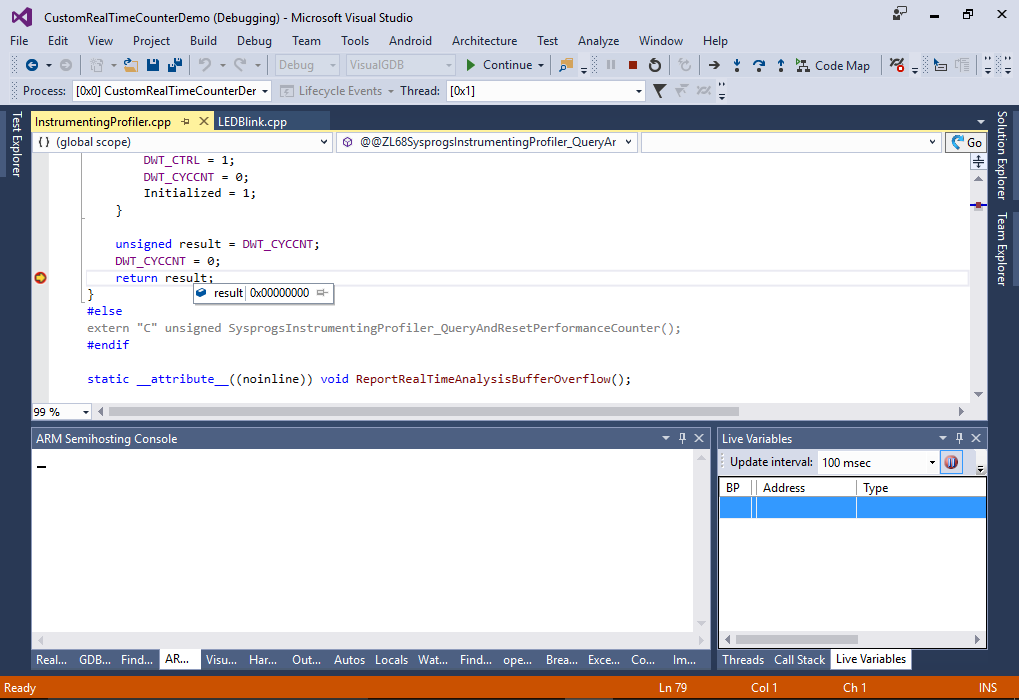
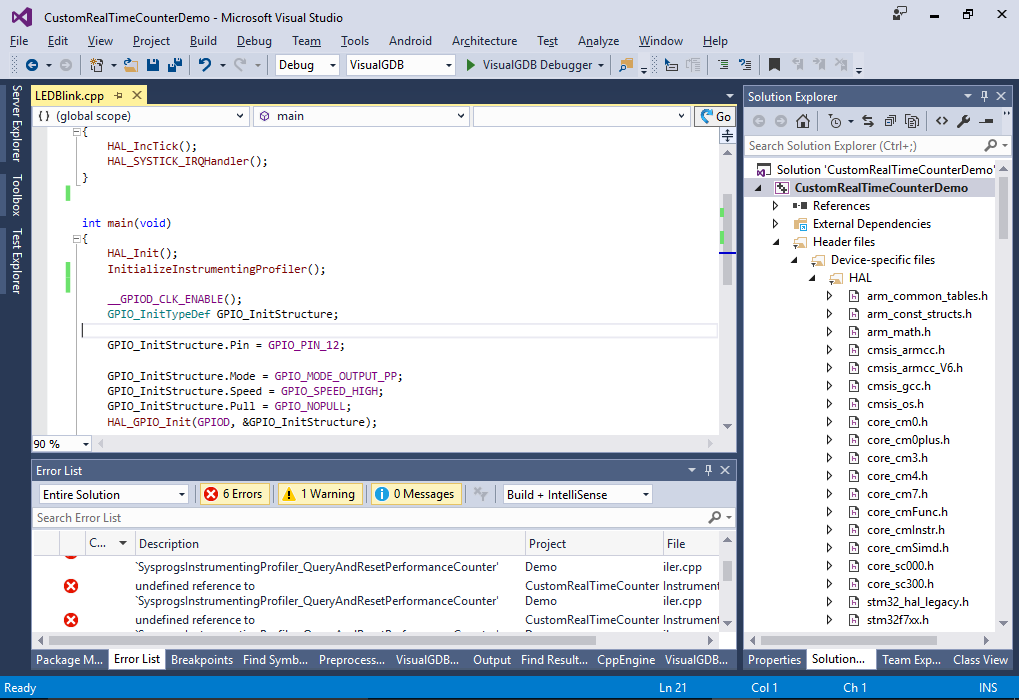
- If you try building your project now, it will complain that the SysprogsInstrumentingProfiler_QueryAndResetPerformanceCounter() function is missing:
- Add the following code to your main source file and call StartDelayCountingTimer() after InitializeInstrumentingProfiler():
static TIM_HandleTypeDef s_TimerInstance = {
    .Instance = TIM3
};

static unsigned g_TimerCounter;

extern "C" void TIM3_IRQHandler()
{
    HAL_TIM_IRQHandler(&s_TimerInstance);
    g_TimerCounter++;
}

void StartDelayCountingTimer()
{
    __TIM3_CLK_ENABLE();
    s_TimerInstance.Init.Prescaler = 1;
    s_TimerInstance.Init.CounterMode = TIM_COUNTERMODE_UP;
    s_TimerInstance.Init.Period = 0xFFFF;
    s_TimerInstance.Init.ClockDivision = TIM_CLOCKDIVISION_DIV1;
    s_TimerInstance.Init.RepetitionCounter = 0;
    HAL_TIM_Base_Init(&s_TimerInstance);
    HAL_TIM_Base_Start_IT(&s_TimerInstance);
    HAL_NVIC_EnableIRQ(TIM3_IRQn);
    HAL_NVIC_SetPriority(TIM3_IRQn, 7, 0);
}

unsigned long long SysprogsInstrumentingProfiler_ReadTimerValue()
{
    int primask = __get_PRIMASK();
    __set_PRIMASK(1);
    unsigned lowWord = __HAL_TIM_GET_COUNTER(&s_TimerInstance);
    unsigned highWord;
    if (lowWord < 1024)
    {
        highWord = g_TimerCounter;
        if (HAL_NVIC_GetPendingIRQ(TIM3_IRQn))
            highWord++;
    }
    else
        highWord = g_TimerCounter;
    __set_PRIMASK(primask);

    return (((unsigned long long)highWord) << 16) | lowWord;
}

extern "C" unsigned SysprogsInstrumentingProfiler_QueryAndResetPerformanceCounter()
{
    static unsigned long long s_PrevValue;
    unsigned long long value = SysprogsInstrumentingProfiler_ReadTimerValue();
    unsigned long long elapsed = value - s_PrevValue;
    s_PrevValue = value;
    if (elapsed > UINT32_MAX)
        return UINT32_MAX;
    else
        return (unsigned)elapsed;
}
The StartDelayCountingTimer() function will configure TIM3 to run at half the system clock speed. As the hardware counter is only 16 bits wide, the TIM3_IRQHandler() function will increase the g_TimerCounter value each time an overflow happens to keep the track of the global time. The SysprogsInstrumentingProfiler_ReadTimerValue() function will read the TIM3 counter value and combine it with the g_TimerCounter to get a 48-bit value. Finally SysprogsInstrumentingProfiler_QueryAndResetPerformanceCounter() called by the profiler will return the amount of ticks passed since the last call to it.
- Now you can press F5 to start debugging. The Real-time watch should now work:
 If it does not work, ensure you call StartDelayCountingTimer() after InitializeInstrumentingProfiler().
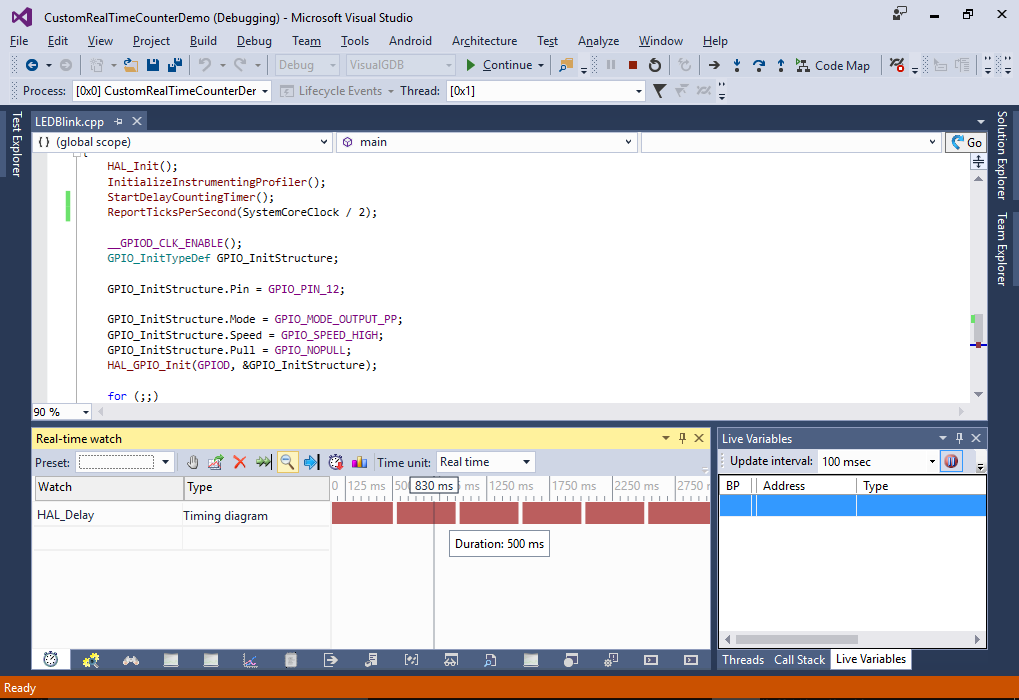
 - In this example the time intervals shown in real-time watch will be twice shorter than the actual intervals (e.g. 250ms for a 500ms wait). This happens because the timer runs at half of the system clock. You can report the correct amount of ticks per second to VisualGDB by calling the ReportTicksPerSecond() function after starting the timer:
ReportTicksPerSecond(SystemCoreClock / 2);
- To reduce the overhead caused by the TIM3_IRQHandler() function you can change it to clear the interrupt flag without calling the HAL functions:
extern "C" void TIM3_IRQHandler()
{
    __HAL_TIM_CLEAR_IT(&s_TimerInstance, TIM_IT_UPDATE);
    g_TimerCounter++;
}
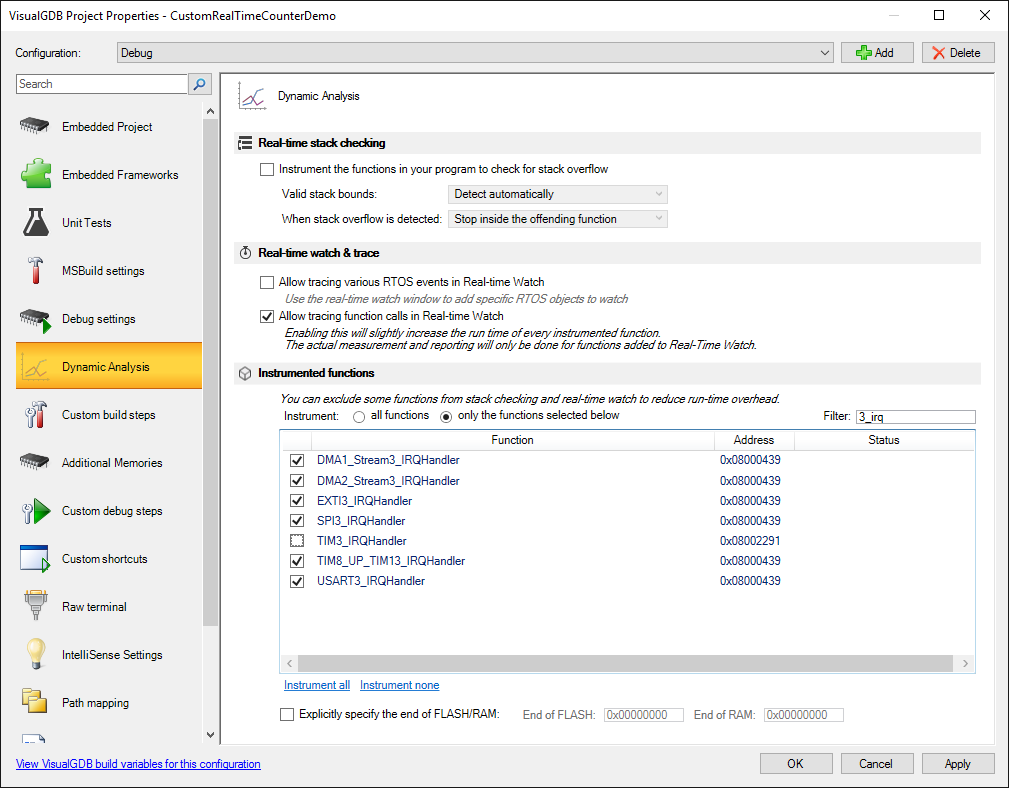
- To further reduce the overhead you can mark it as non-instrumentable via VisualGDB Project Properties:
- If the overhead caused by the new SysprogsInstrumentingProfiler_QueryAndResetPerformanceCounter() function is still to high, you can limit it to only reading the 16-bit counter and disable the timer interrupt:
extern "C" unsigned SysprogsInstrumentingProfiler_QueryAndResetPerformanceCounter()
{
    unsigned value = __HAL_TIM_GET_COUNTER(&s_TimerInstance);
    __HAL_TIM_SET_COUNTER(&s_TimerInstance, 0);
    return value;
}
Note that this will break the reported timings if the 16-bit timer overflows between 2 consecutive events, that could be counteracted by lowering the prescaler:
s_TimerInstance.Init.Period = 0xFFFF;