Optimizing STM32 USB performance with Real-time watch
This tutorial shows how to analyze and optimize the performance of a USB device based on the STM32 microcontroller using the VisualGDB real-time watch feature.
We will create a basic firmware that receives the data over USB and sends it back in chunks, will measure the throughput and use the real-time watch to analyze what exactly happens on the device and how to improve the USB performance.
Before you begin, install VisualGDB 5.2 or later.
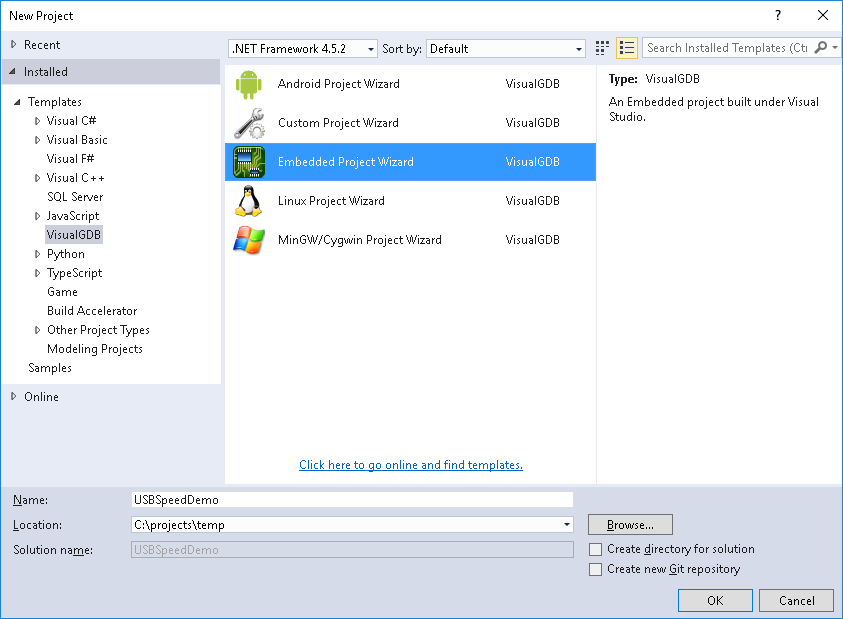
- Start Visual Studio and open the VisualGDB Embedded Project Wizard:
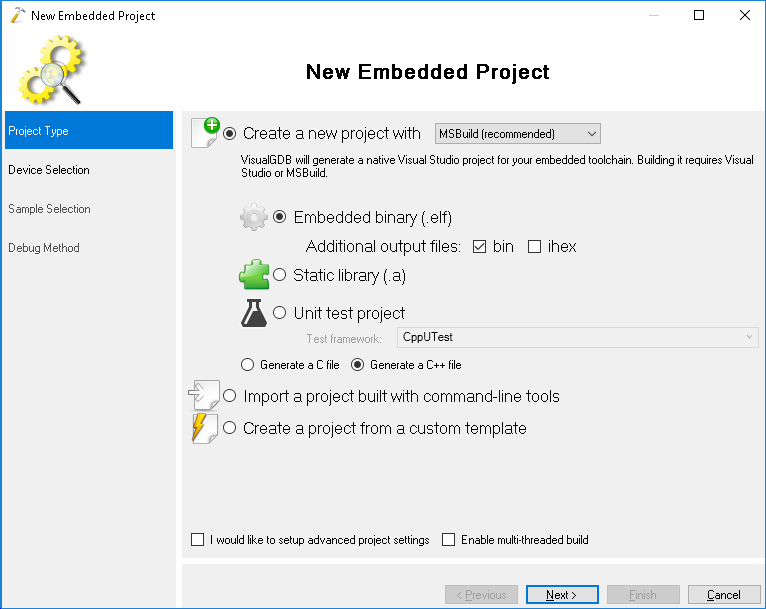
- Proceed with the default “Embedded binary” setting:
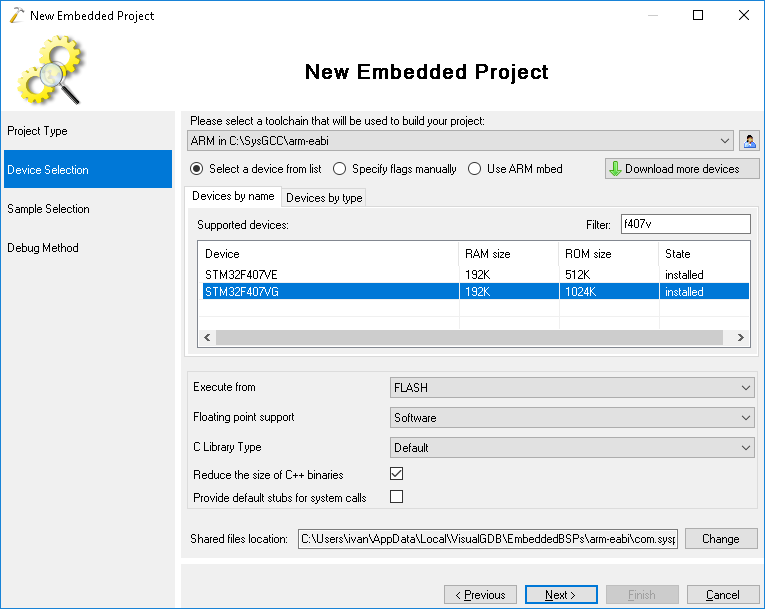
- Select the ARM toolchain and choose your device. In this tutorial we will use the STM32F4Discovery board that has the STM32F407VG chip:
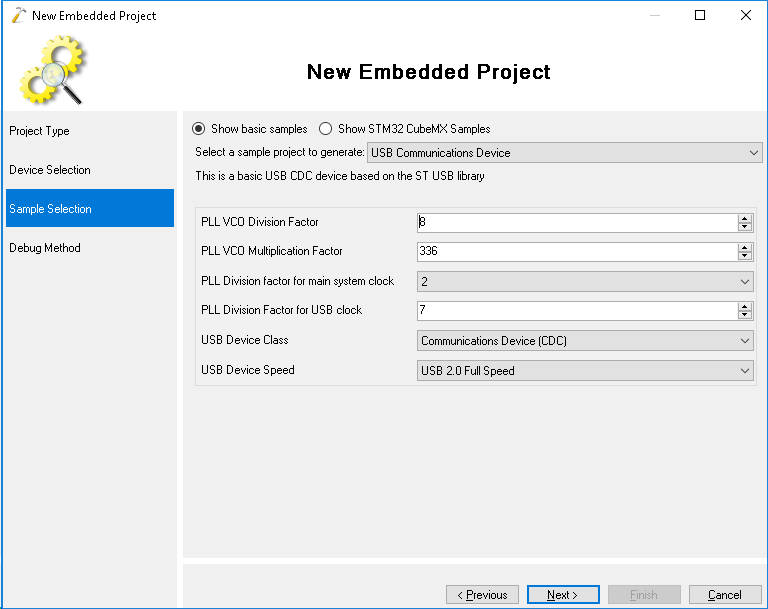
- On the Sample Selection page choose the “USB Communications Device” sample and press “Next”:
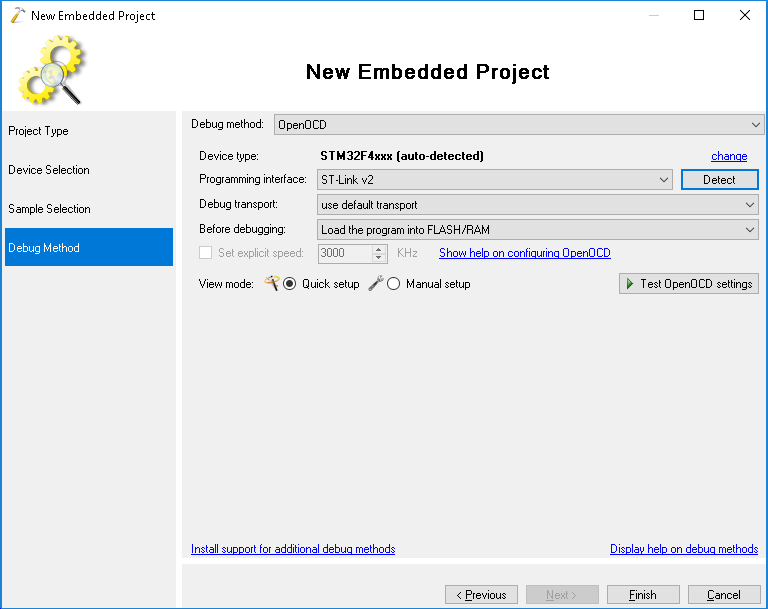
- Finally select your debugging method. The easiest way to get it to work is to select OpenOCD, plug in your board and click “Detect” to automatically detect the necessary settings:
- Press “Finish” to generate your project. Then replace the loop inside main() with the following loop:
    char buffer[4096];
    for (;;)
    {
        int total = 0;
        while (total < sizeof(buffer))
        {
            int done = VCP_read(buffer + total, sizeof(buffer) - total);
            total += done;
        }

        if (VCP_write(buffer, total) != total)
        {
            asm("bkpt 255");
        }
    }
This code will read data in 4KB chunks and immediately send it back. For simplicity we don’t apply any transformation to the received data and just send it back as is.
- Before you can try out the code, go to the definition of VCP_write() and check that the loop at the beginning of it looks as shown below. If not, correct it:
    if (size > CDC_DATA_HS_OUT_PACKET_SIZE)
    {
        for (int offset = 0; offset < size; )
        {
            int todo = MIN(CDC_DATA_HS_OUT_PACKET_SIZE,
                size - offset);
            int done = VCP_write(((char *)pBuffer) + offset, todo);
            if (done != todo)
                return offset + done;
            offset += done;
        }

        return size;
    }
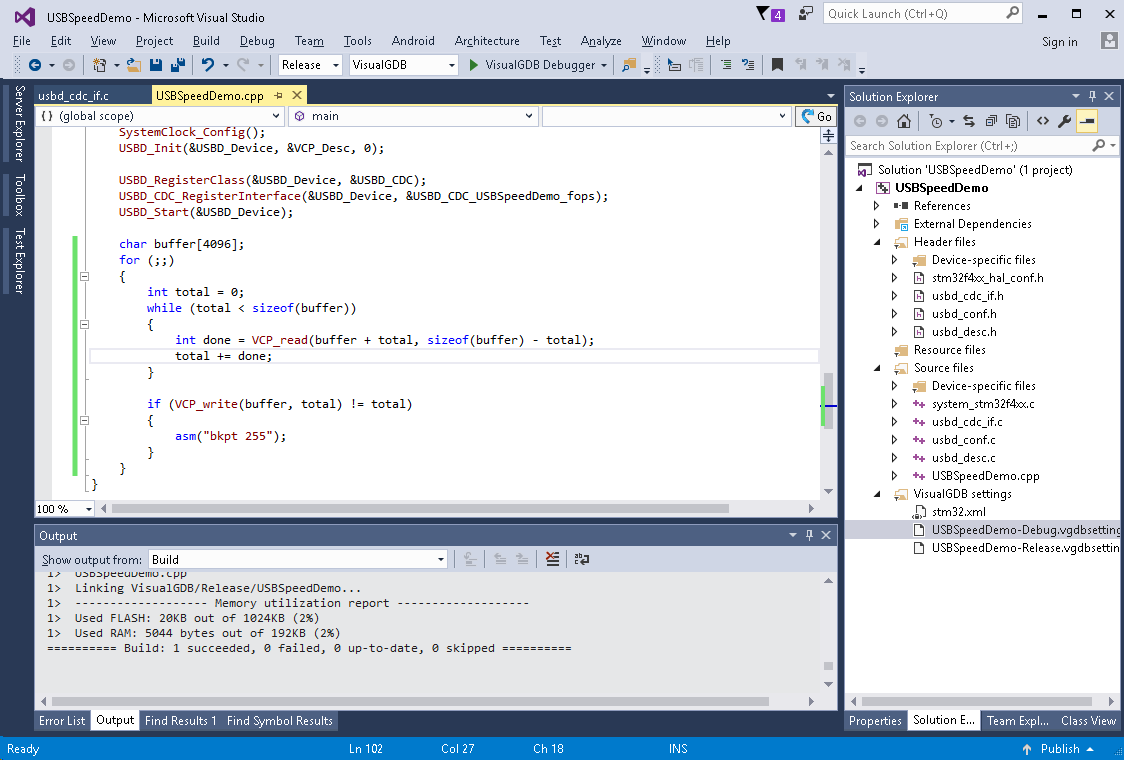
- Switch the configuration to ‘release’, build it and run with F5:
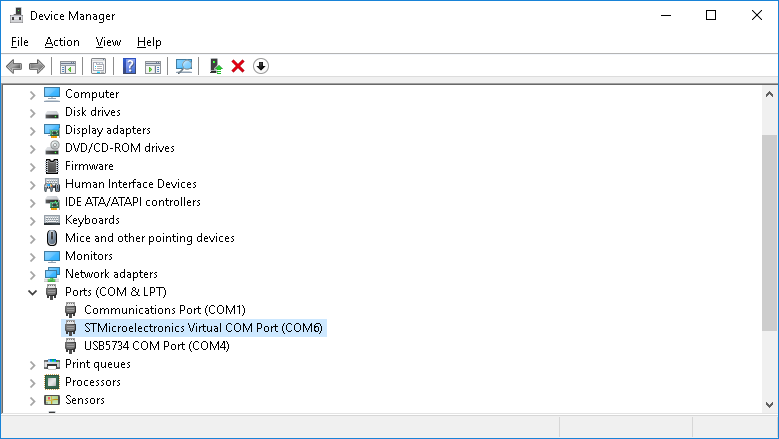
- Locate the USB device in the Device Manager and note its COM port number:
- We will use the following benchmark program to measure the USB performance. Build it in another Visual Studio instance and run it:
using System;
using System.IO.Ports;
using System.Threading;

namespace USBBenchmark
{
    class Program
    {
        static void Main(string[] args)
        {
            SerialPort port = new SerialPort("COM6");
            port.Open();

            var buf = new byte[65536];
            for (int i = 0; i < buf.Length; i++)
                buf[i] = (byte)i;

            new Thread(() => ReadThread(port)).Start();

            DateTime start = DateTime.Now;
            long bytesWritten = 0;
            for (;;)
            {
                port.Write(buf, 0, buf.Length);
                bytesWritten += buf.Length;

                double msec = (DateTime.Now - start).TotalMilliseconds;
                double bytesPerSecond = (bytesWritten * 1000) / msec;
                double kbPerSecond = bytesPerSecond / 1024;
                Console.Write($"\rWritten: {bytesWritten / 1024}KB; time: {msec / 1000:f1} sec; Average speed: {kbPerSecond:f0} KB/sec");
            }
        }

        static void ReadThread(SerialPort port)
        {
            var buf = new byte[65536];
            for (;;)
            {
                int done = port.Read(buf, 0, buf.Length);
            }
        }
    }
}
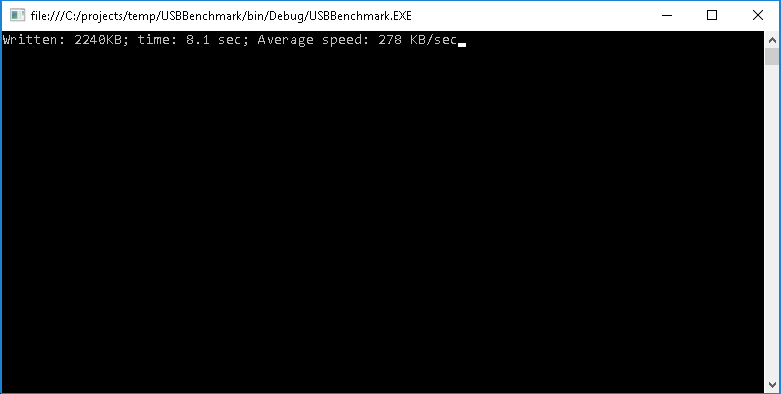
- Note down the speed it shows. In this example we have measured 309 KB/sec:
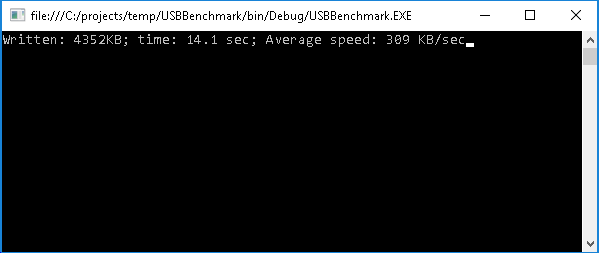
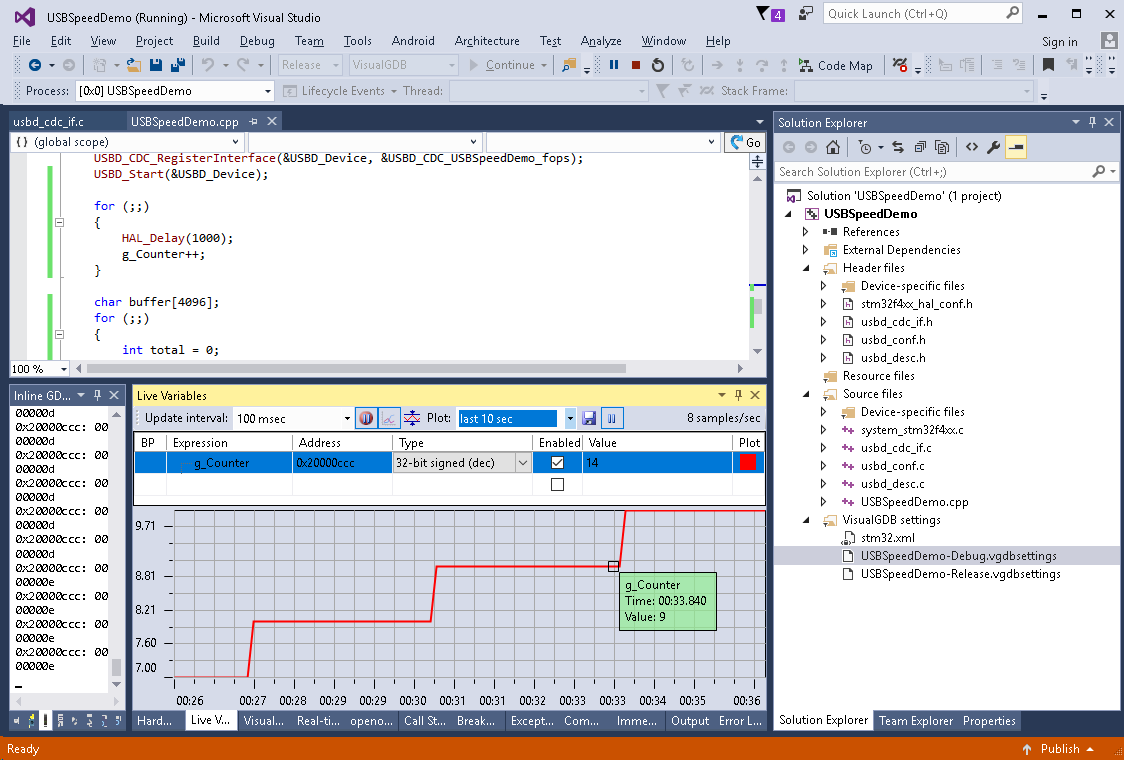
- Now we will use the real-time watch to obtain some measurements and check for optimization possibilities. Before we do that, do a quick check that the oscillator speed specified in the HAL configuration file matches the one on your board. The easiest way to verify it is to insert the following loop in main() and check that the value of g_Counter increases exactly each second:
    for (;;)
    {
        HAL_Delay(1000);
        g_Counter++;
    }
- For STM32F4Discovery the default value in stm32f4x_hal_config.h is incorrect and the 1-second delay will actually take 3 seconds:
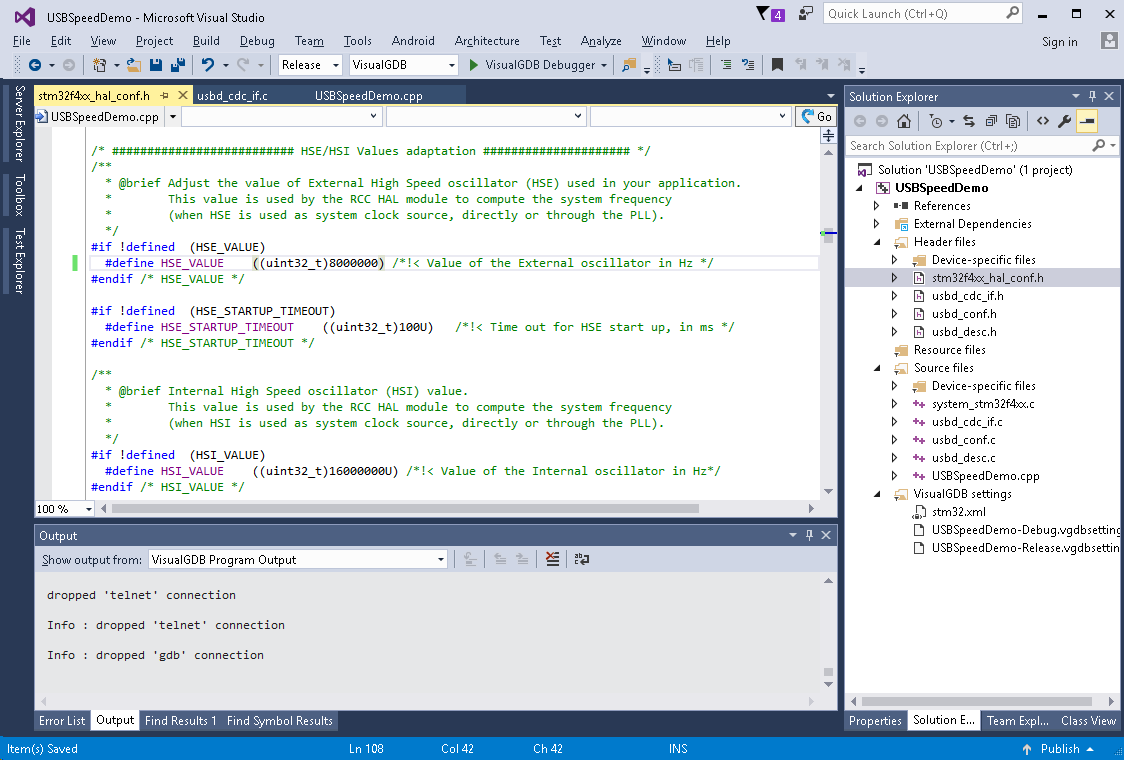
- Adjust the value if needed (on STM32F4Discovery the HSE_VALUE should be set to 8 MHz):
- Now we can finally take some measurements. Go to the Dynamic Analysis page of VisualGDB Project Properties and check the “Allow tracing function calls” checkbox:
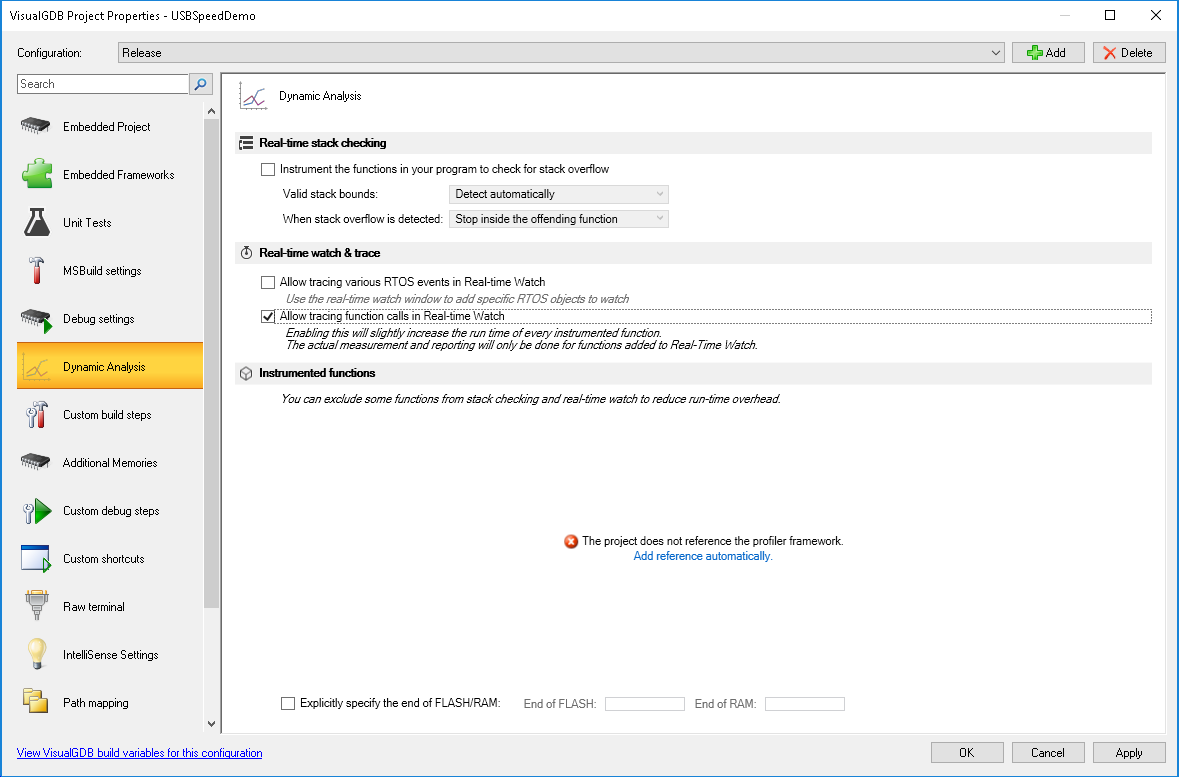 If you have not referenced the profiler framework before, click the “Add Reference Manually” link and build your project.
 - Run the project again and measure the speed. Instrumenting the functions slows them down, so the overall performance will reduce by around 10%. When you compare different measurements when instrumentation turned on, ensure you use the reduced value as your baseline:
- The first thing we will measure is the timing of VCP_read() and VCP_write(). Stop your program once the benchmark is running and, those functions to the real-time watch window and resume your program to collect some data. VisualGDB will show many calls to VCP_read() and a few calls to VCP_write() interrupted by profiling buffer overflows:
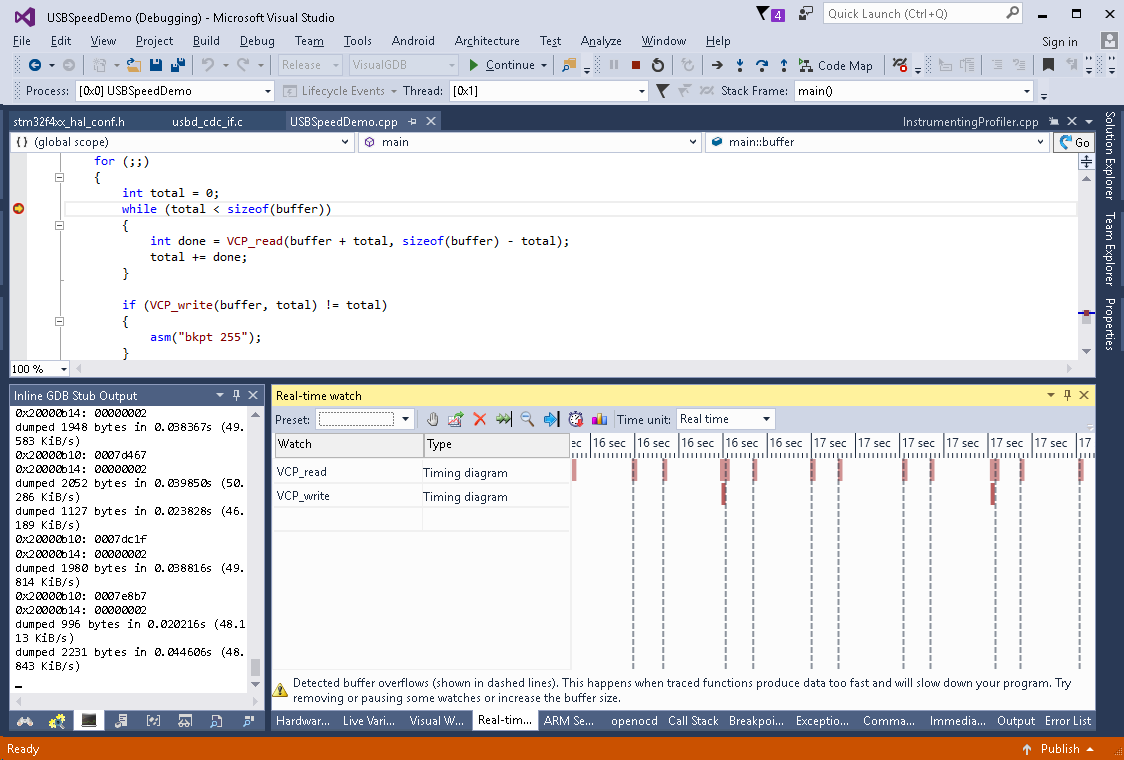
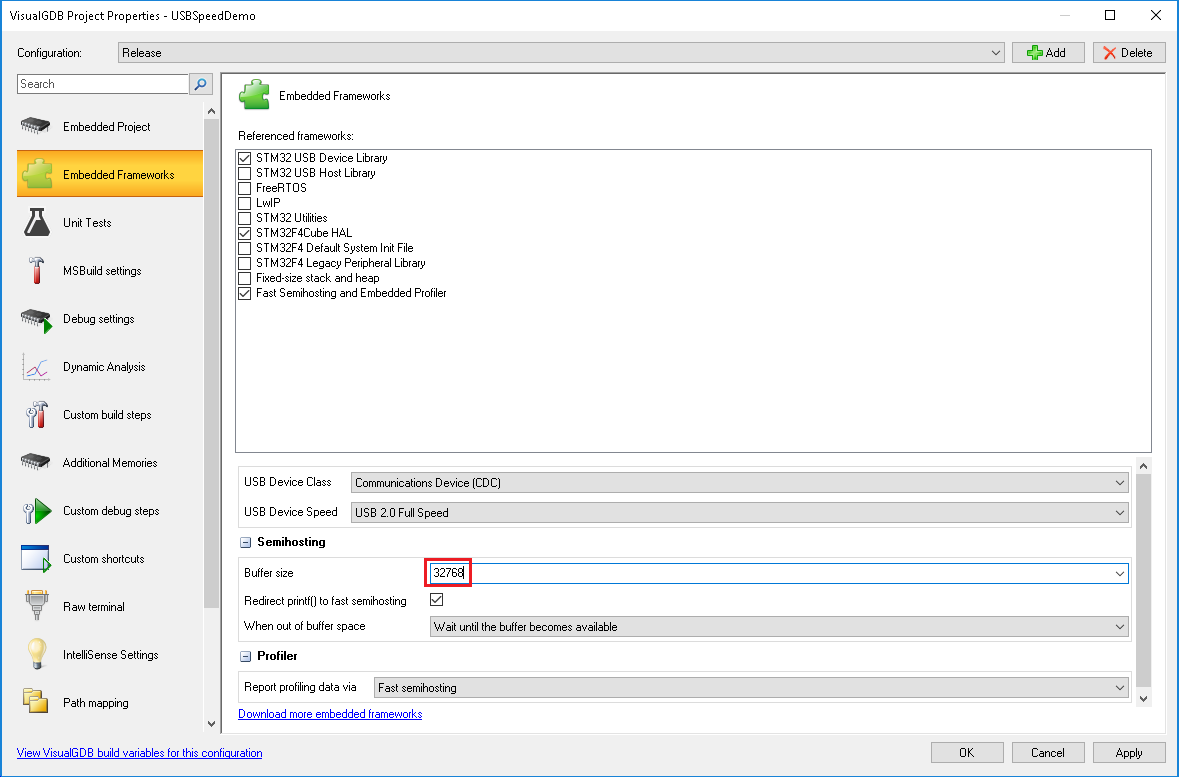
- The buffer overflows happen when too much real-time data is captured and the program needs to wait for VisualGDB to read it. Most of the time VCP_read() immediately returns 0, so it is generating huge amounts of real-time data and quickly fills the buffer. In order to get a precise picture of what is happening inside the loop we need to capture at least one one entire loop (i.e. the time between 2 calls to VCP_write()) without any buffer overflows. We can do this by either reducing the amount of measured data (e.g. by measuring some block inside VCP_read() that does not get invoked too often) or by simply increasing the buffer size. In this example we will use the second approach and increase the buffer size to 32KB:
- Build and run your program, start the benchmarking and put a breakpoint at the beginning of the loop. Then add VCP_read() and VCP_write() to real-time watch and enable the ‘stop on overflow’ option:
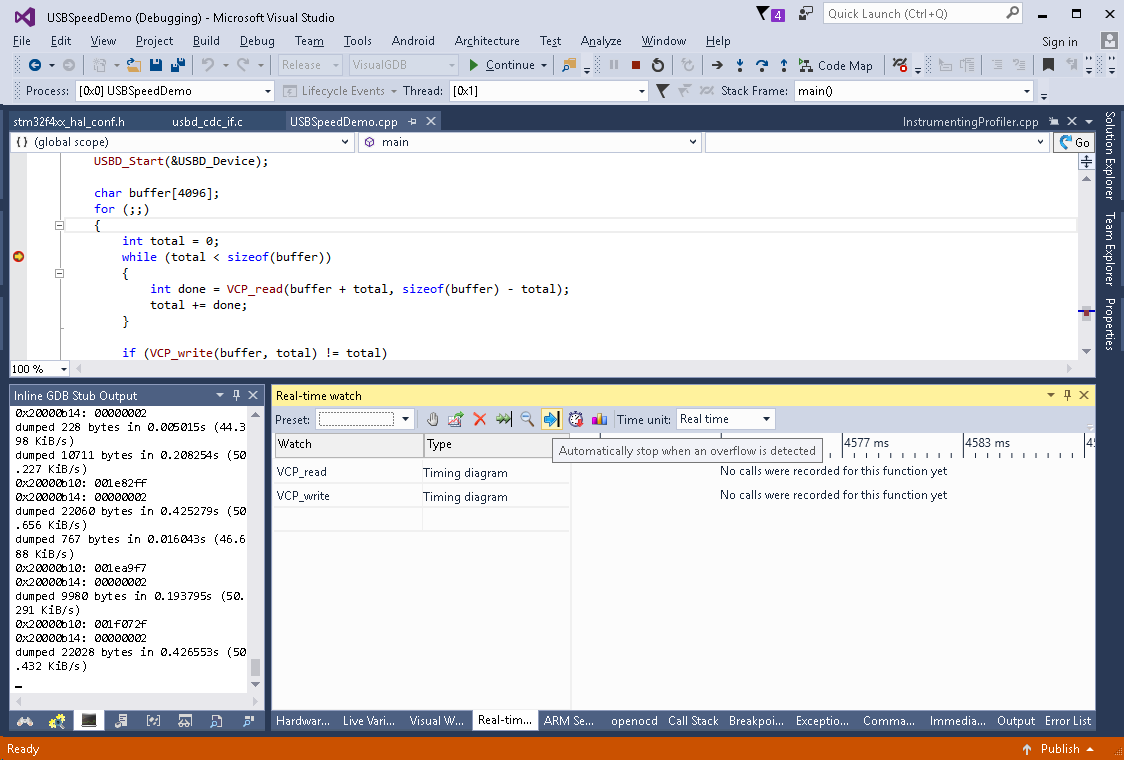
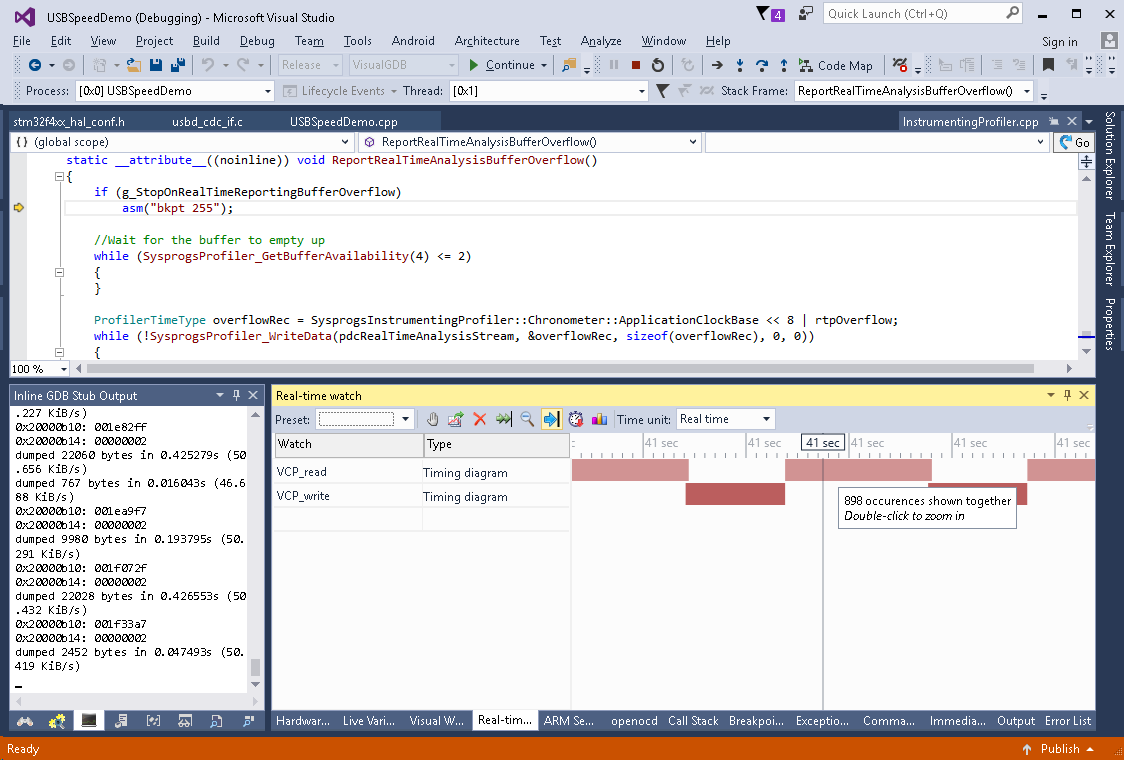
- Then resume your program and wait until it stops on an overflow event. Now we have enough data to see what is going on. It quickly becomes obvious from the graph that the VCP_write() function does not do any buffering and the next loop iteration does not start until the write() returns:
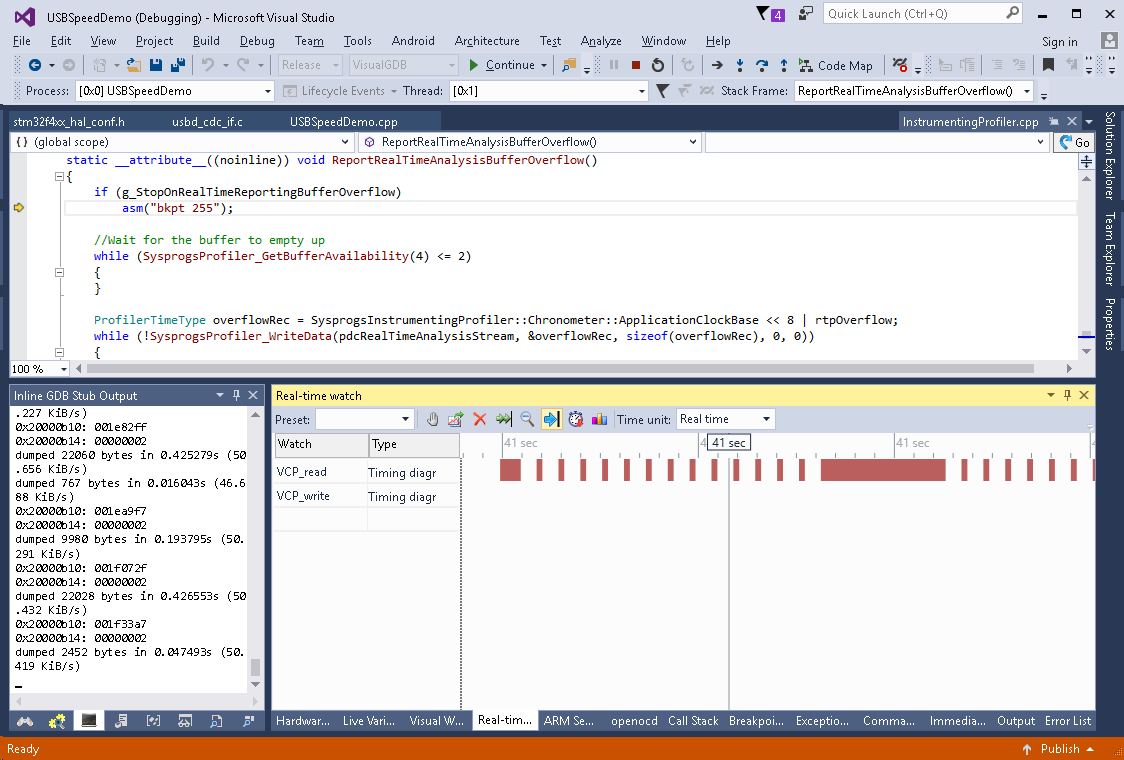
- You could zoom in to see that most of the time VCP_read() returns immediately and sometimes it takes more time (when it has data to return):
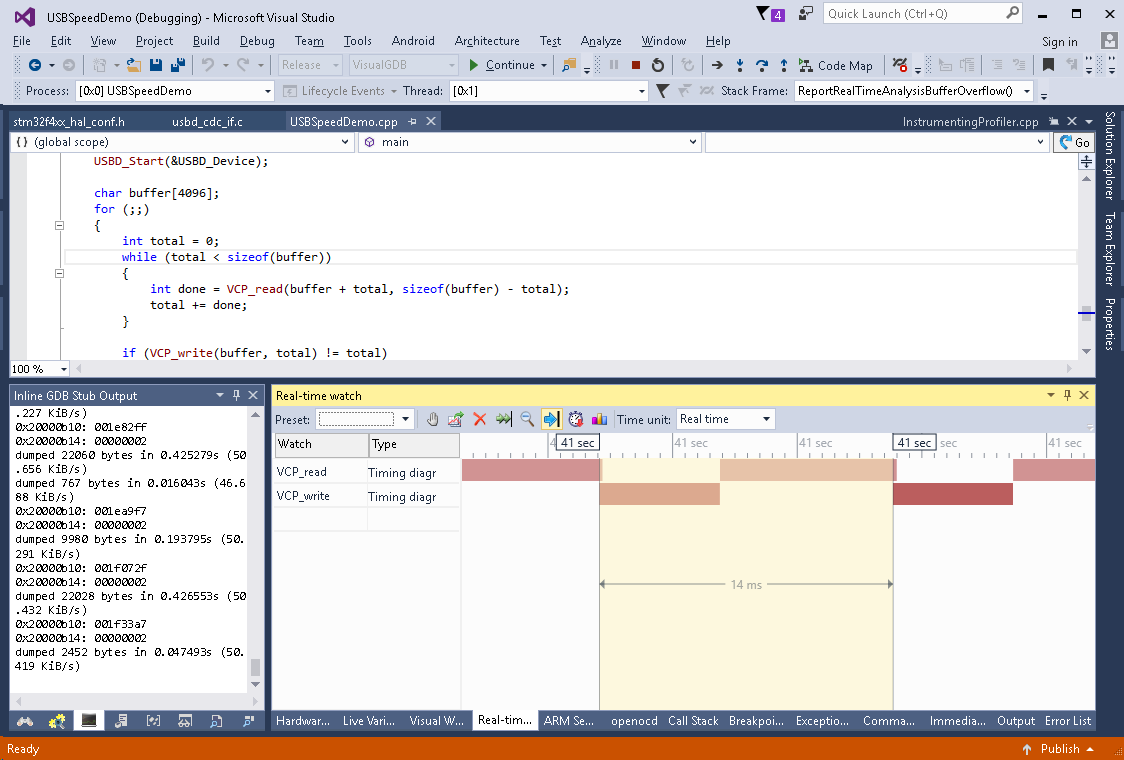
- The time between 2 calls to VCP_write() should be a good measure of how much time it takes to transfer 4 KB of data. In our example it was 14 msec that corresponds to 4K * 1000 / 14 = 285 KB/sec that is 2% more than the average throughput measured before (slight variance in measurements is normal due to USB bus events):
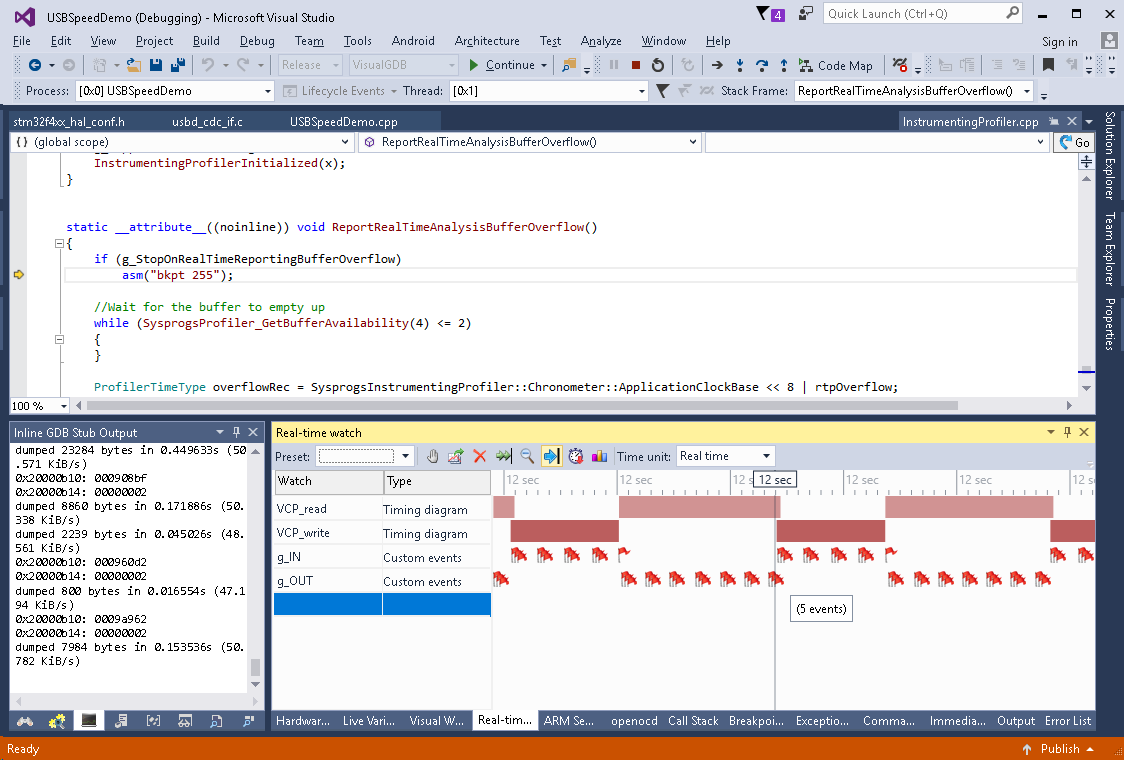
- The easiest way to see what is happening on the USB bus is to modify the USB interrupt handler to generate custom events each time a ‘read complete’ or ‘write complete’ interrupt arrives:
#include <CustomRealTimeWatches.h>
EventStreamWatch g_IN, g_OUT;

void OTG_FS_IRQHandler(void)
{
    if (__HAL_PCD_GET_FLAG(&hpcd, USB_OTG_GINTSTS_IEPINT))
    {
        g_IN.ReportEvent("in");
    }
    if (__HAL_PCD_GET_FLAG(&hpcd, USB_OTG_GINTSTS_OEPINT))
    {
        g_OUT.ReportEvent("out");
    }

    HAL_PCD_IRQHandler(&hpcd);
}
- Build the new code and add g_IN and g_OUT to the real-time watches. This confirms that reading and writing does not happen in opening and suggests a way to optimize it:
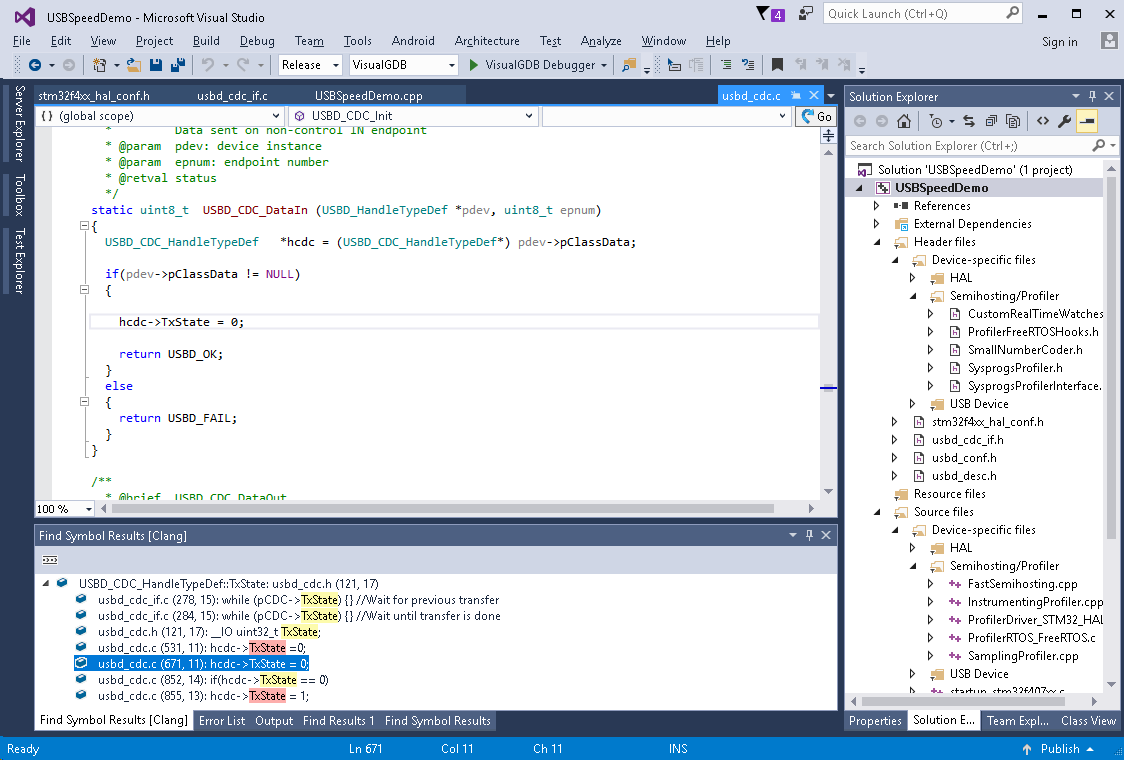
- If you look into the VCP_write() function, you will see that it waits for the TxState field of the CDC state structure to be 0 before it returns. Quickly checking for references to TxState (write references are shown in read) shows that it’s assigned from the USB_CDC_DataIn() function that is called when a USB packet is successfully sent:
- We will now modify the VCP_write() function to be asynchronous, i.e. to start a multi-packet transfer and return immediately. First of all, add a TxTotalRemainingLength field to USBD_CDC_HandleTypeDef:
    typedef struct
    {
        uint32_t data[CDC_DATA_HS_MAX_PACKET_SIZE / 4];
        uint8_t  CmdOpCode;
        uint8_t  CmdLength;
        uint8_t  *RxBuffer;
        uint8_t  *TxBuffer;
        uint32_t RxLength;
        uint32_t TxLength;
        uint32_t TxTotalRemainingLength;

        __IO uint32_t TxState;
        __IO uint32_t RxState;
    }
    USBD_CDC_HandleTypeDef;
Then change USBD_CDC_SetTxBuffer() as follows:
uint8_t  USBD_CDC_SetTxBuffer(USBD_HandleTypeDef   *pdev,
    uint8_t  *pbuff,
    int packet_length,
    int total_length)
{
    USBD_CDC_HandleTypeDef   *hcdc = (USBD_CDC_HandleTypeDef*) pdev->pClassData;

    hcdc->TxBuffer = pbuff;
    hcdc->TxLength = MIN(packet_length, total_length);
    hcdc->TxTotalRemainingLength = total_length;

    return USBD_OK;
}
Then update USBD_CDC_DataIn() to immediately start another packet it TxTotalRemainingLength is not 0:
static uint8_t  USBD_CDC_DataIn(USBD_HandleTypeDef *pdev, uint8_t epnum)
{
    USBD_CDC_HandleTypeDef   *hcdc = (USBD_CDC_HandleTypeDef*) pdev->pClassData;

    if (pdev->pClassData != NULL)
    {
        hcdc->TxTotalRemainingLength -= hcdc->TxLength;
        hcdc->TxBuffer += hcdc->TxLength;
        if (hcdc->TxTotalRemainingLength)
        {
            if (hcdc->TxLength > hcdc->TxTotalRemainingLength)
                hcdc->TxLength = hcdc->TxTotalRemainingLength;
            hcdc->TxState = 2;
            if (USBD_CDC_TransmitPacket(pdev) != USBD_OK)
                asm("bkpt 255");
        }
        else
            hcdc->TxState = 0;

        return USBD_OK;
    }
    else
    {
        return USBD_FAIL;
    }
}
Finally rename VCP_write() to VCP_write_async() and change its contents as follows:
int VCP_write_async(const void *pBuffer, int size)
{
    USBD_CDC_HandleTypeDef *pCDC = (USBD_CDC_HandleTypeDef *)USBD_Device.pClassData;
    while (pCDC->TxState) {} //Wait for previous transfer

    USBD_CDC_SetTxBuffer(&USBD_Device, (uint8_t *)pBuffer, CDC_DATA_FS_OUT_PACKET_SIZE, size);
    if (USBD_CDC_TransmitPacket(&USBD_Device) != USBD_OK)
        return 0;

    return size;
}
- Now we can change the loop inside main() to use 2 buffers: one for sending the previous data chunk and another one for receiving a new one:
    const int bufferSize = 4096;
    char buffer1[bufferSize], buffer2[bufferSize];
    for (int iter = 0;;iter++)
    {
        char *pBuffer = (iter % 2) ? buffer1 : buffer2;
        int total = 0;
        while (total < bufferSize)
        {
            int done = VCP_read(pBuffer + total, bufferSize - total);
            total += done;
        }

        if (VCP_write_async(pBuffer, total) != total)
        {
            asm("bkpt 255");
        }
    }
- Run the updated program and get a measurement of one full cycle in real-time watch:
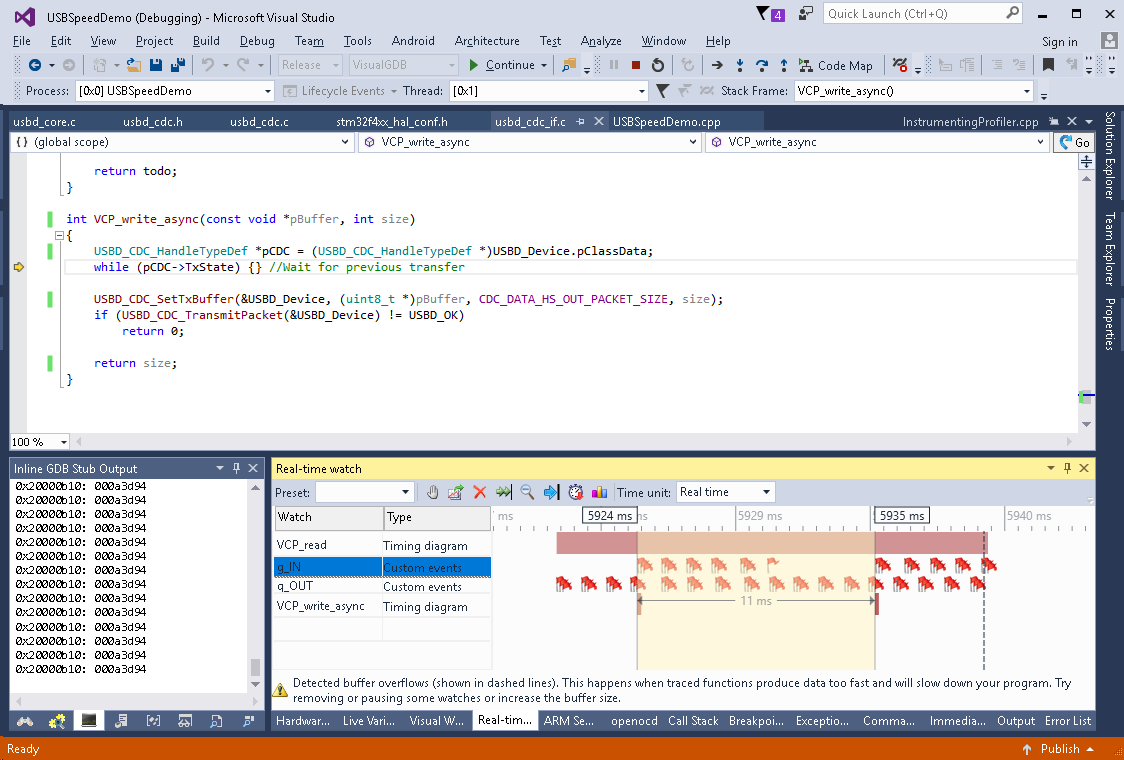
- Reading and writing interrupts now overlap and the time between calls to VCP_write_async() was reduced to 11 msec that corresponds to 4K * 1000 / 11 = 363KB/sec (~1.3x faster). Confirm this by pausing real-time watches and running the benchmark:
 Note that running the benchmark with real-time watches active will result in much slower speed as each time the real-time data buffer is filled, the program is delayed until it is read by VisualGDB.
 - Another observation clearly visible from the real-time watch window is that sending data to the computer (IN endpoint) takes less time than receiving it (OUT endpoint):
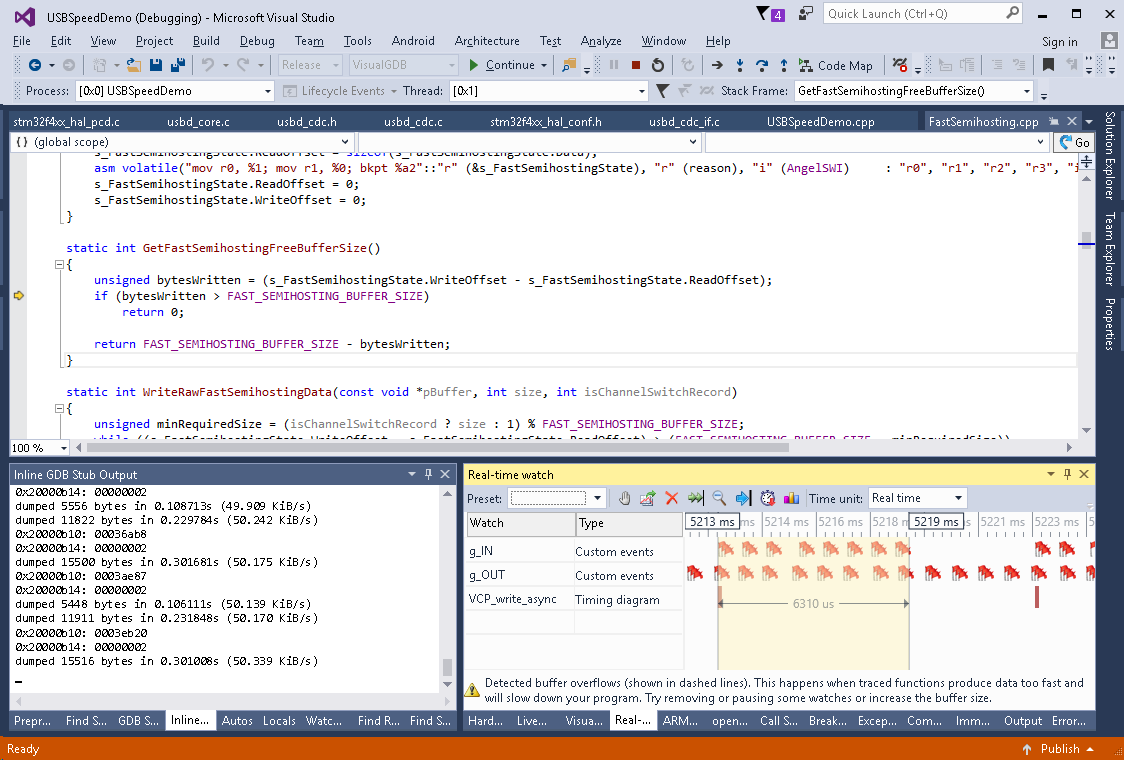
- If you compare the reading and writing code, you will see that we are sending data in 512-byte packets and receiving it in 64-byte ones. 512-byte packets supported in the USB 2.0 High Speed (but not in Full Speed mode), and are causing strange timing side effects. Adjust the VCP_write_async() function to use the 64-byte packets (CDC_DATA_FS_OUT_PACKET_SIZE):
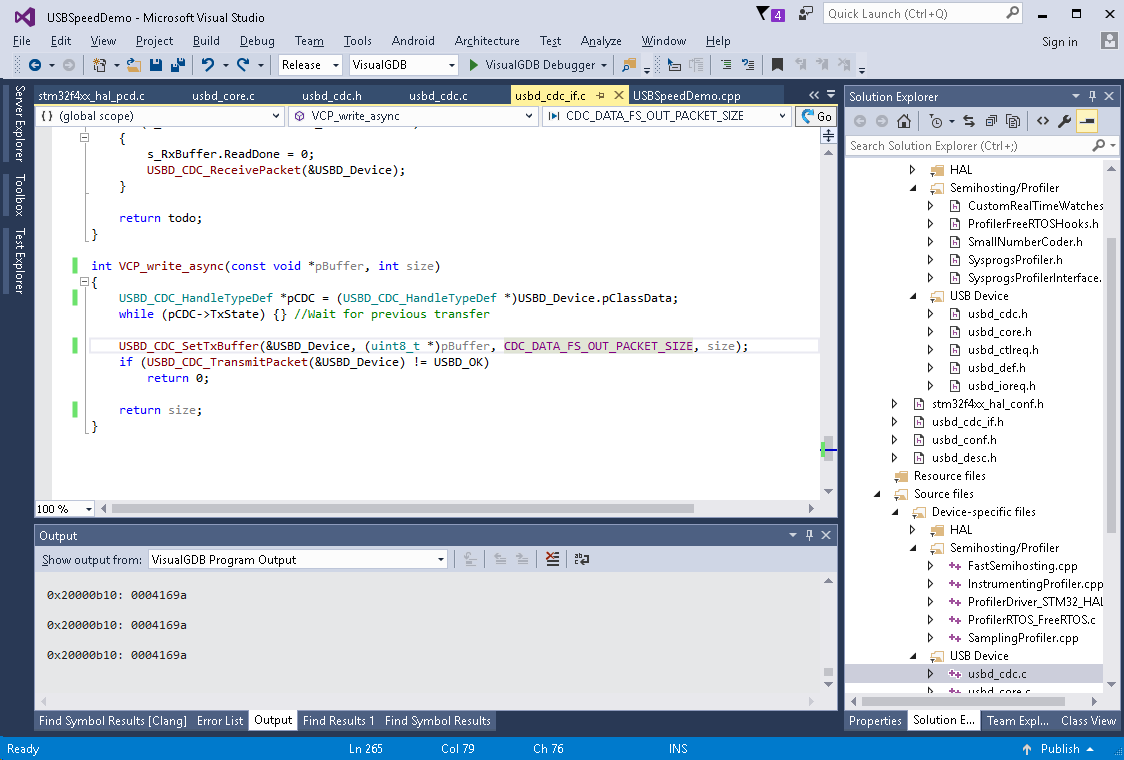
- This balances reading and writing times and reduces the cycle time to ~8 msec:
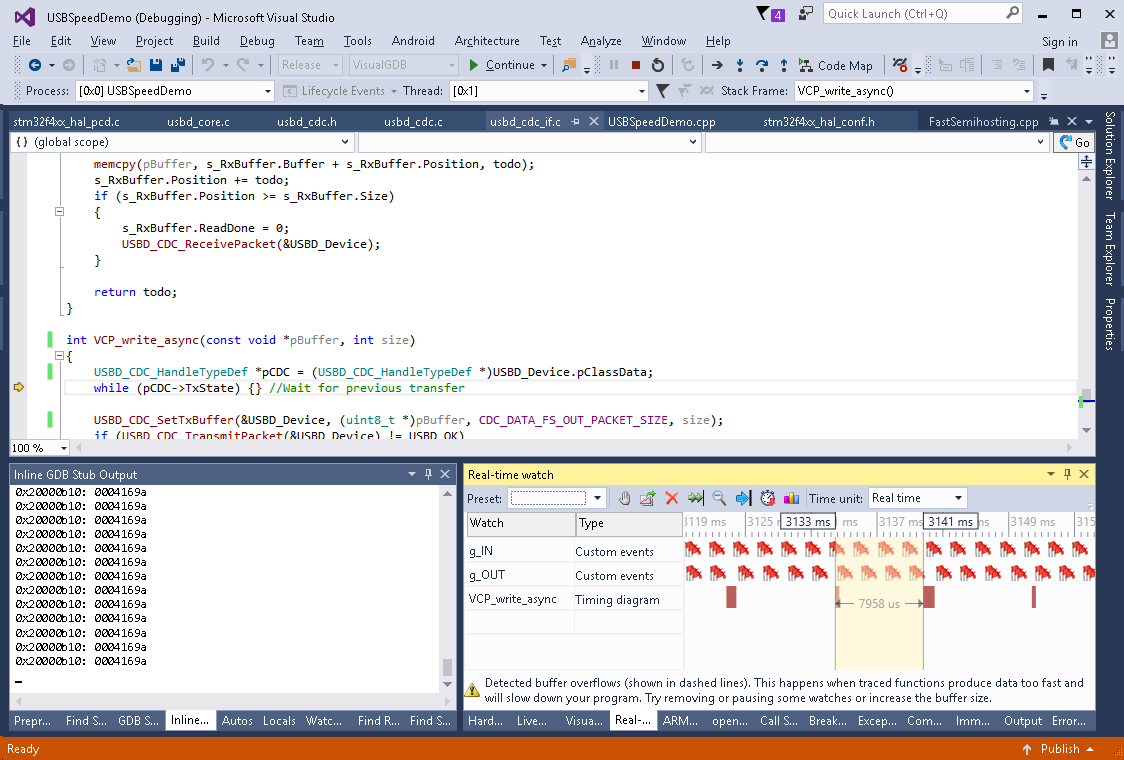
- Disable the function tracing on the Dynamic Analysis page to get the maximum possible speed and run the benchmark again:
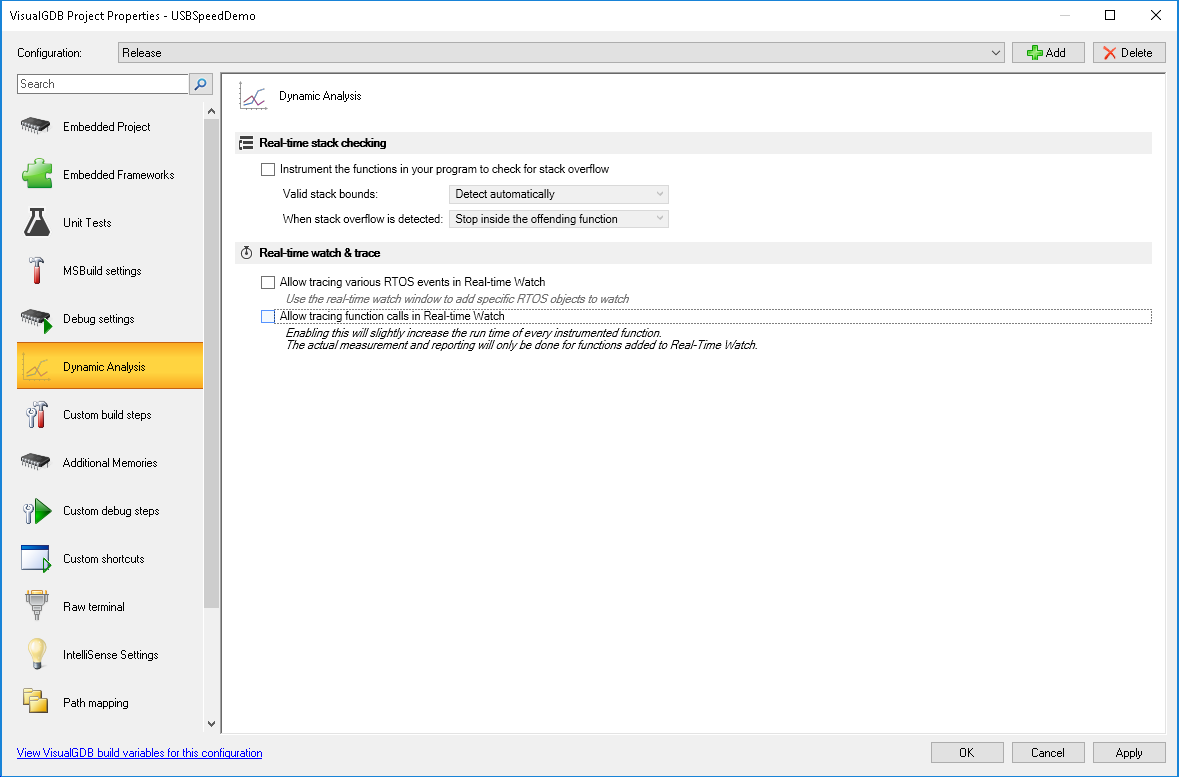
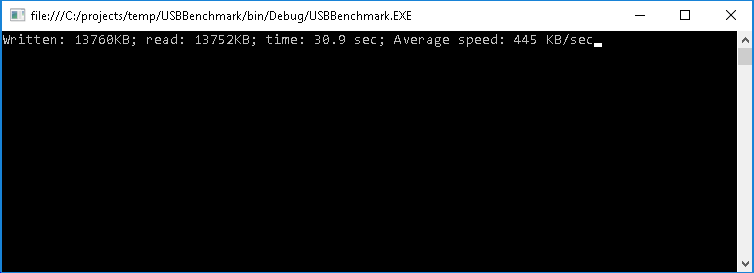
- In our measurements parallelizing reading and writing and balancing the IN/OUT packets raised the speed to 445 KB/sec (1.44x):
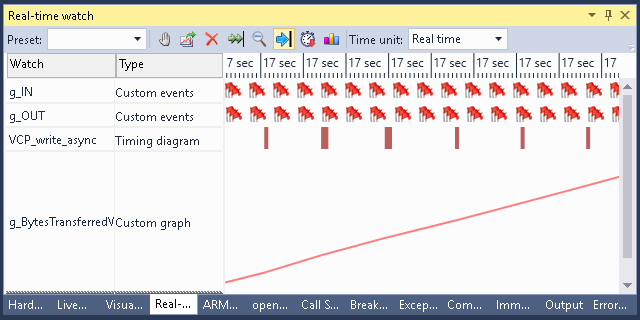
- You can also quickly check how consistent is the transfer speed over time by adding a scalar real-time watch:
int g_BytesTransferred;
ScalarRealTimeWatch g_BytesTransferredWatch;

int main(void)
{
    //...

    const int bufferSize = 4096;
    char buffer1[bufferSize], buffer2[bufferSize];
    for (int iter = 0;;iter++)
    {
        int total = 0;
        //...

        g_BytesTransferred += total;
        g_BytesTransferredWatch.ReportValue(g_BytesTransferred);

        //...

    }
}
- Adding g_BytesTransferredWatch to the real-time watch will show how quickly the amount of transferred data grows over time:
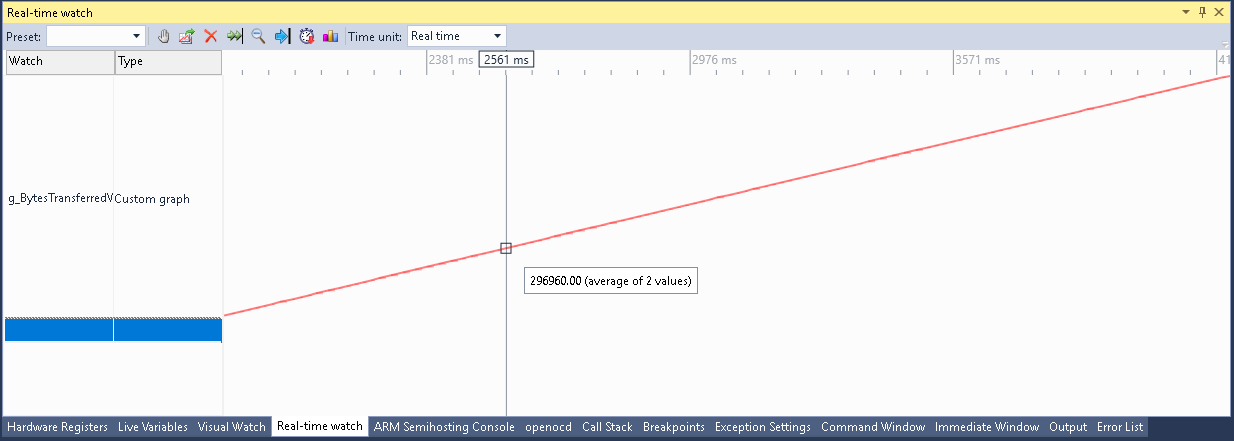 Measuring this will not introduce any significant slowdown as the real-time events will only be produced once per the 4KB block of data and VisualGDB will have plenty of time to process them without stopping your program.

