Using FreeRTOS-with Nordic nRF5x Devices
This tutorial shows how to use the FreeRTOS real-time operating system with the Nordic nRF5x devices. We will show how to create a basic project using FreeRTOS, change its configuration, view the real-time thread trace and understand the program timings by using the embedded profiler. Before you begin, install VisualGDB 5.3 or later and get the latest Nordic BSP via the VisualGDB Package Manager.
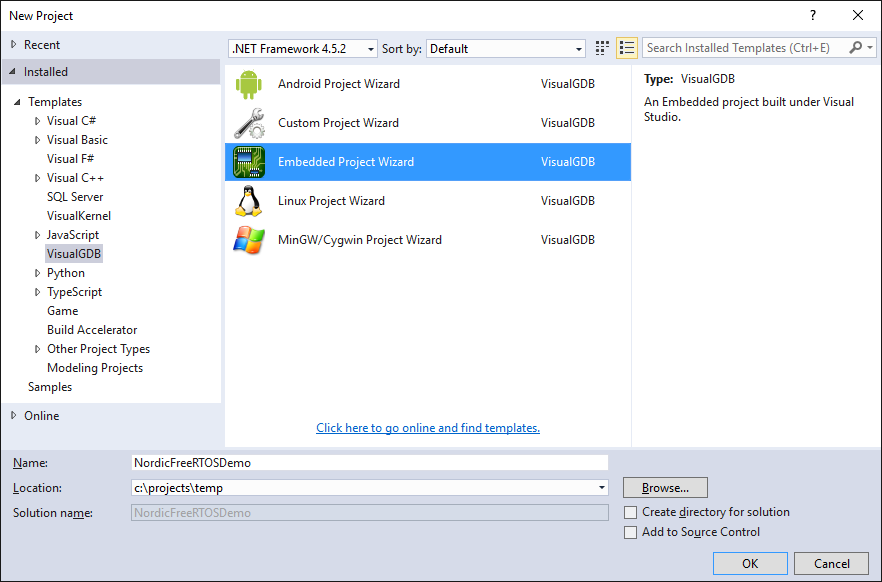
- Start Visual Studio and open the VisualGDB Embedded Project Wizard:
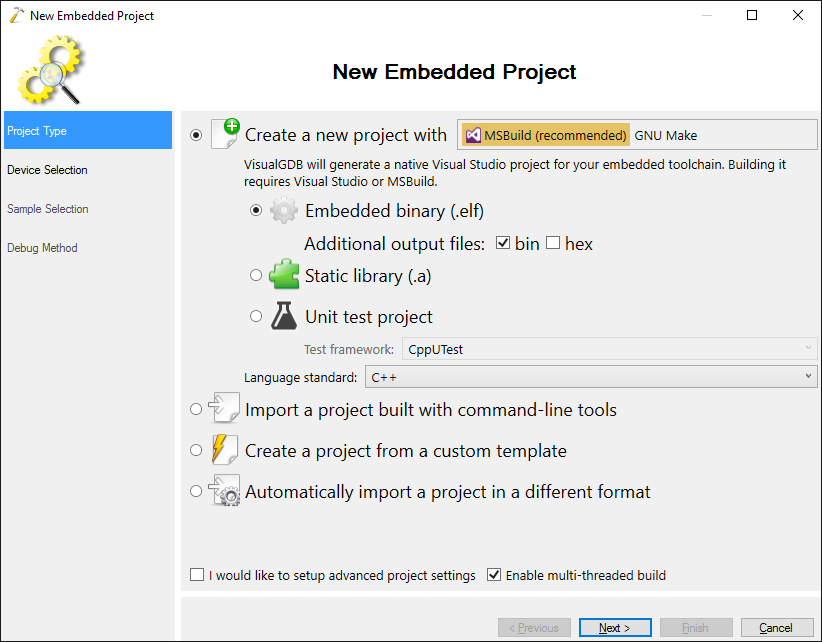
- On the first page of the wizard select “Create a new project with MSBuild” -> “Embedded Binary”:
- On the next page select your ARM toolchain and pick the Nordic device you are targeting. In this tutorial we will target the nRF52840 device:
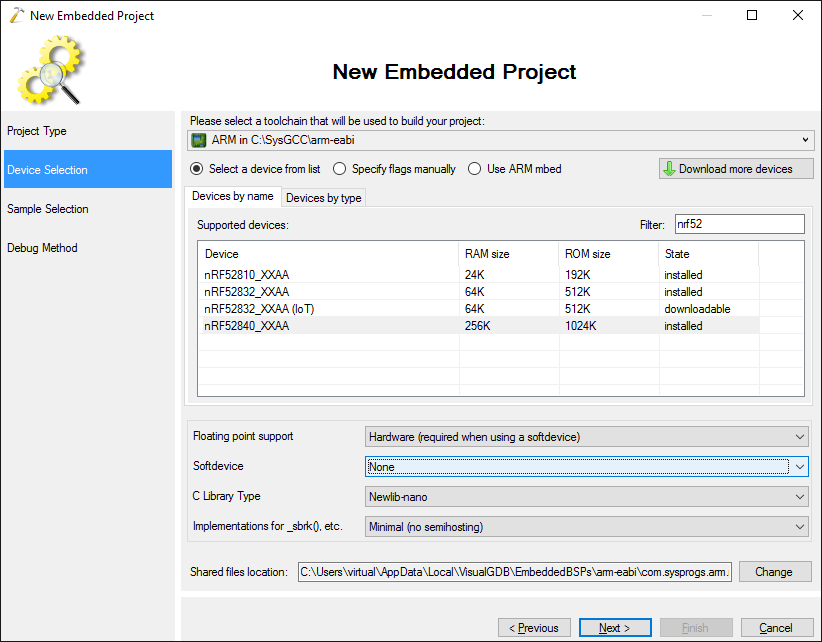 As the Nordic FreeRTOS sample does not include the necessary configuration parameters for the softdevice, select “Softdevice: None” before proceeding to the next page. You can still use FreeRTOS with softdevice-enabled projects, however you would need to ensure that they include both FreeRTOS and Softdevice configuration files.
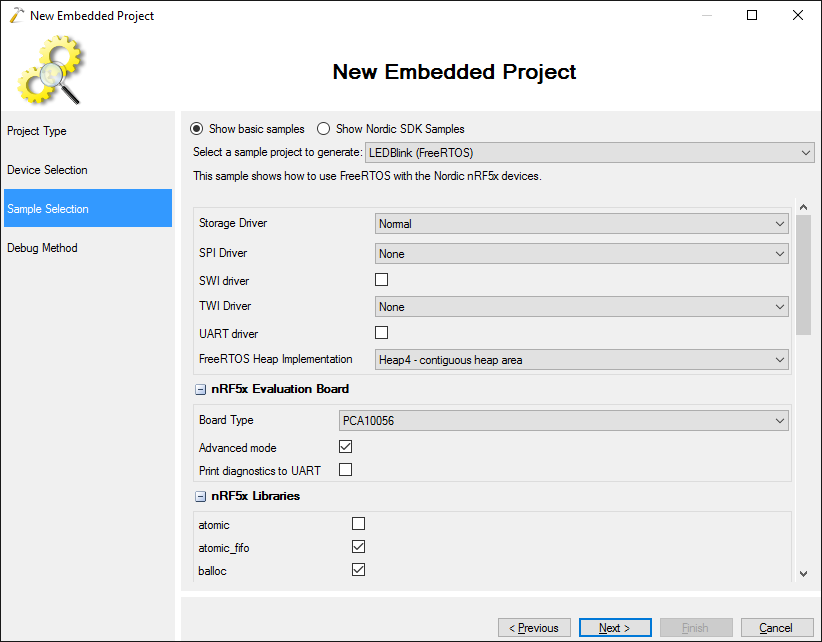
 - On the next page select “Show basic samples” and pick the LEDBlink (FreeRTOS) sample and proceed with the default configuration:
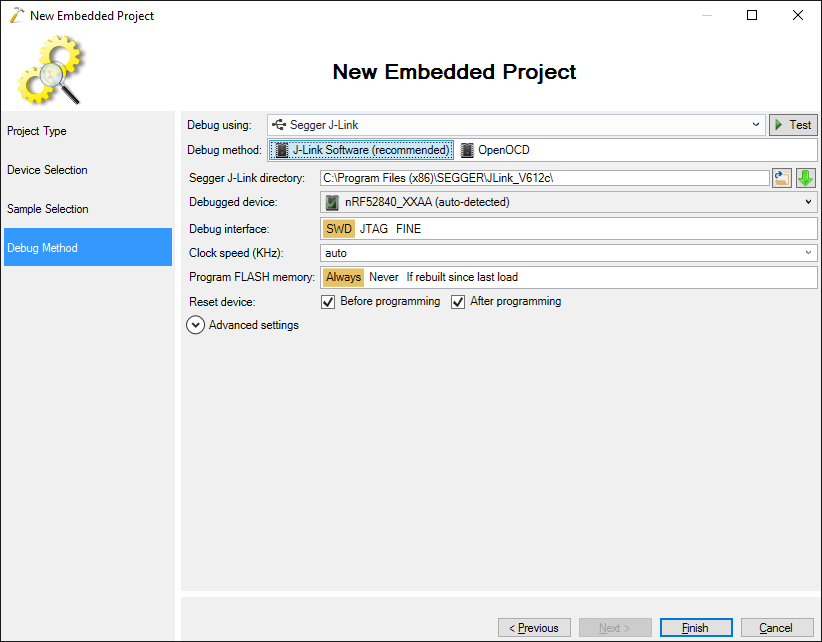
- Connect your development board to your computer. VisualGDB will automatically detect the best debug settings for the board. If you have multiple boards, or debug interfaces, select the matching one manually:
- Press “Finish” to create the project. VisualGDB will create an MSBuild-based project based on the FreeRTOS sample. Build it by pressing Ctrl-Shift-B and start debugging by pressing F5:
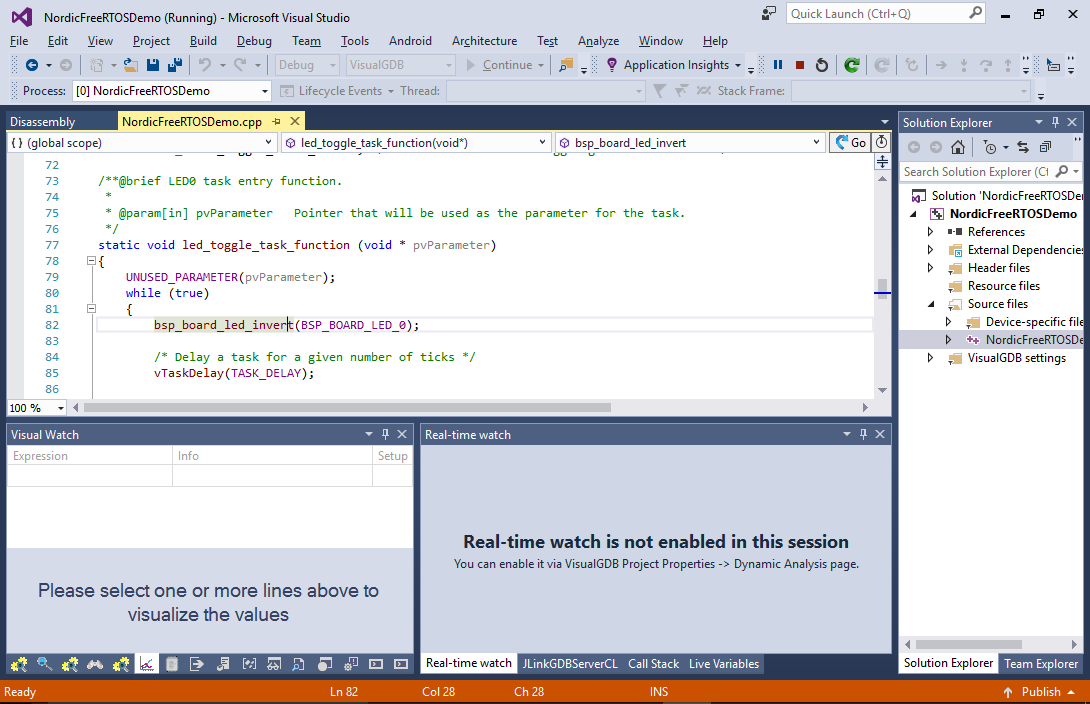
- Now we will use the RTOS analysis functionality to understand how the sample works. First of all, set a breakpoint in the led_toggle_timer_callback() function and open the Threads view once the breakpoint hits:
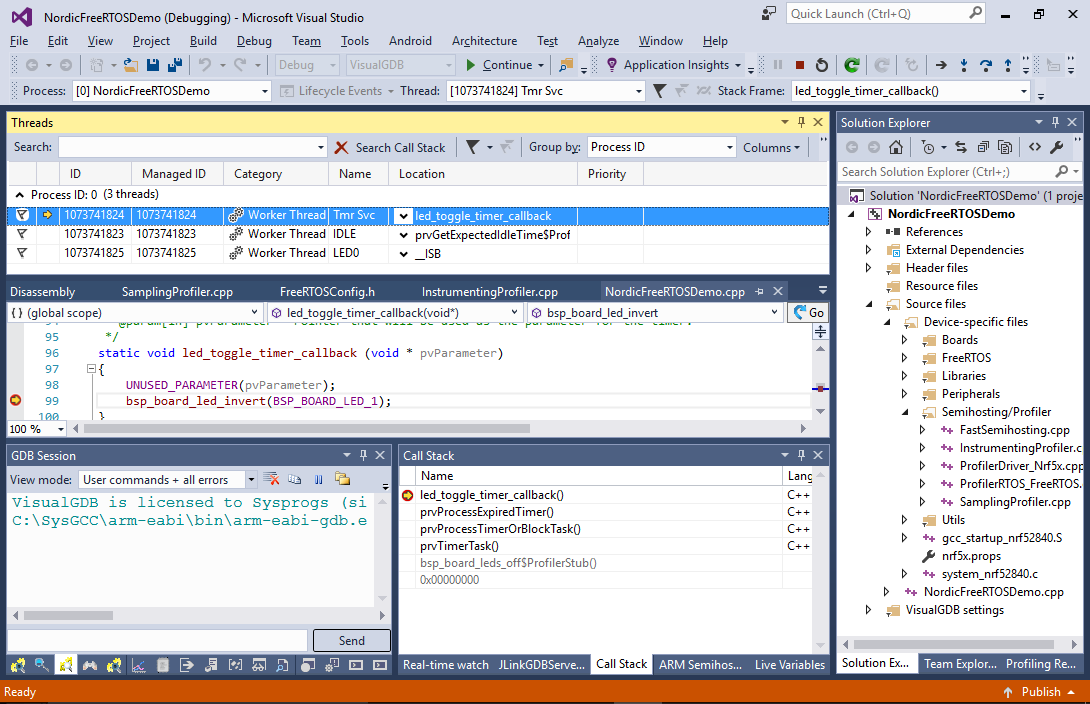 VisualGDB will show all FreeRTOS threads (and their stacks) in the Threads view.
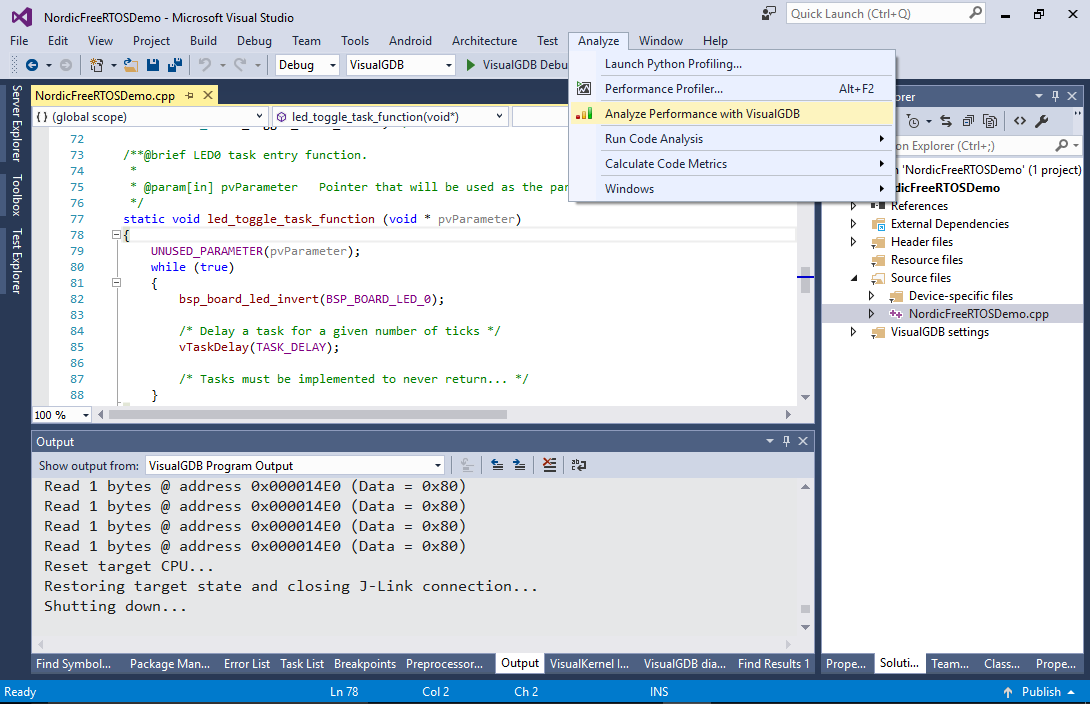
 - Now we will use the VisualGDB profiler to see which functions are called by each thread (RTOS thread view and profiling requires the Custom edition of VisualGDB). Select Analyze->Analyze Performance with VisualGDB:
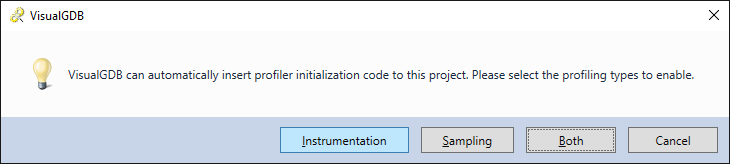
- VisualGDB profiler works by inserting the profiler framework code into your project and instrumenting the functions in your code to report their timing. This doesn’t require any extra hardware, although results in an extra overhead while profiling. First time you select “Analyze Performance with VisualGDB”, it will suggest referencing the profiler framework and preparing the code for instrumentation. Select “Instrumentation” in the message box:
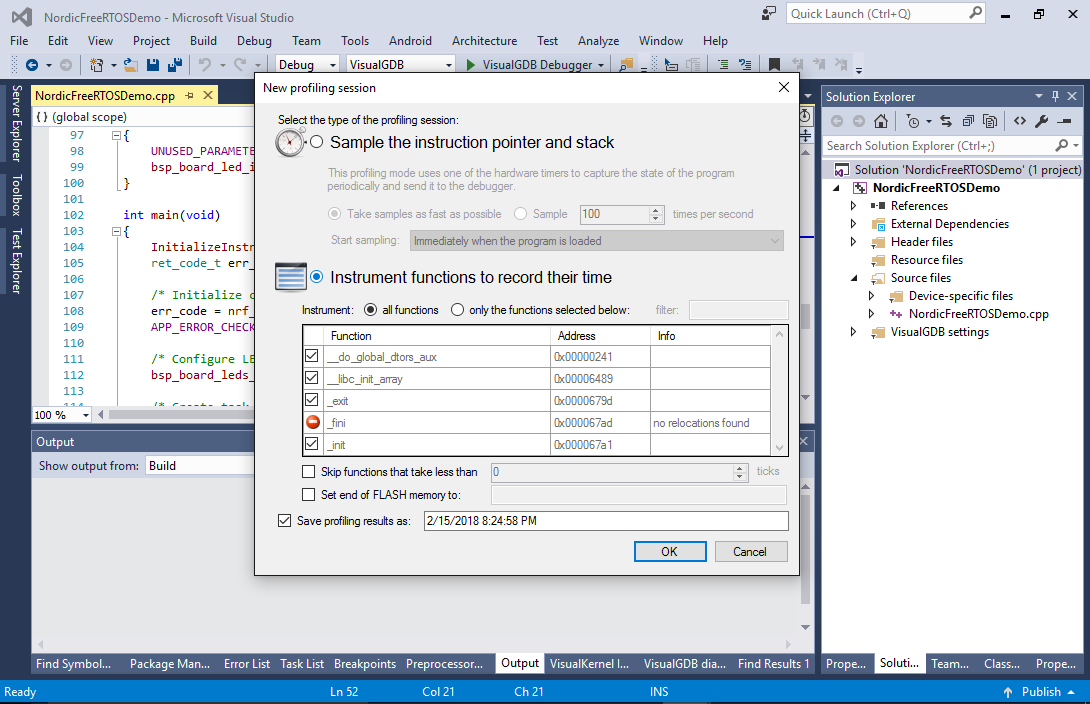
- Once the profiler framework is referenced, select “Instrument functions to record their time” and press OK:
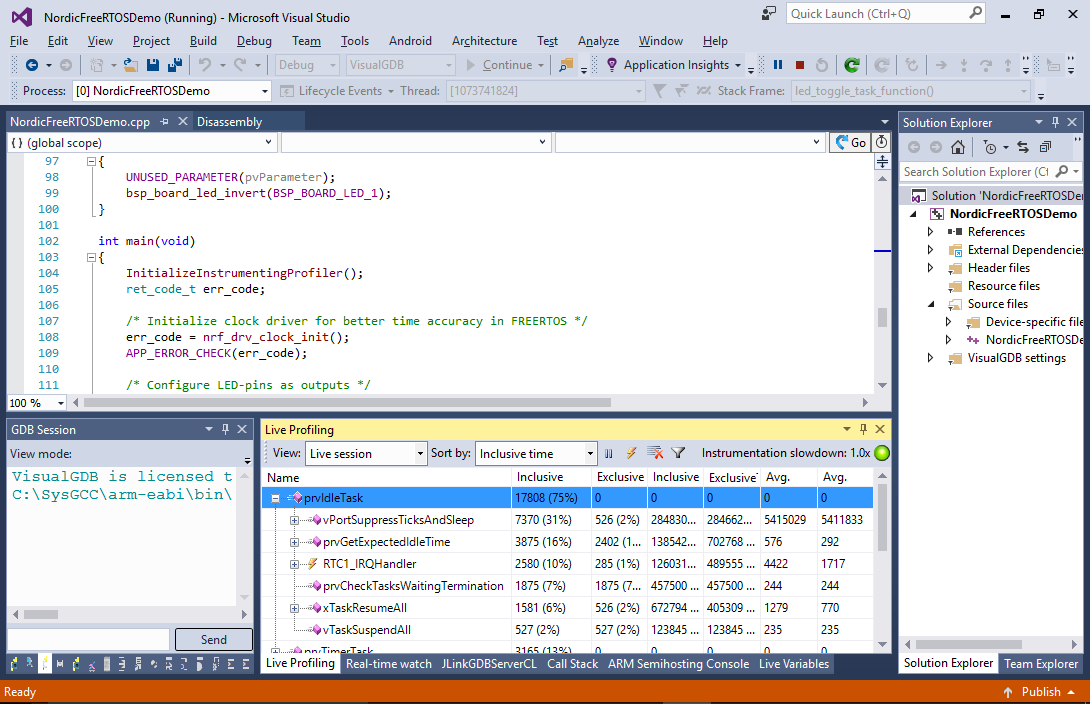
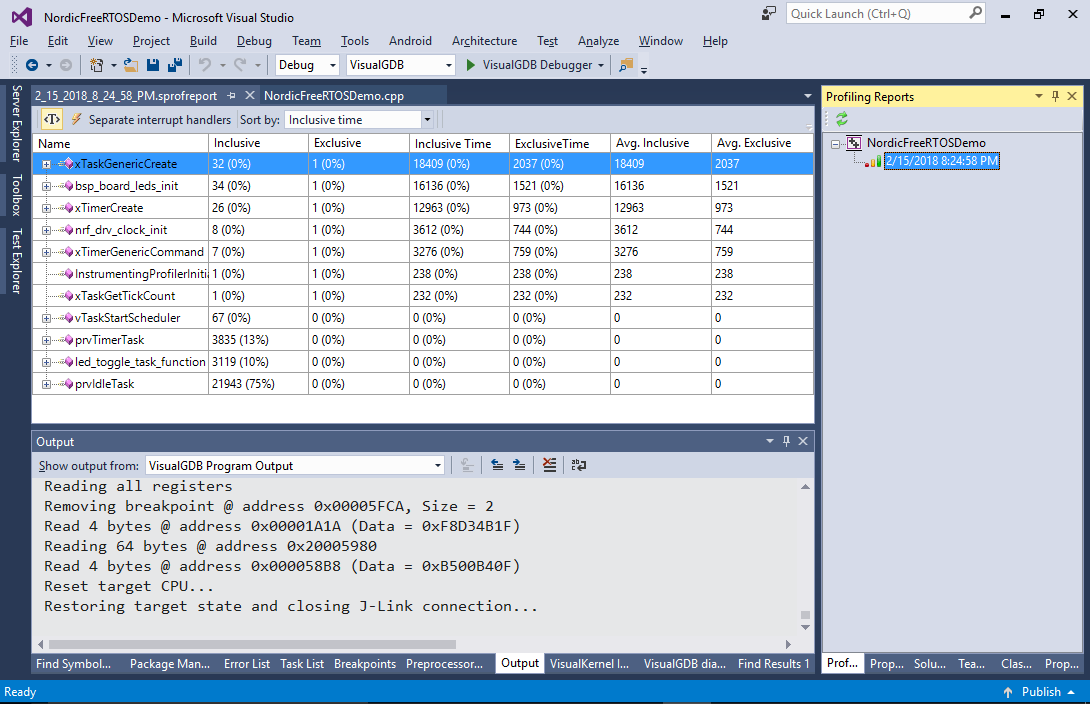
- VisualGDB will start a profiling session. Use the Live Profiling view to see the functions that are being invoked at real time. See how most of the the time is spent in the prvIdleTask:
- Once you exit a profiling session, you can use the Profiling Reports window to list and open the profiling reports from previous profiling sessions:
- Although profiling provides detailed view of your program’s internals, instrumenting each and every function results in overhead. An less intrusive way of analyzing your program’s performance would be using the real-time watch. Open VisualGDB Project Properties on the Dynamic Analysis page and enable RTOS event tracing and function tracing:
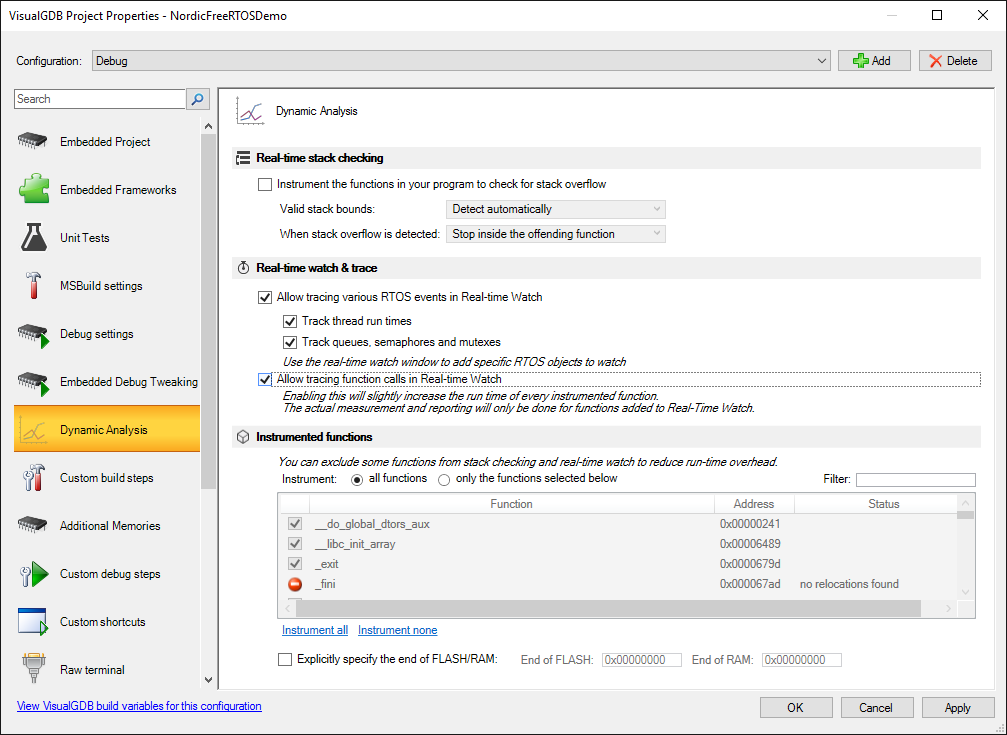 Unlike the profiling mode, functions instrumented for real-time watch will only report their actual run time to VisualGDB if you specifically add them to the real-time watch window, reducing the profiling overhead.
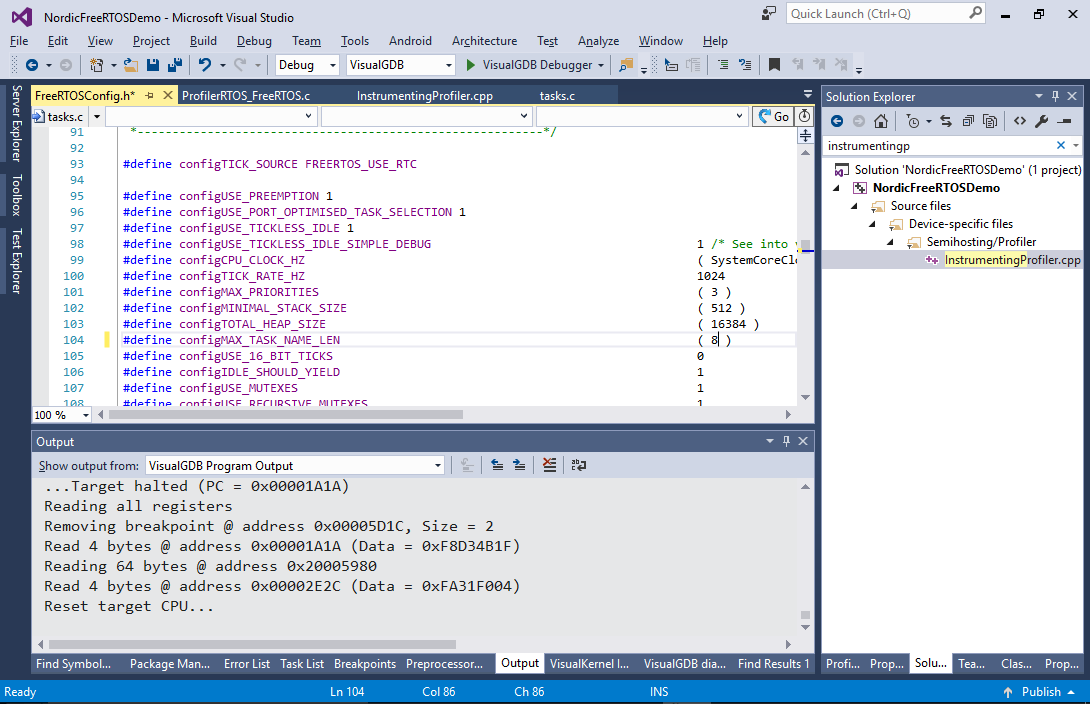
 - Before you begin the real-time watch session, we recommend increasing the MAX_TASK_NAME_LEN parameter in the FreeRTOSConfig.h file to 8 so that the thread names won’t get truncated:
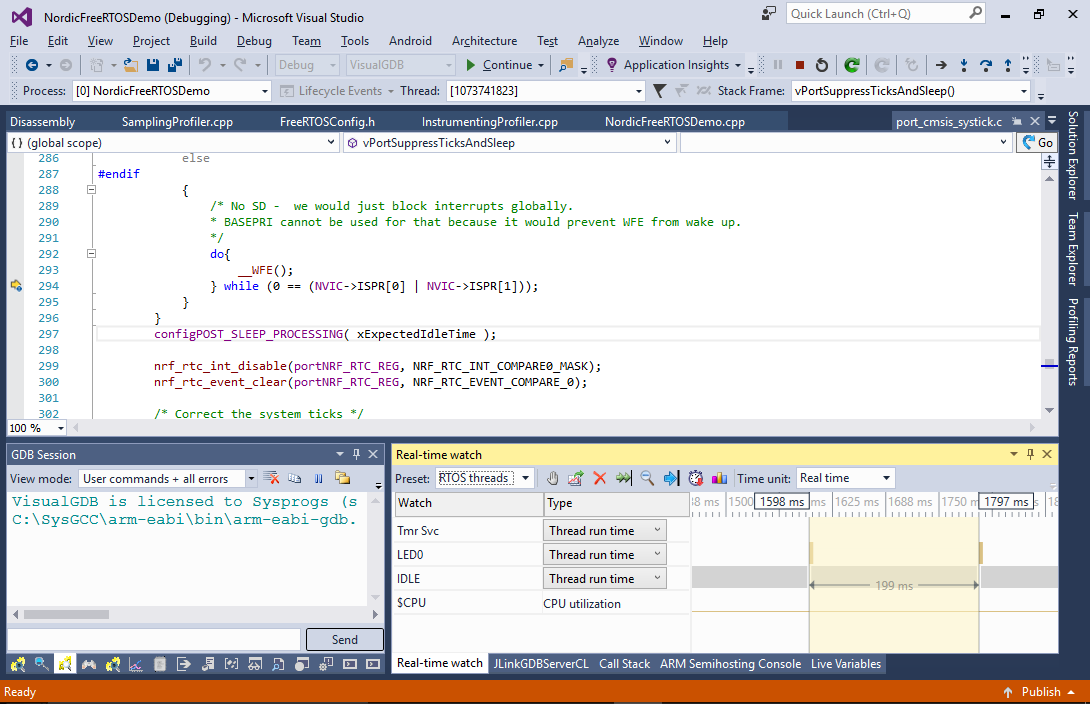
- Start debugging and select “Debug->Break All” once the LEDs start blinking. Open real-time watch, select “RTOS threads” and resume debugging. VisualGDB will show the precise timing of all 3 threads and the computed CPU utilization:

- You can use the mouse wheel to zoom the real-time watch window, and click-and-drag to measure distances between events:
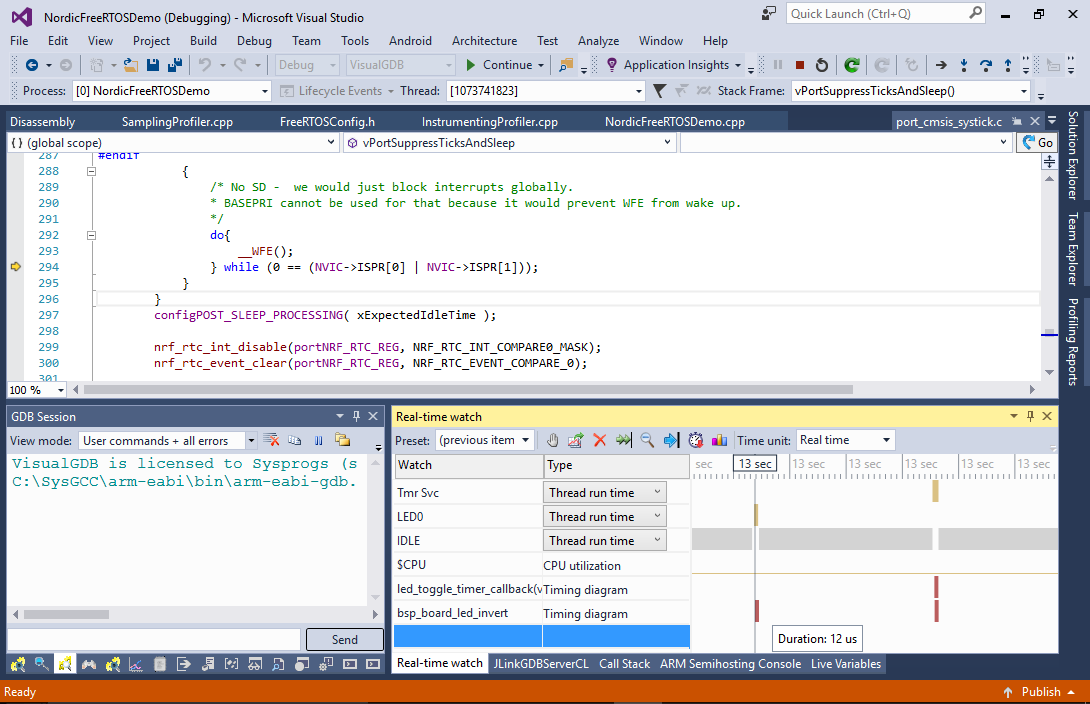
- Real-time watch also allows measuring run times of specific functions. Add the led_toggle_timer_callback() and bsp_board_led_invert functions to the real-time watch list and resume your program. VisualGDB will show their riming. E.g. you can see that bsp_board_led_invert is called by both the timer thread and the LED0 thread:
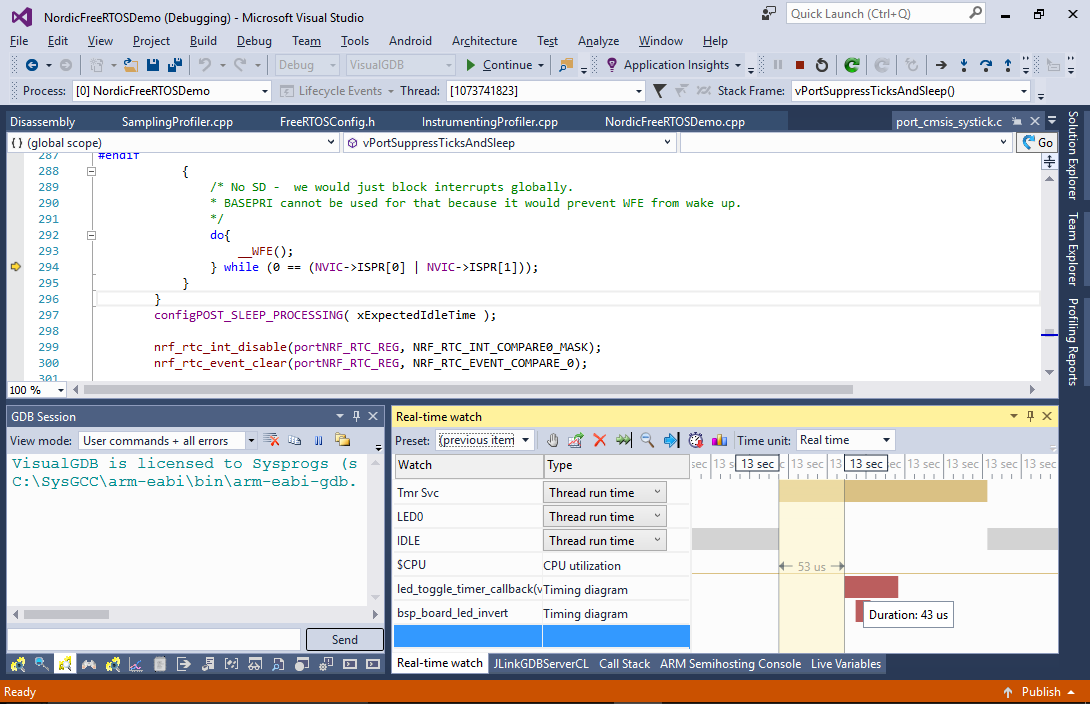
- Zoom into the invocation of bsp_board_led_event to measure the time between different events (e.g. between switching to the Tmr Svc thread and actually invoking the function):
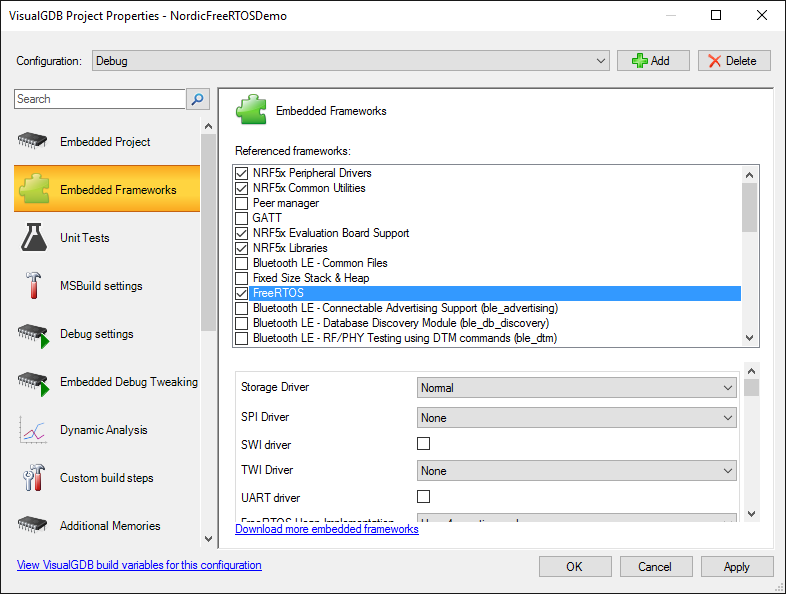
- You can add a reference to FreeRTOS for an existing project by using the Embedded Frameworks page of VisualGDB Project Properties: