Using Live Coverage to Watch Embedded Code in Real Time
This tutorial shows how to use Live Coverage to debug embedded projects in a non-intrusive way. Live Coverage allows observing the execution of functions and specific branches in your program in real-time, without having to stop the program. Live Coverage is much faster than the instrumentation-based profiling, as it doesn’t need to communicate every function call to the debugger. Instead it works by storing counters for functions and individual branches in RAM, and using VisualGDB’s live memory engine to read them while the program is running.
Before you begin, install VisualGDB 5.5 or later.
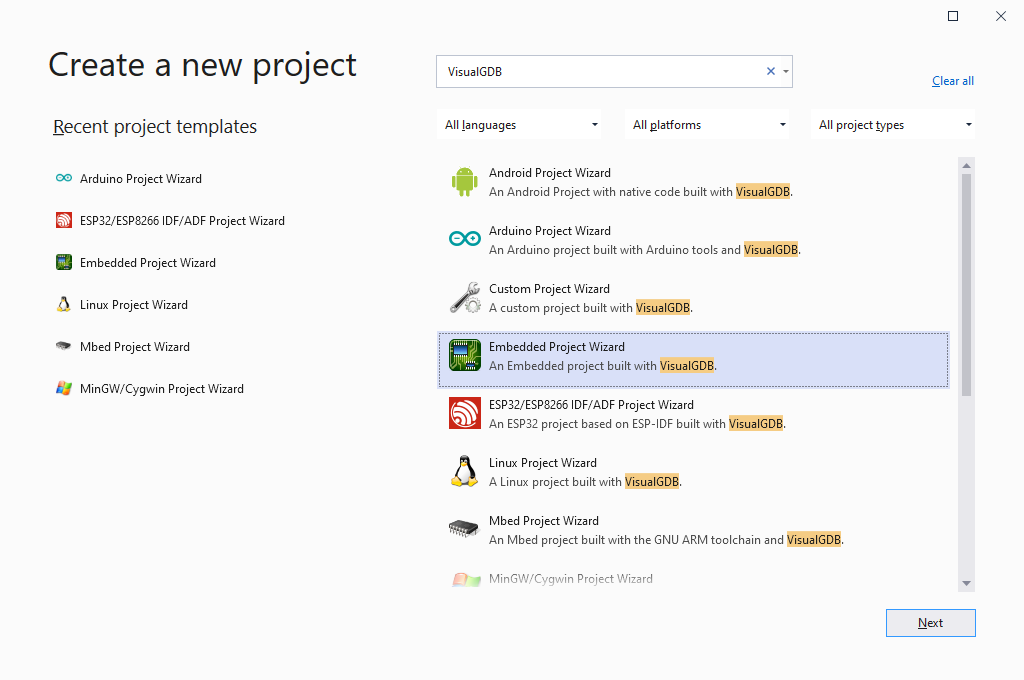
- Start Visual Studio and locate the VisualGDB Embedded Project Wizard:
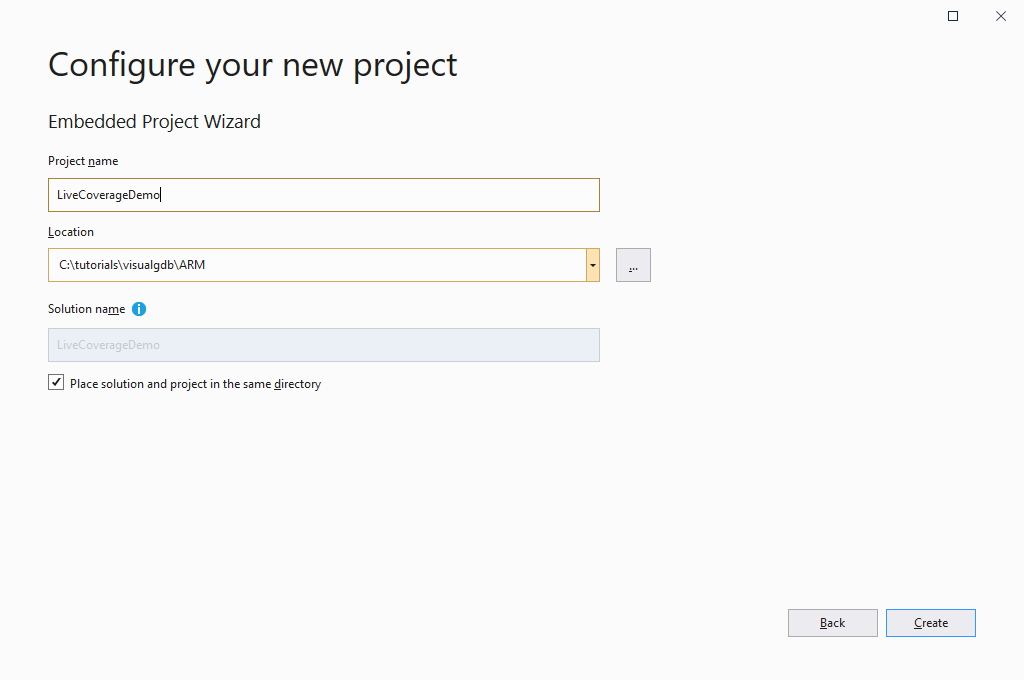
- Enter the name and location of the project you are creating:
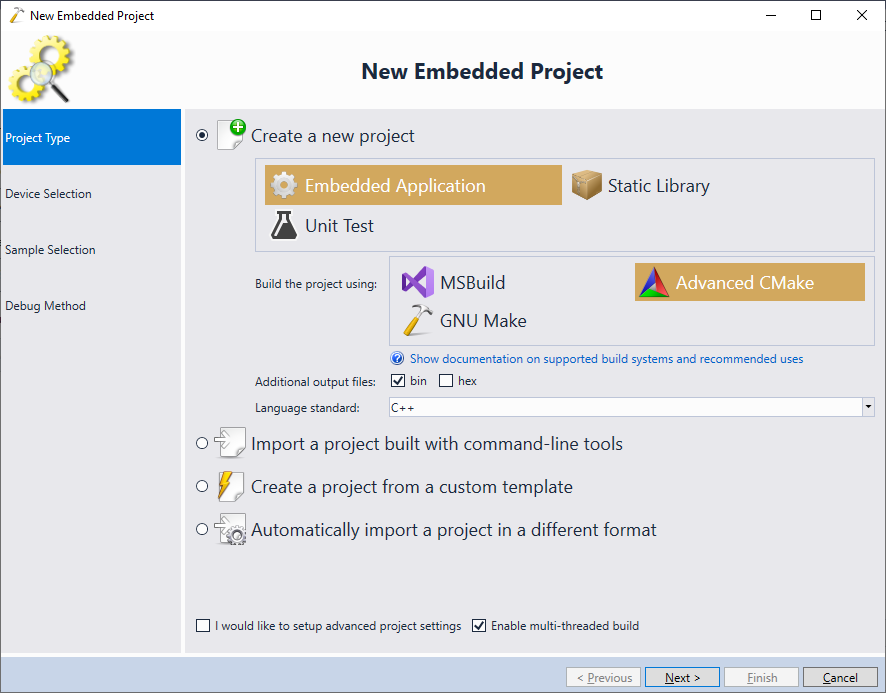
- In this tutorial we will create a new project for a basic USB device from scratch, and will then show how to enable Live Coverage. Select “Create a new project -> Embedded Application” on the “Project Type” page of the wizard. Although Live Coverage does not require a specific build subsystem, we recommend using it with Advanced CMake, as this project type provides convenient commands for managing coverage settings via Solution Explorer:
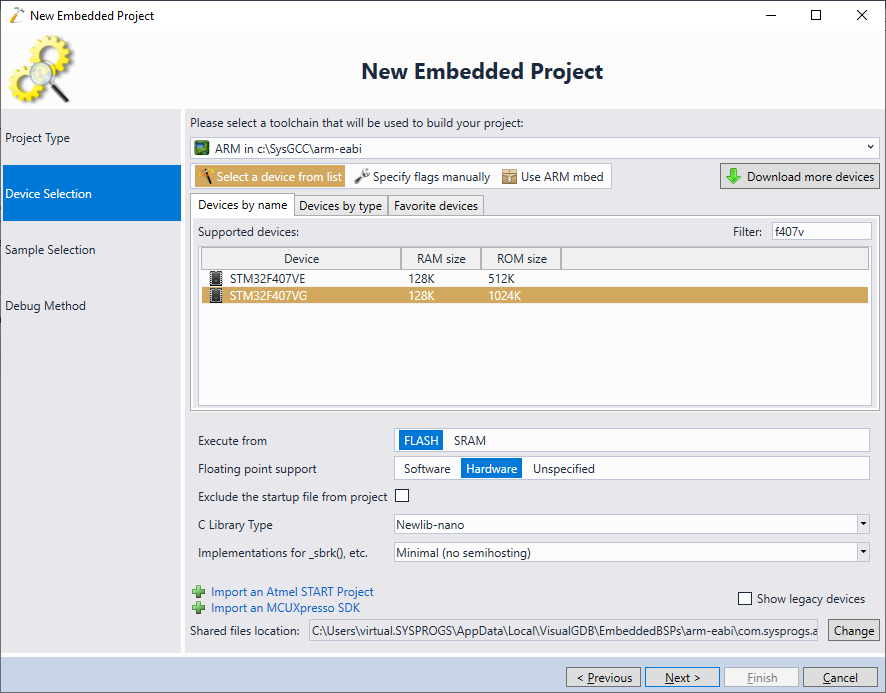
- On the next page select your toolchain and device, then click “Next”. In this tutorial we will use the STM32F407Discovery board, however Live Coverage will work with any ARM device that supports background memory reads:
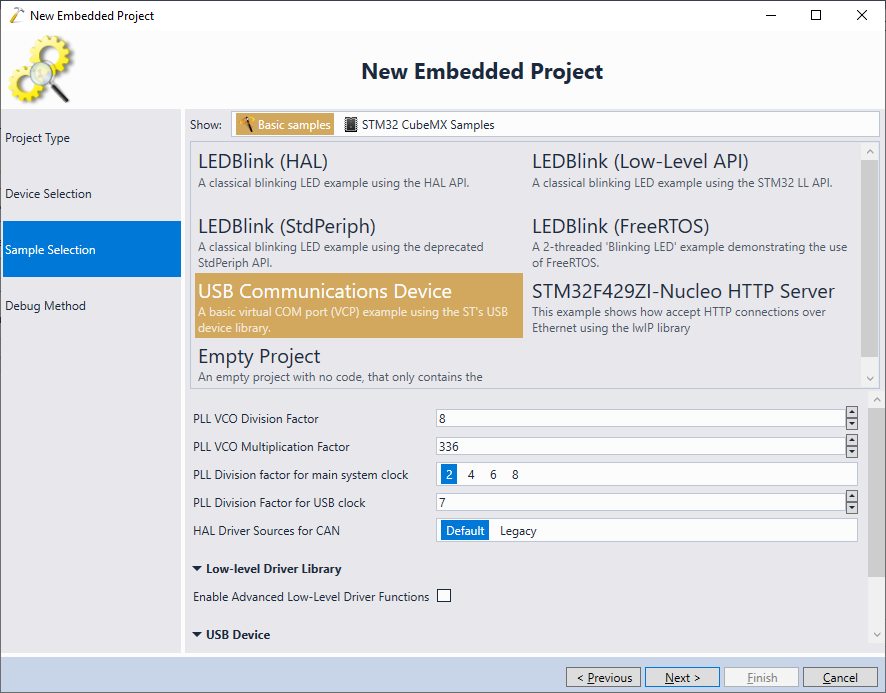
- In this tutorial we will use the “USB Communications Device” sample to demonstrate how coverage works for frequently executed functions. However, you can also choose any other sample, including FreeRTOS-based ones:
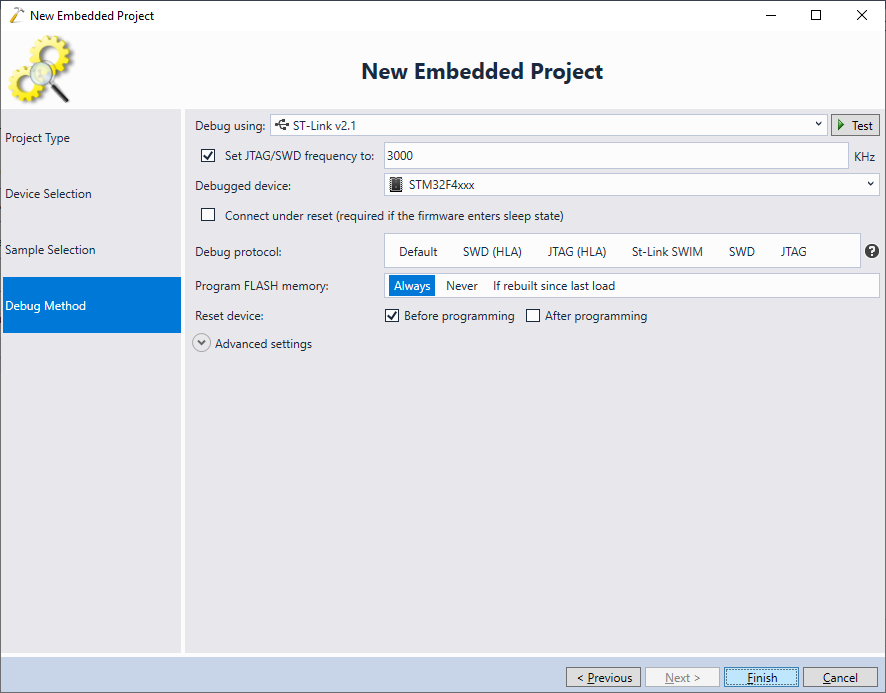
- Finally, choose the debug settings that work with your board and click “Finish” to create the project:
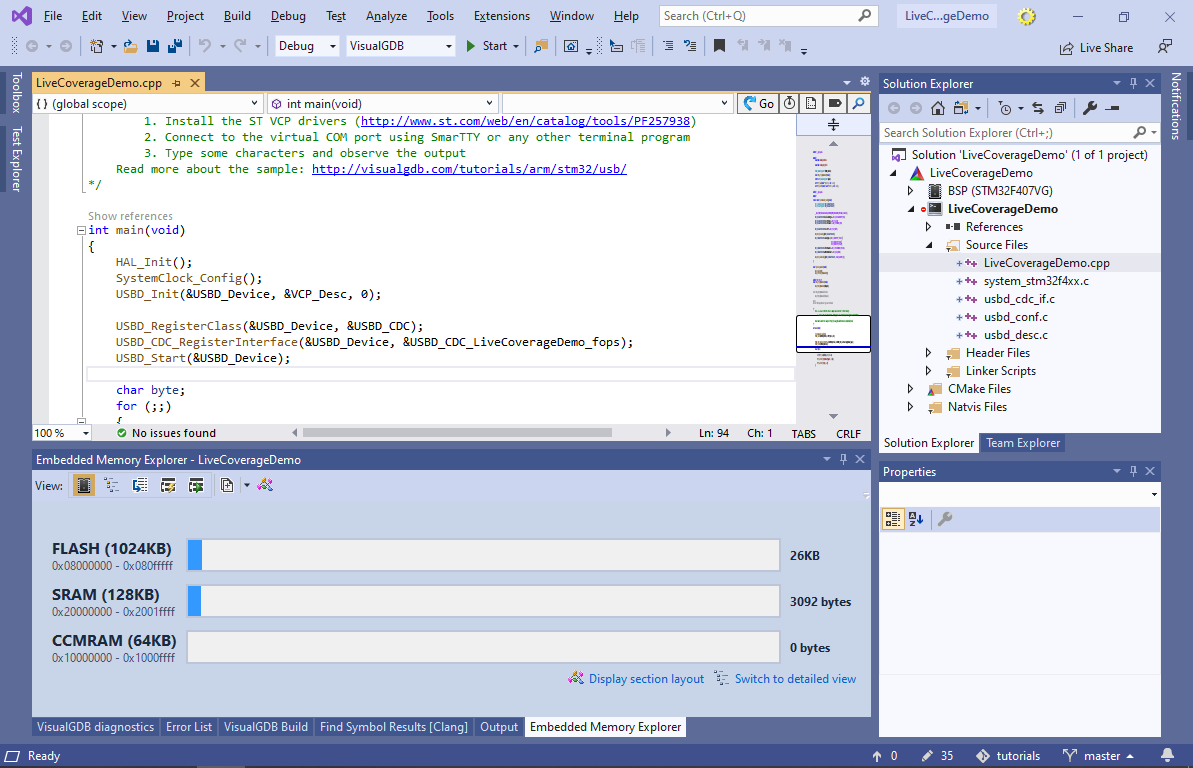
- Before we enable code coverage for the project, build it via Build->Build Solution and open Embedded Memory Explorer. This will make sure VisualGDB remembers the initial memory footprint of the project as a baseline, allowing to measure the memory overhead of enabling the code coverage:
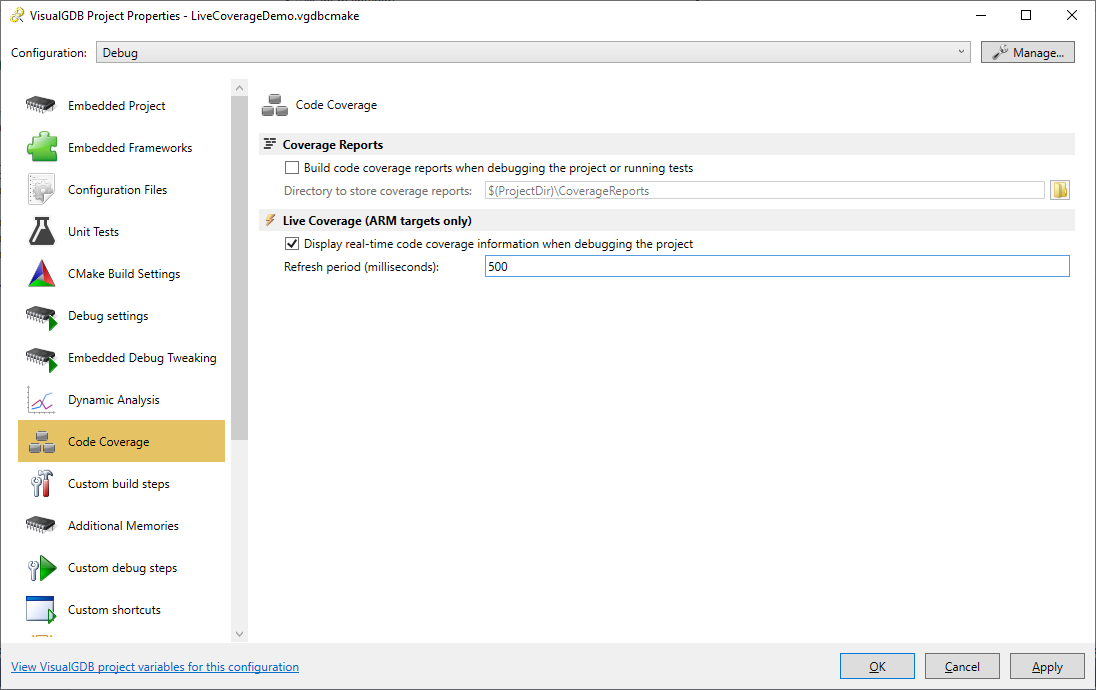
- Open VisualGDB Project Properties and enable Live Coverage on the Code Coverage page:
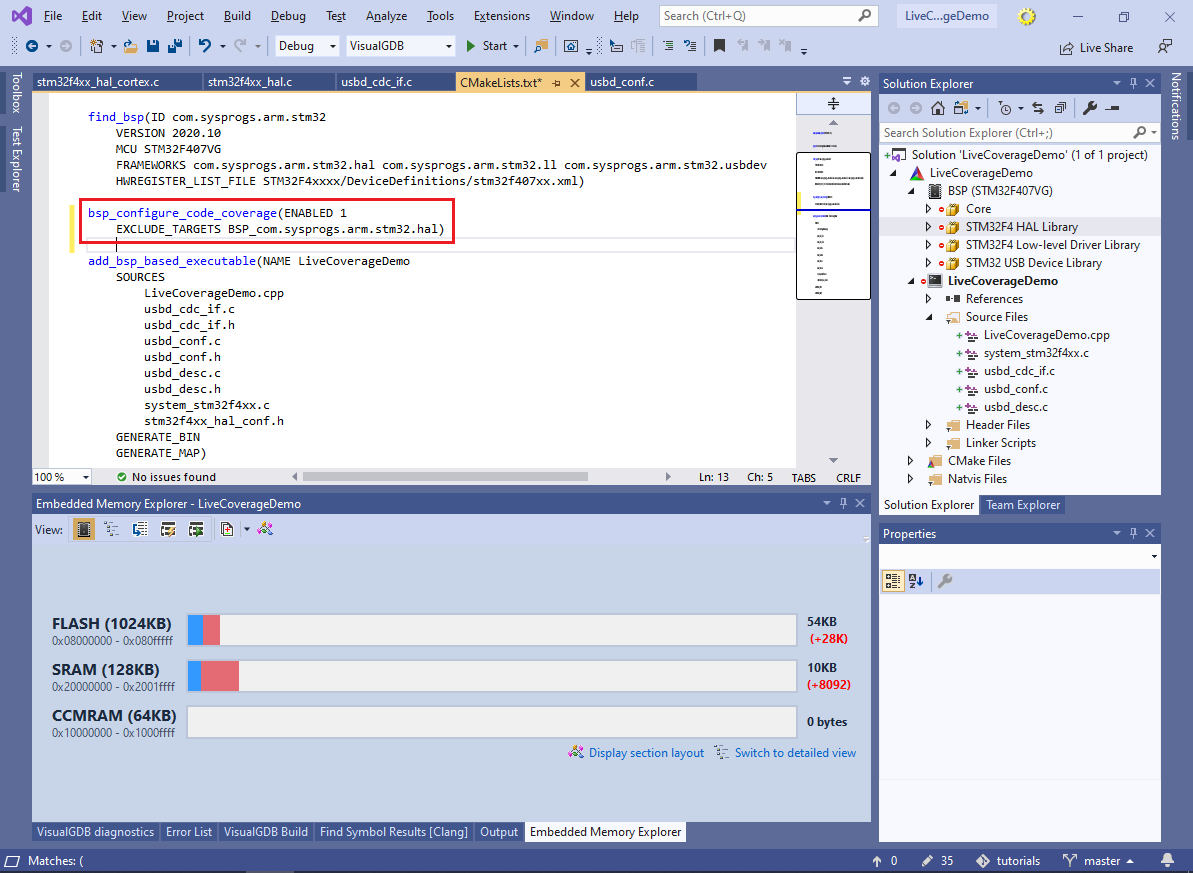
- VisualGDB will automatically insert the bsp_configure_code_coverage() statement into CMakeLists.txt, enabling code coverage for all targets using the primary BSP. For MSBuild-based projects, VisualGDB will instead enable the MSBuild-level “Instrument for Code Coverage” setting (see our Embedded Code Coverage tutorial). Build the project and observe the memory overhead in Embedded Memory Explorer:
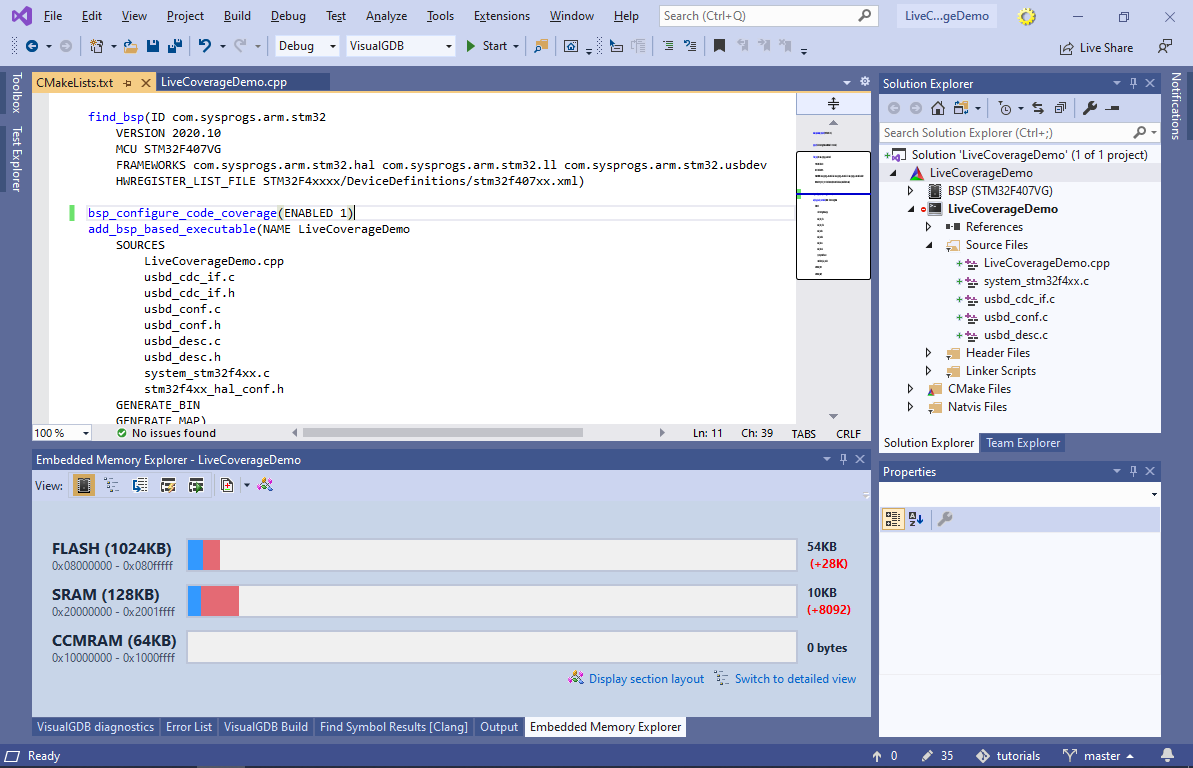 The overhead is proportional to the amount of branches in the instrumented code. We will show how to considerably reduce it by de-instrumenting specific files and libraries later in the tutorial.
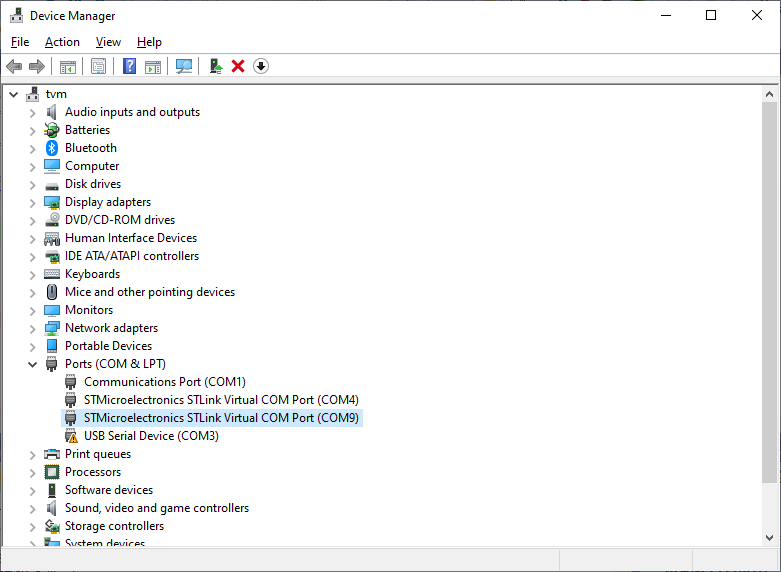
 - Start the project without debugging. If you are using the USB Device sample, connect the secondary USB port of your development board to the computer. If the default Windows 10 driver for the USB COM port does not recognize the board, try explicitly installing the ST Virtual COM Port driver shipped with the ST-Link tool:
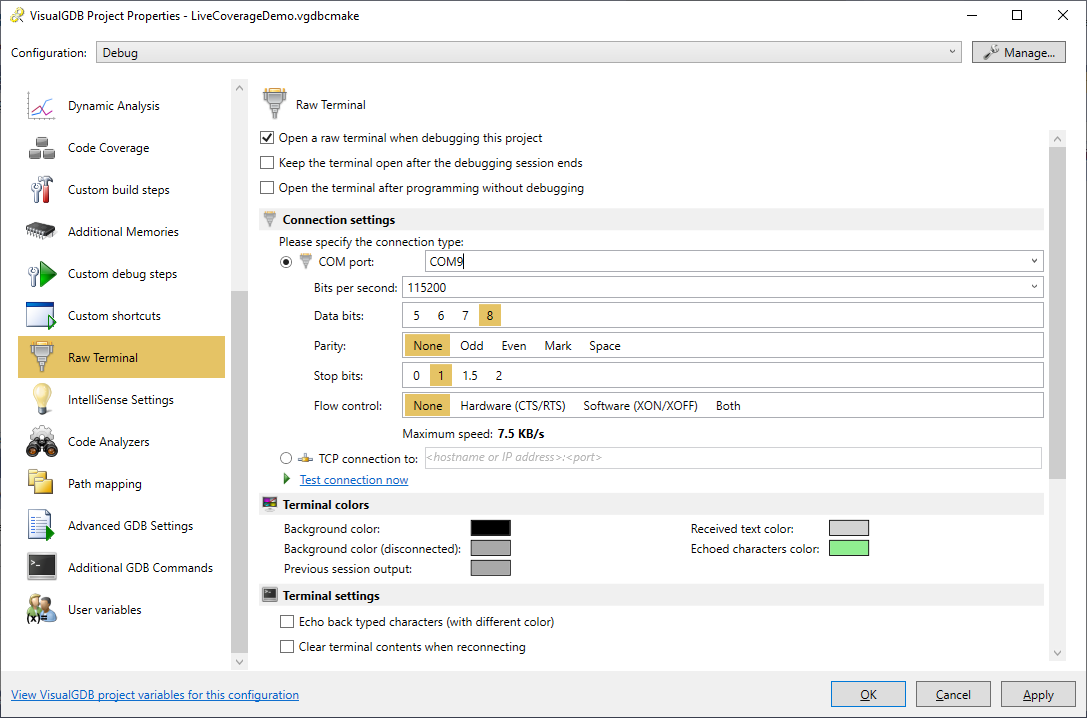
- Enable the Raw Terminal on the virtual COM port created by the board via VisualGDB Project Properties -> Raw Terminal:
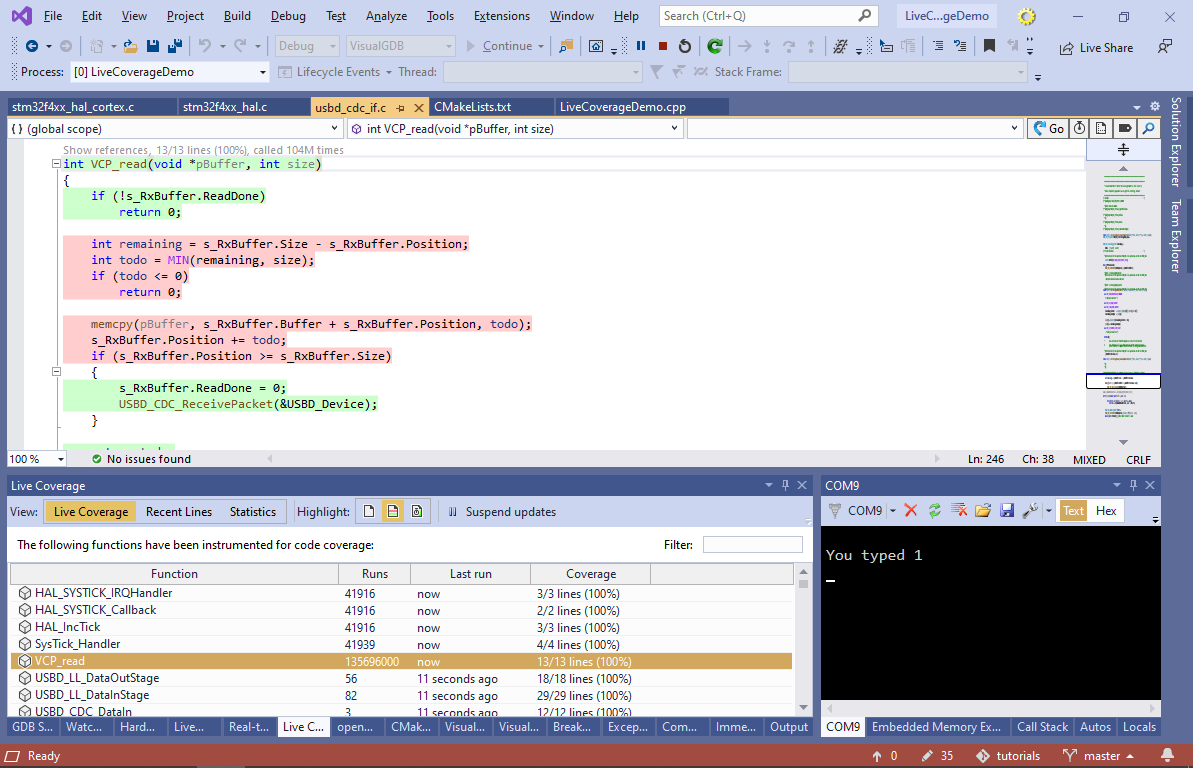
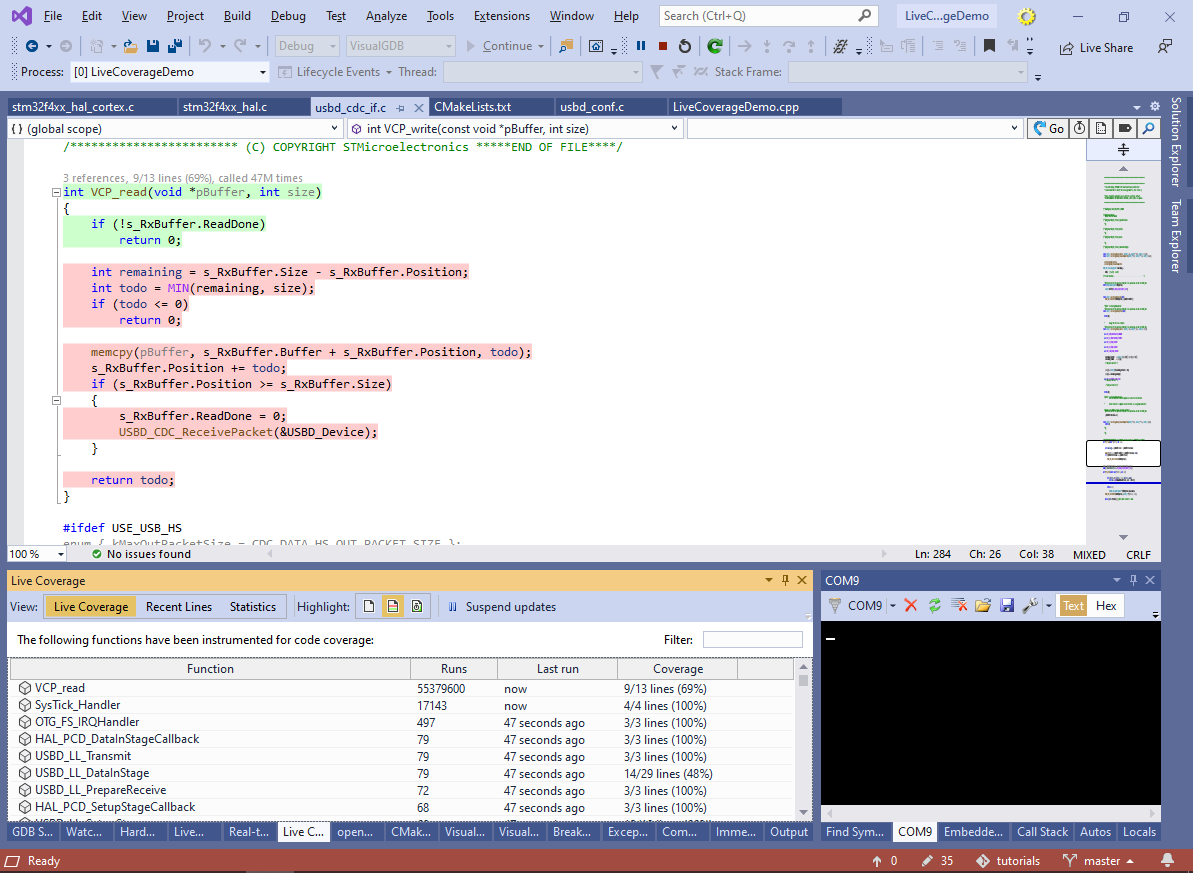
- Now we are ready to debug the code. Press F5 to launch the debugging session and observe the Live Coverage window. It will show all functions instrumented for code coverage, with detailed line-by-line information. Enable the coverage highlighting (requires using Clang IntelliSense) and go to the VCP_read() function:
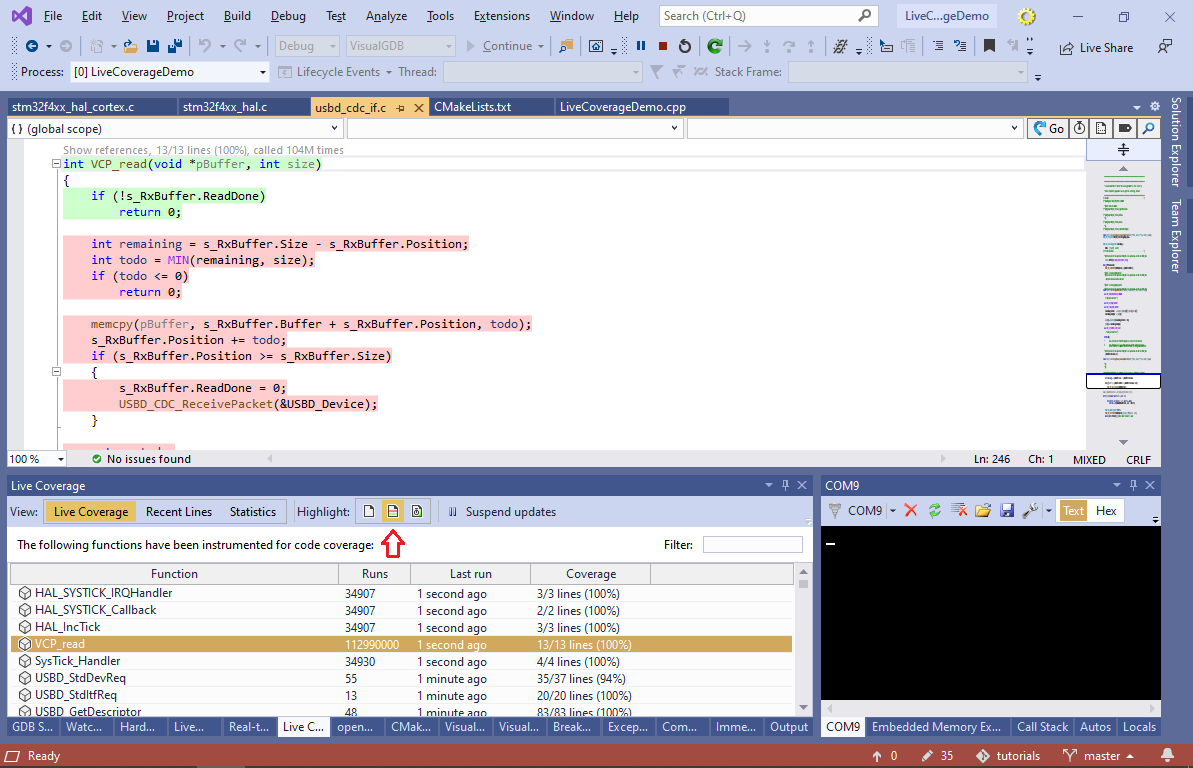 VisualGDB will show that the VCP_read() function has been called many times, but never executed past the initial check for ReadDone.
 - Type ‘1’ in the COM port window in Visual Studio. The coverage for VCP_read() will change:
 Note that because VCP_read() is continuously called by the loop in main(), VisualGDB will often capture the branch counters just as the function is executing the “ReadDone” check. This may sometimes confuse the gcov tool, marking the next branch (starting with “int remaining = …” line) as not covered. This will only affect the branch that was executing just at the time of memory read and will not have a cumulative effect. Hence unless the code spends most of the time in a single location, this will not cause any observable effects.
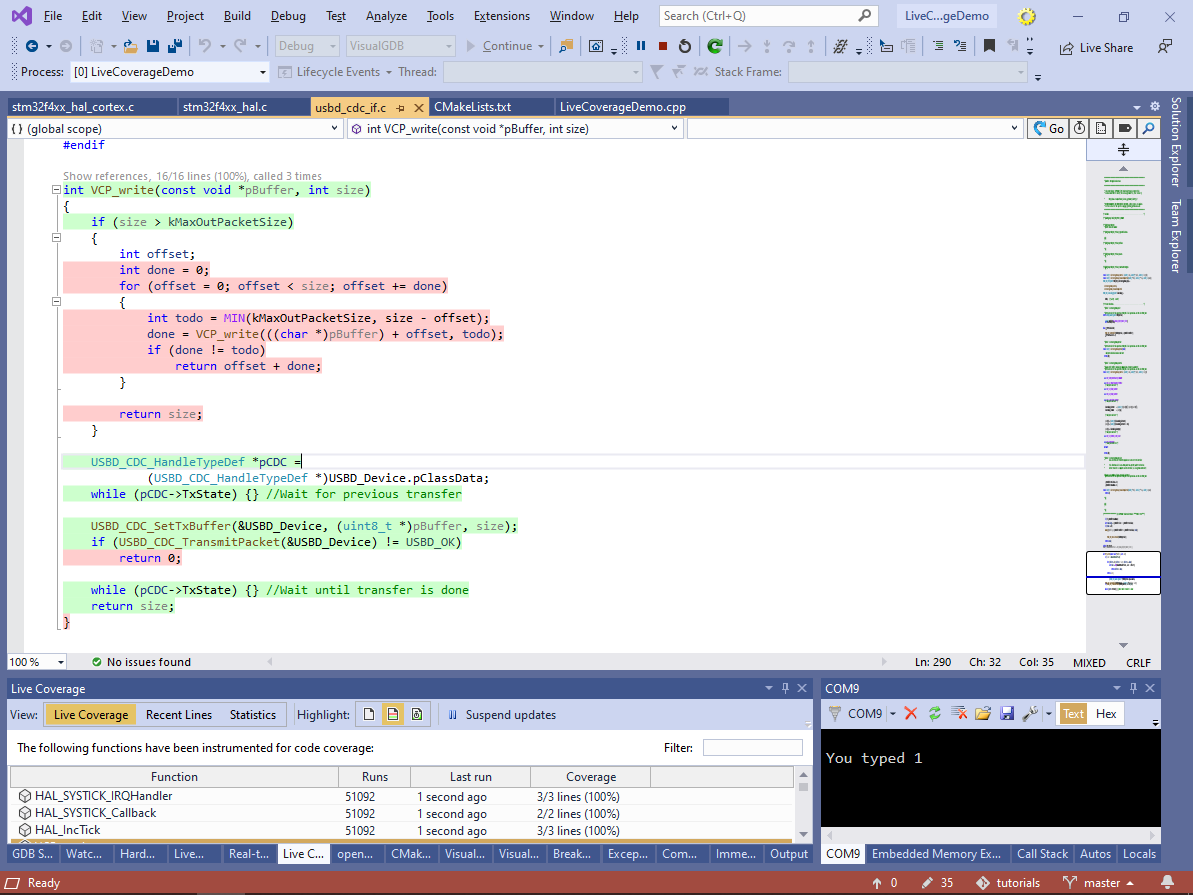
 - Go to the VCP_write() function. The coverage will accurately show that USBD_CDC_TransmitPacket() never failed and that a buffer exceeding kMaxOutPacketSize was never passed to VCP_write():
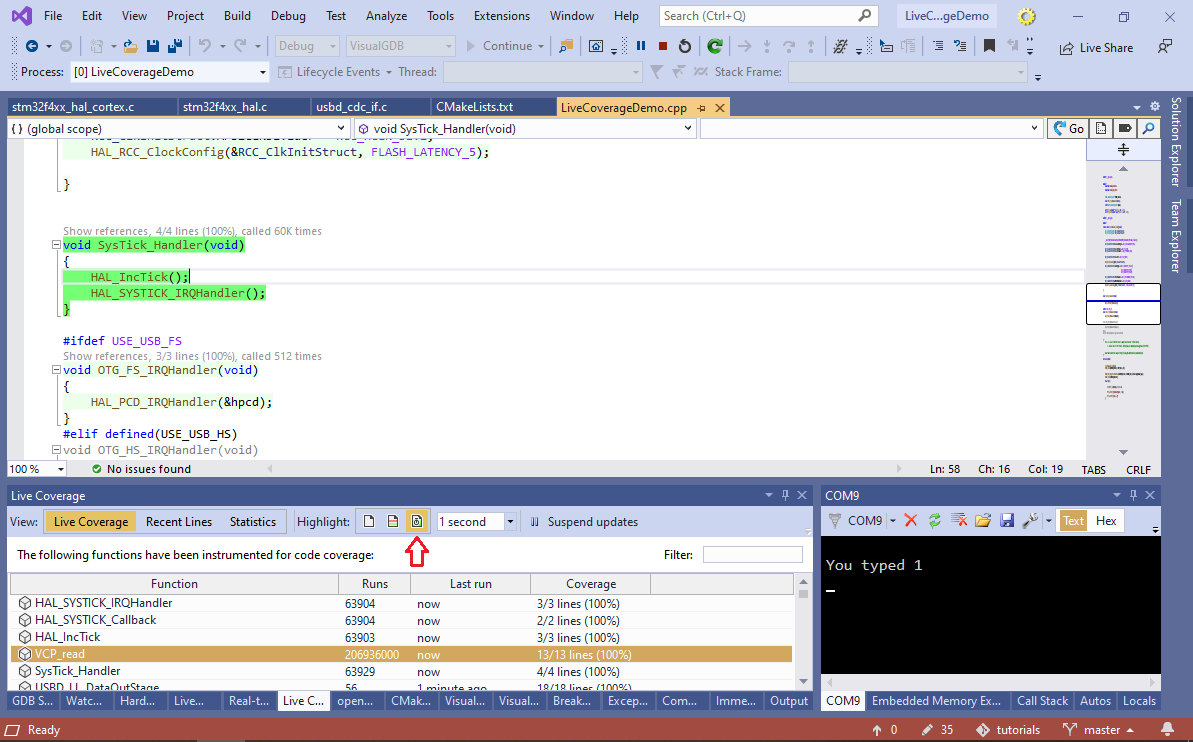
- Try switching the coverage highlighting to “Recently executed code” mode. It will highlight recently taken branches with a brighter color, making it easier to track what the program is doing in real time:
- You can also use Live Coverage to see what code executed as you stepped over a function, or between breakpoints. Set a breakpoint on a call to VCP_write() and wait for it to trigger:
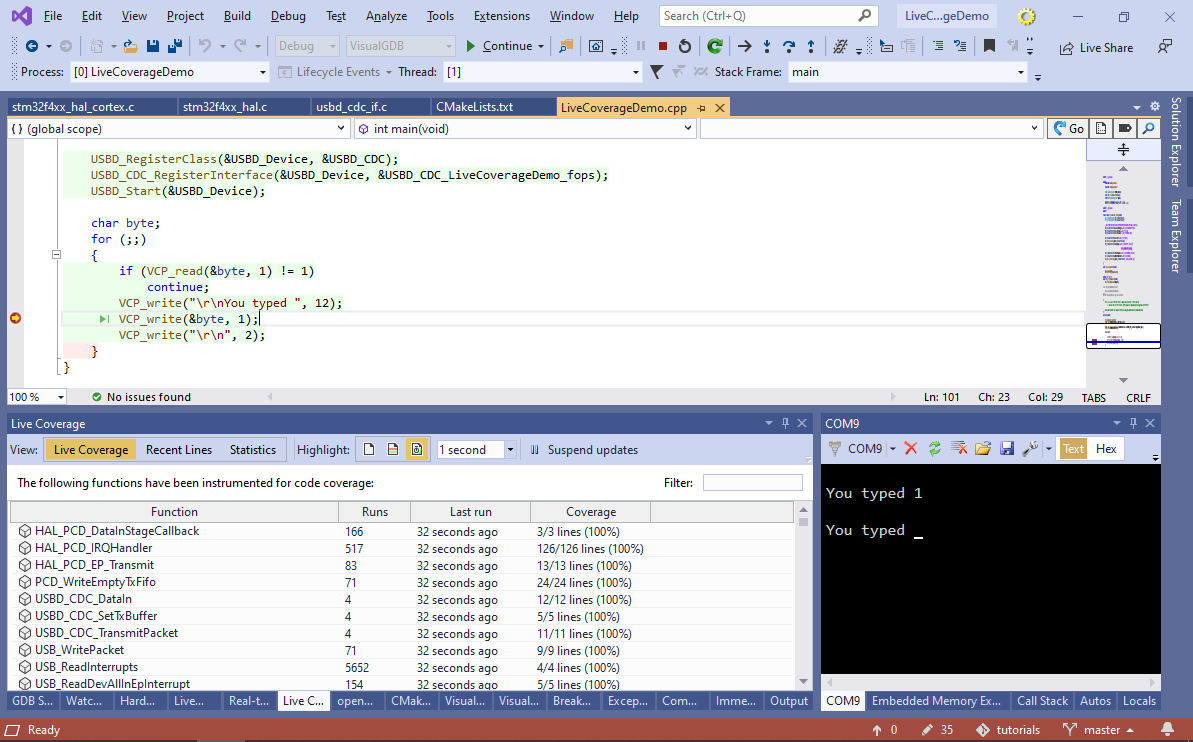
- Press F10 to step over the call to VCP_write() and switch Live Coverage to Recent Lines view:
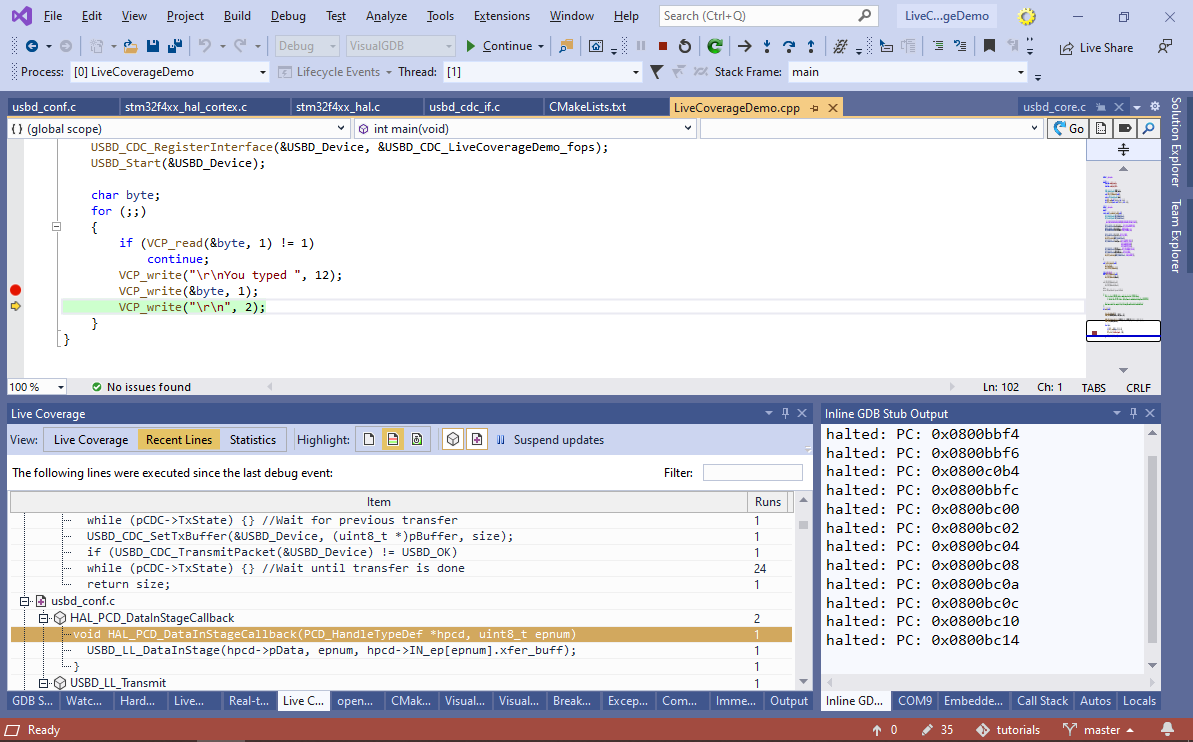
- VisualGDB will highlight all lines that executed during that step. Try double-clicking on the HAL_PCD_DataInStageCallback() line in the Live Coverage window, then select USBD_LL_DataInStage() and click “Go to Definition”. You will easily see which parts of USBD_LL_DataInStage() were executed this time without the need to step through it:
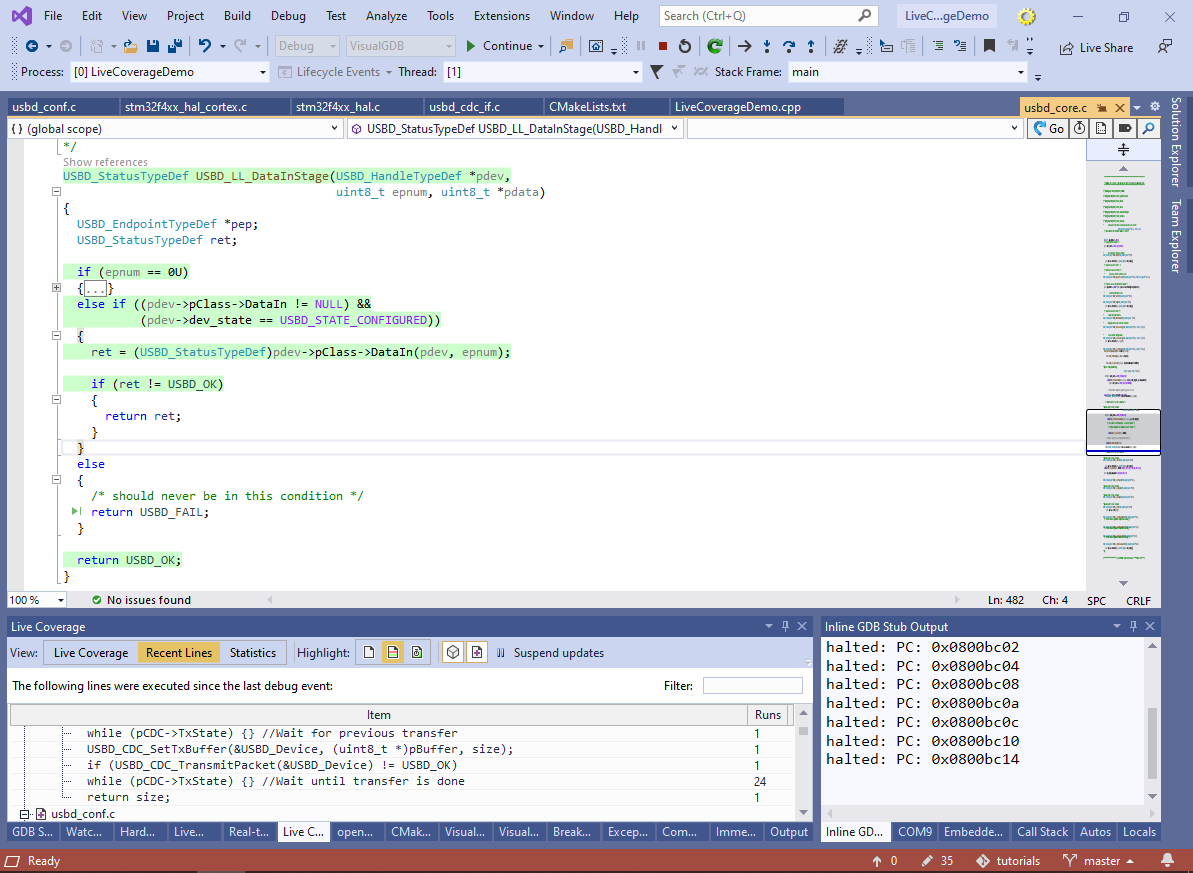 This could be useful for quickly understanding what part of a function caused an error.
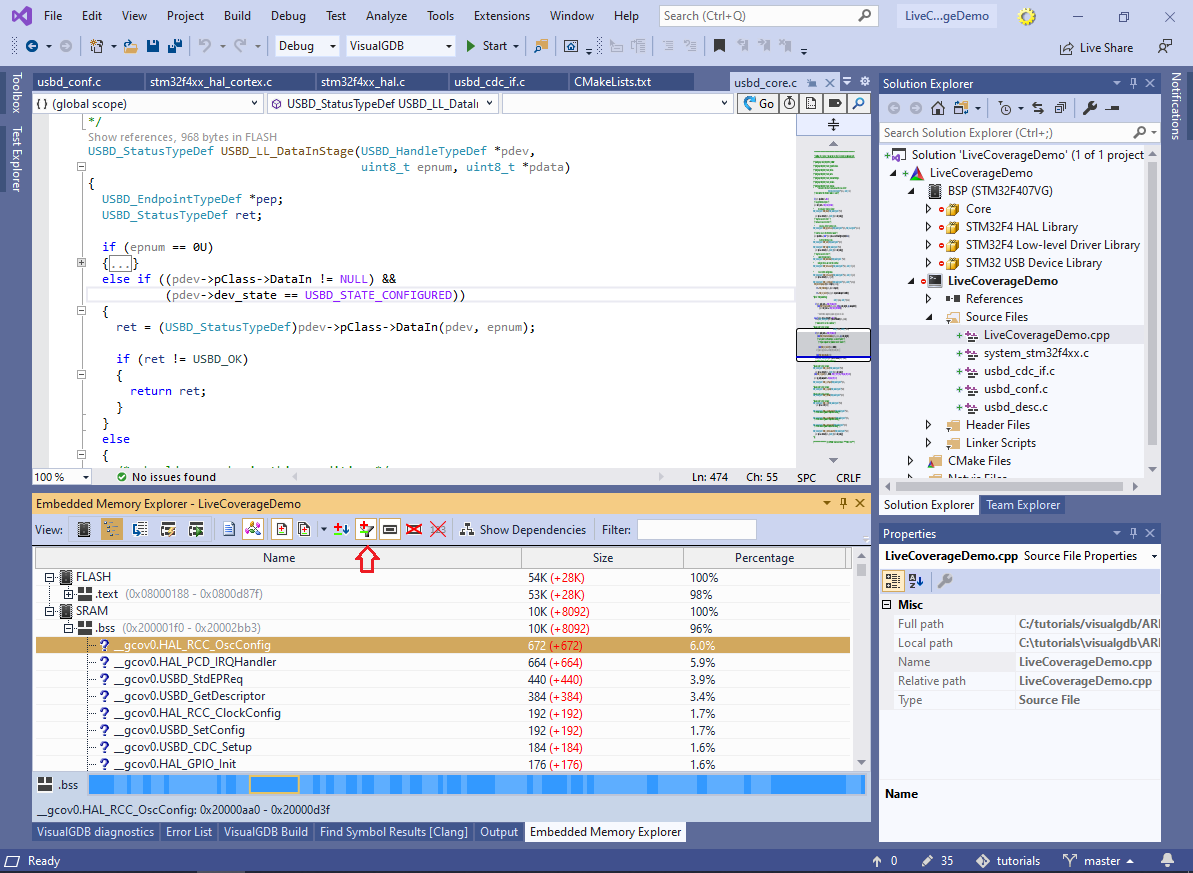
 - Now we will show how to measure and reduce the memory overhead caused by Live Coverage. Open Embedded Memory Explorer and switch to only viewing the differences from the last build. It will show __gcov0.<…> symbols added by GCC during code instrumentation:
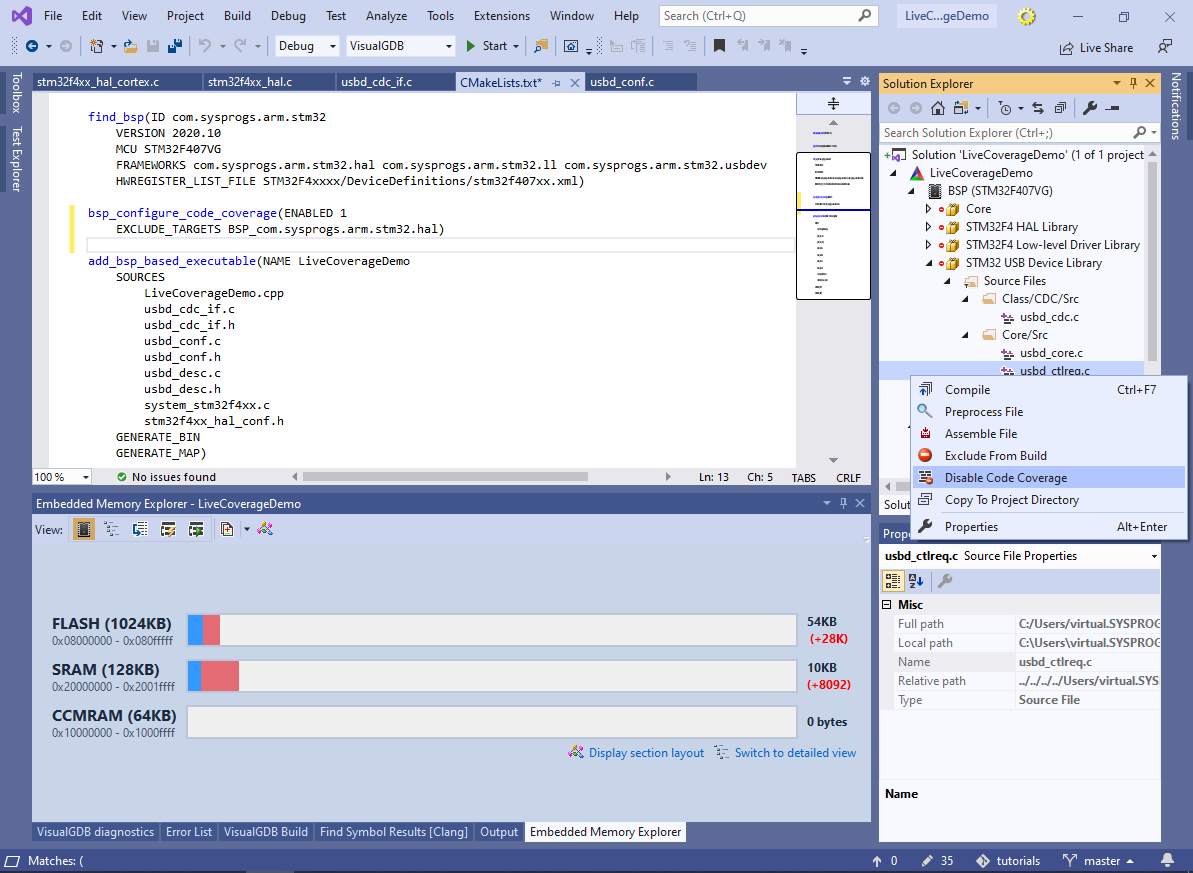
- You can considerably reduce the overhead by disabling instrumentation for specific files or libraries. Right-click on the STM32F4 HAL Library and select “Disable Code Coverage“:
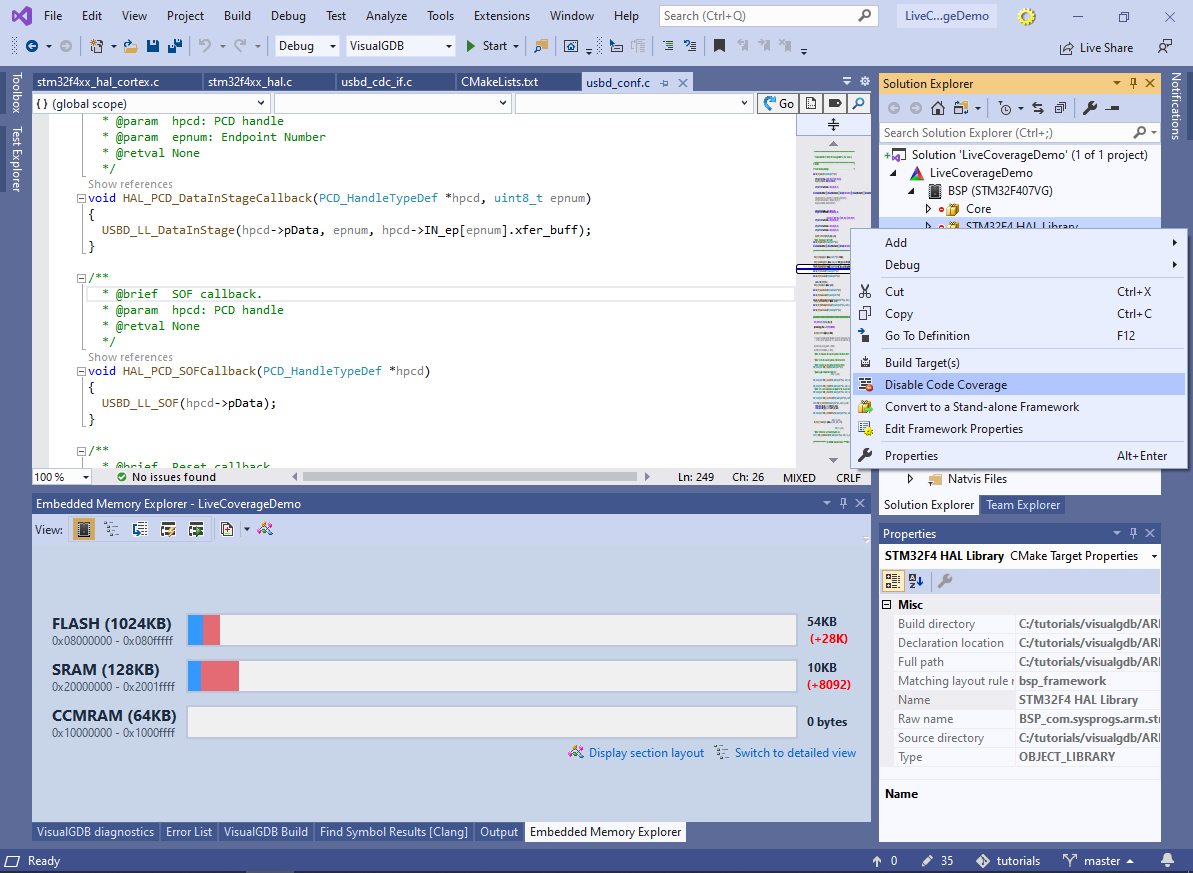
- VisualGDB will update the bsp_configure_code_coverage() statement, excluding the HAL library from instrumentation:
- Similarly, you can disable code coverage instrumentation for specific files anywhere in the project:
- Build the project and observe how the memory overhead considerably reduced:
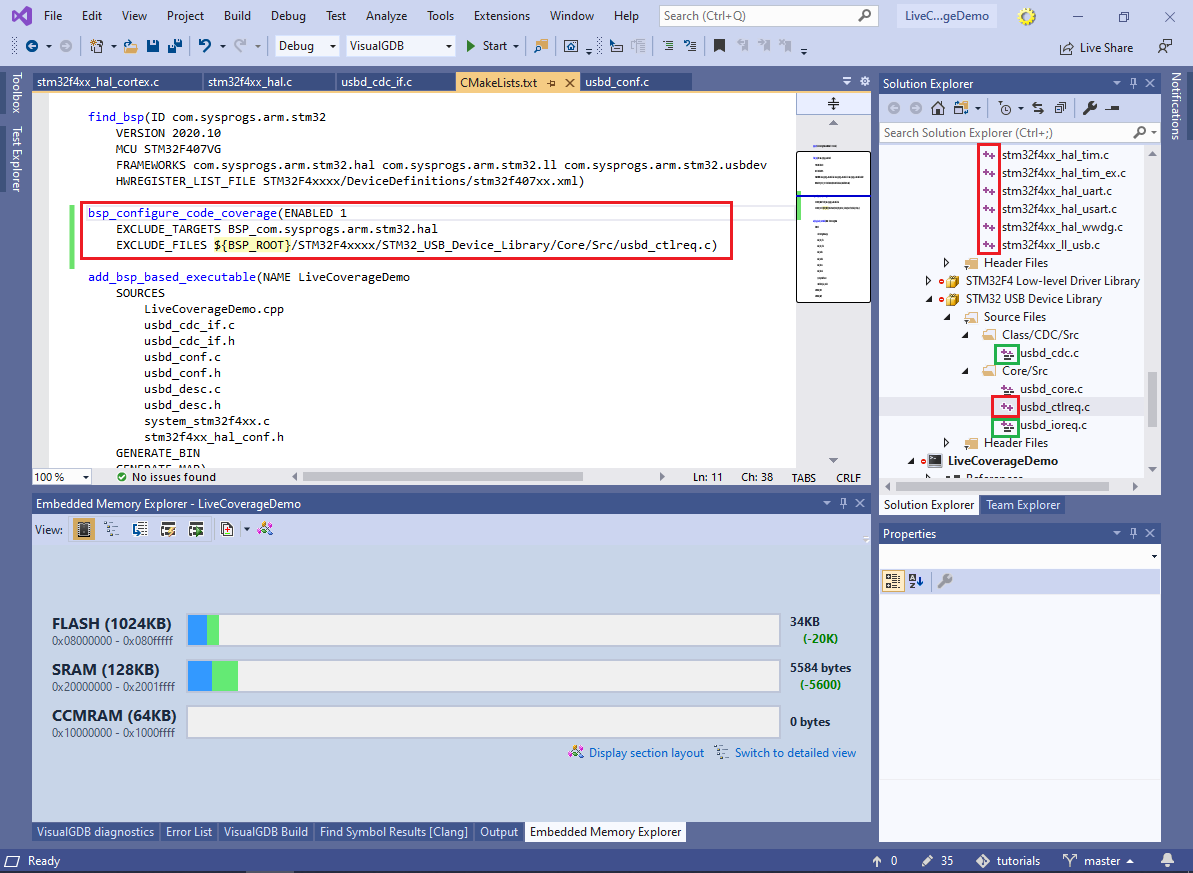 Note that for Advanced CMake projects VisualGDB will automatically use a different Solution Explorer icon for files instrumented for code coverage.
 - Press F5 to start another debugging session. Code coverage will work as expected for the files that were still instrumented:
- You can view a list of all files/targets excluded from code coverage via the VS properties window for the BSP node in Solution Explorer:
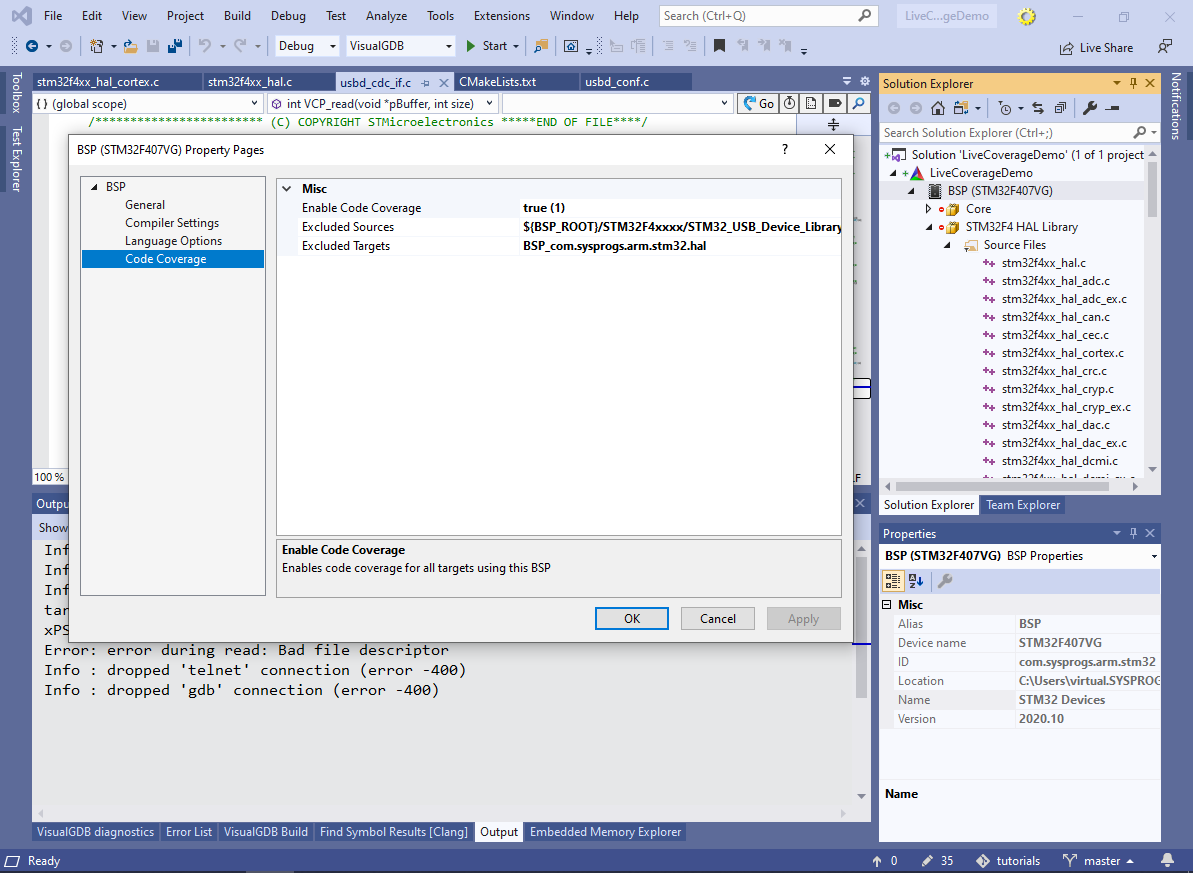 Alternatively, check the bsp_configure_code_coverage() statement in the project’s CMakeLists.txt file.
If you would like to observe values of various variables without stopping the program, check out our Live Watch tutorial for a detailed step-by-step example.