Using Live Watch in Embedded Projects
This tutorial shows how to use VisualGDB Live Watch feature (previously known as Live Variables) to examine the state of your embedded program without interrupting it. We will create a basic project that will continuously update several global variables, and will inspect their state in real time, without ever having to interrupt the program.
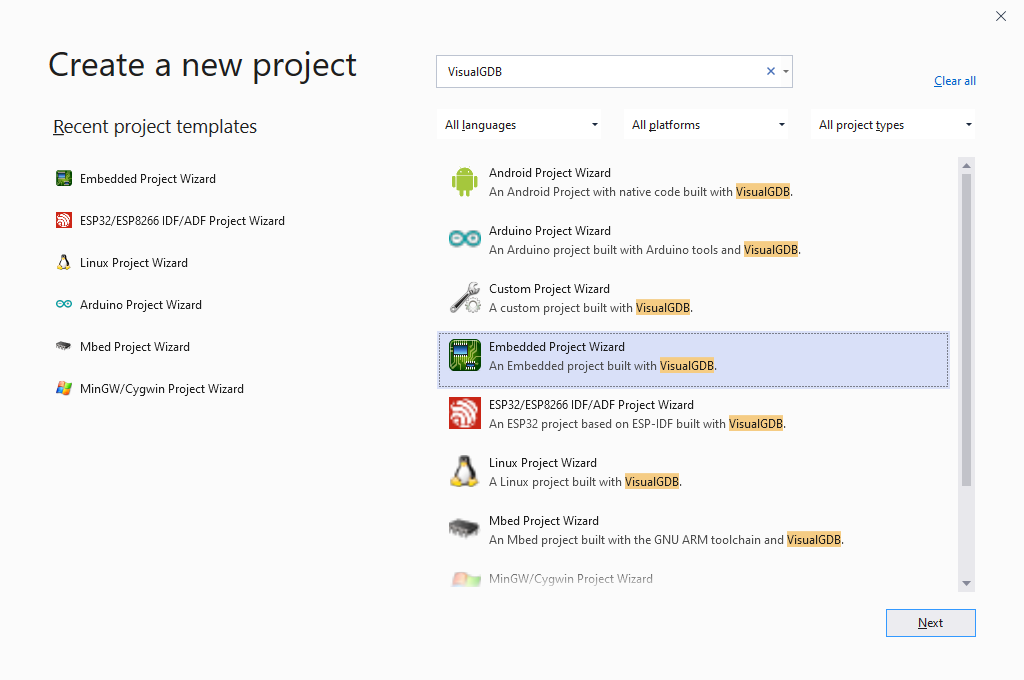
- Start with creating a normal Embedded Project with Visual Studio:
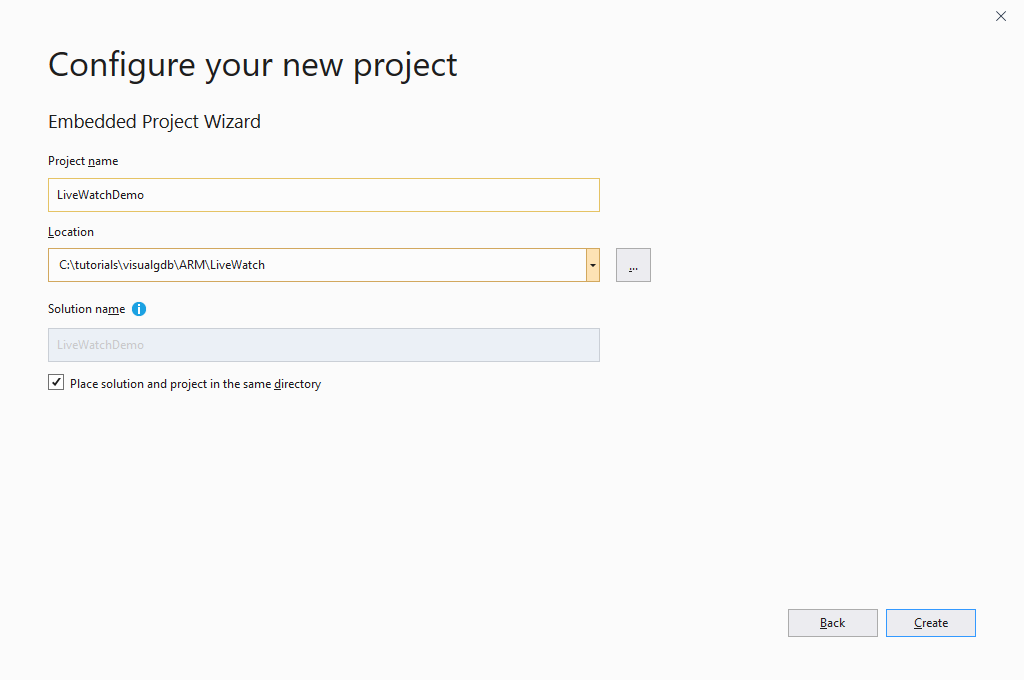
- Enter the name and location for your project:
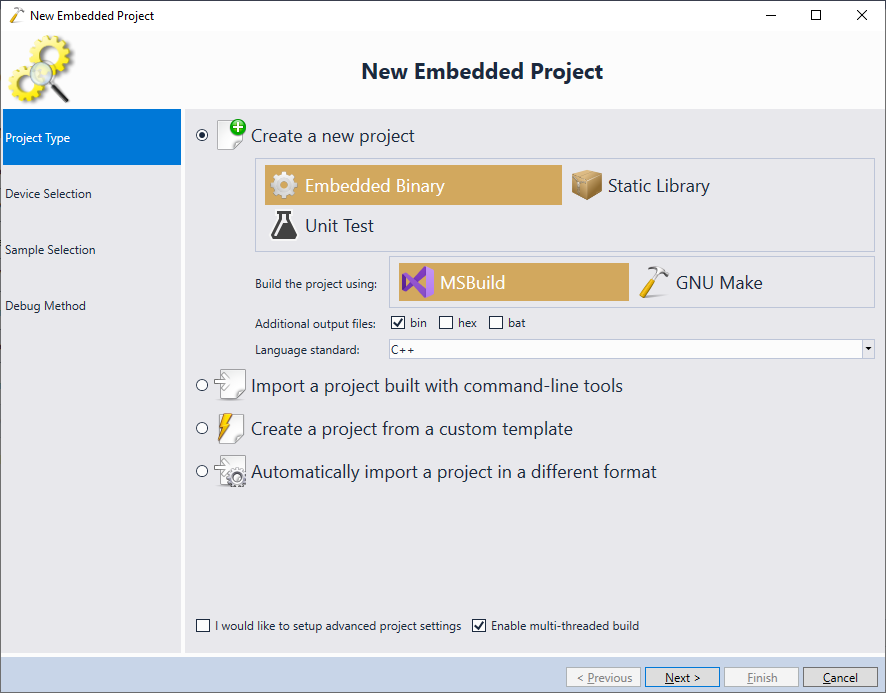
- On the first page of the wizard select “Embedded Binary -> MSBuild“:
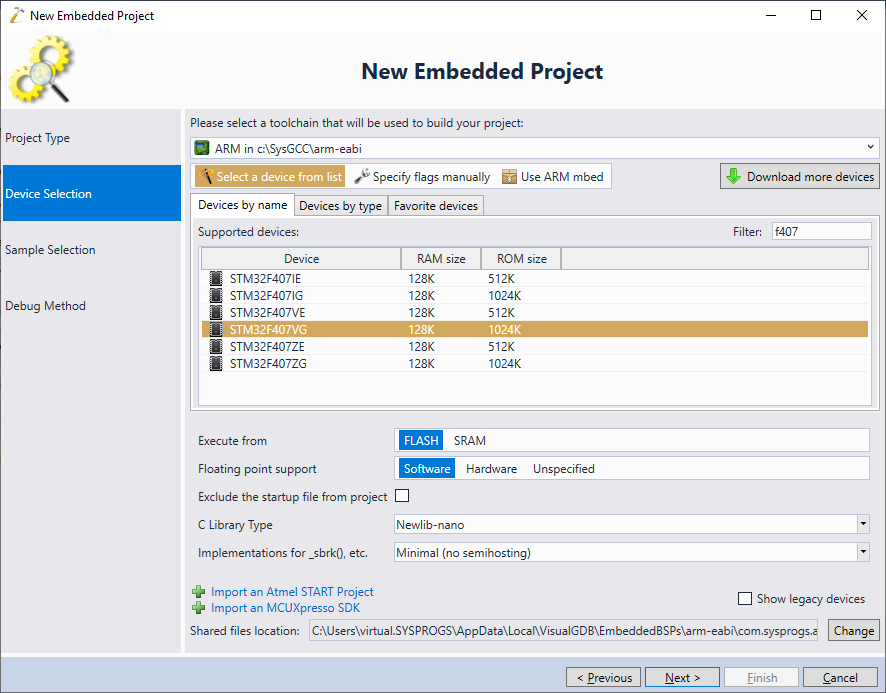
- Select your device. In this example we will use the STM32F4 Discovery board with the STM32F407VG device:
- Select the LEDBLink (HAL) sample in the sample list:
 The sample project will use the PWM to gradually change the intensity of the LED, so we recommend setting the LED port and channel number to match your board. However, the Live Watch functionality shown in this tutorial will work even without an LED.
 - On the last page of the wizard select the debug method. As long as you are using either OpenOCD, or the J-Link GDB stub, Live Watch will work as expected:
 Once you have selected the debug method, press “Finish” to generate the project.
 - We will now change the program to produce the “breathing LED effect” by gradually modifying the duty cycle instead of just turning it on and off:
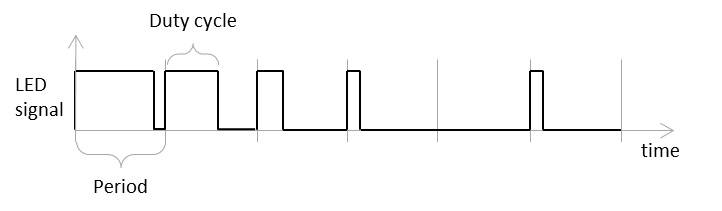 For simplicity we will avoid the use of hardware PWMs and will simply use a basic loop containing the following actions:
- Turn the LED on
- Wait a variable amount of cycles (proportional to the duty cycle)
- Turn the LED off
- Wait a until the end of period
Replace the contents of the main source file with the following code:
#include <stm32_hal_legacy.h>
#include <stm32f4xx_hal.h>
#include <math.h>

#ifdef __cplusplus
extern "C"
#endif
void SysTick_Handler(void)
{
    HAL_IncTick();
    HAL_SYSTICK_IRQHandler();
}

volatile float g_Arg;
volatile float g_Sin;
volatile float g_Cos;

int main(void)
{
    HAL_Init();

    __GPIOD_CLK_ENABLE();
    GPIO_InitTypeDef GPIO_InitStructure;
    GPIO_InitStructure.Mode = GPIO_MODE_OUTPUT_PP;
    GPIO_InitStructure.Speed = GPIO_SPEED_FREQ_HIGH;
    GPIO_InitStructure.Pull = GPIO_NOPULL;
    GPIO_InitStructure.Pin = GPIO_PIN_12;

    HAL_GPIO_Init(GPIOD, &GPIO_InitStructure);

    for (g_Arg = 0;; g_Arg += 0.01F)
    {
        g_Sin = sinf(g_Arg);
        g_Cos = cosf(g_Arg);

        int totalCycles = 5000;
        int onCycles = (int)(totalCycles * (g_Sin + 1)) / 2;
        int offCycles = totalCycles - onCycles;

        HAL_GPIO_WritePin(GPIOD, GPIO_PIN_12, GPIO_PIN_SET);
        for (int i = 0; i < onCycles; i++)
            asm("nop");

        HAL_GPIO_WritePin(GPIOD, GPIO_PIN_12, GPIO_PIN_RESET);
        for (int i = 0; i < offCycles; i++)
            asm("nop");
    }
}
We have used the global variables so that they will be located at a fixed address and can be evaluated by checking that address without stopping the program. Local variables would be overwritten with something else as soon as the function containing them exits and another one is called (not the case in this example).
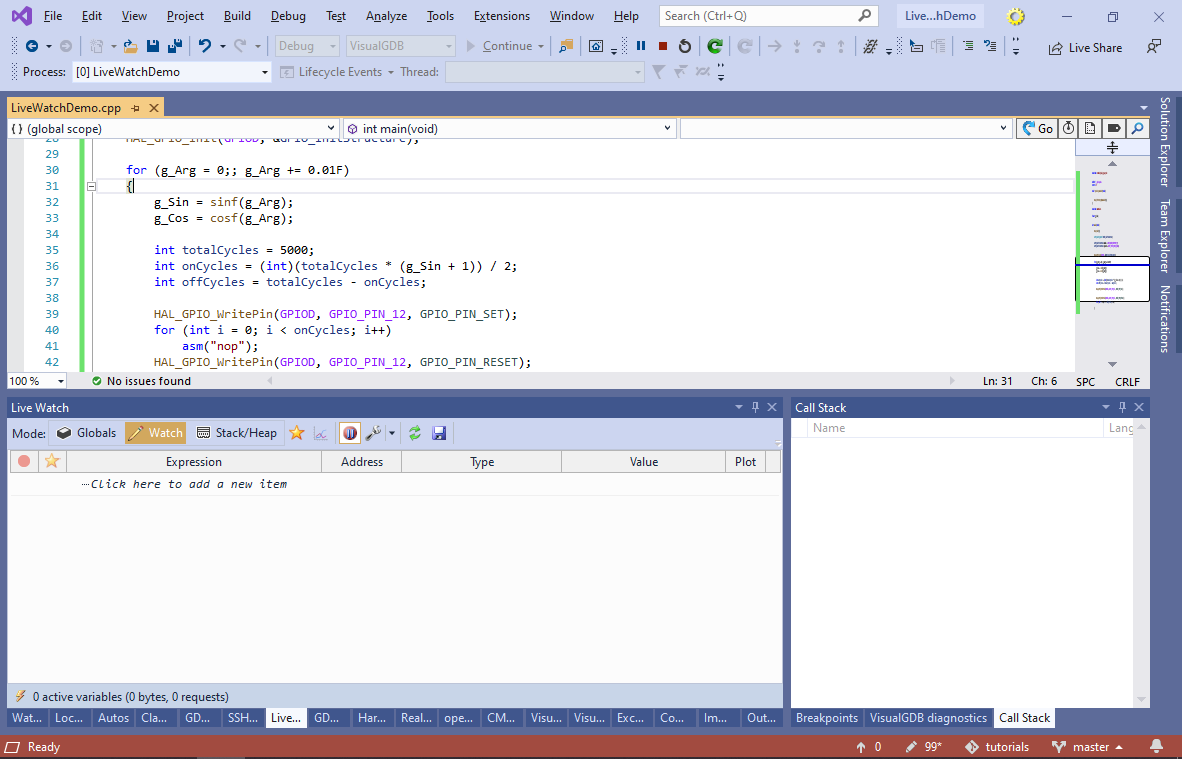
- Build and run your program. While the program is running, open the Live Variables window (Debug->Windows->Live variables):
- The Live Watch window could be used in 2 ways:
- You could explicitly add expressions to it in the Watch mode (just like the regular Watch window). Evaluating the expression will temporarily stop the GDB session, however once it is resumed, the variable will be updated non-stop.
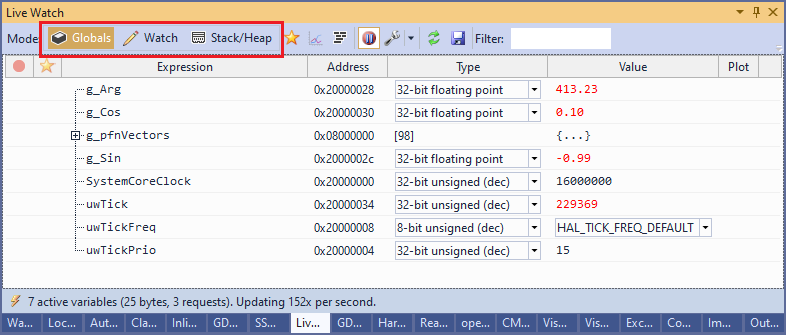
- Alternatively, you can explore all the global variables using the Globals mode. This mode works faster than the Watch mode and never stops the debug session.
Switch to the Globals view and locate the g_Sin and g_Cos variables:
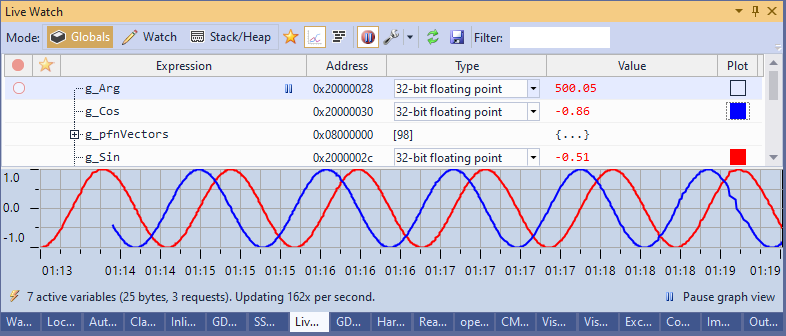
- Click at the “Plot” column of each variable. VisualGDB will show a graph containing the variable values:
- Use the Settings button to limit the plotted data to the last 10 seconds:
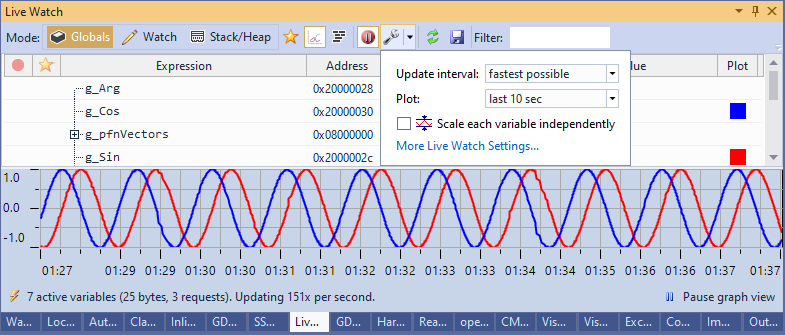 You can tweak Live Watch in many different ways by using the “More Live Watch Settings” link below the common settings. See the VisualGDB Settings Reference for a list of all global options.
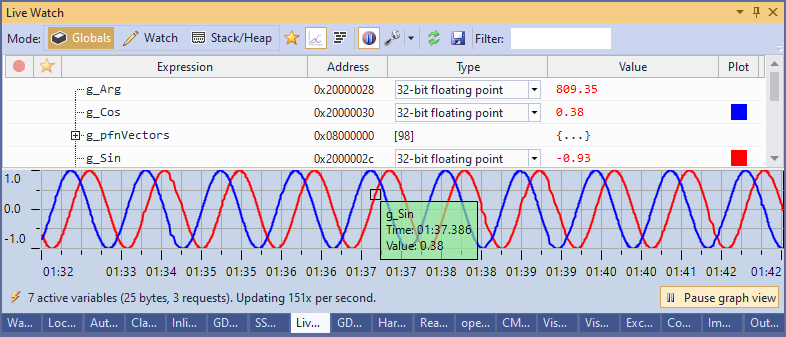
 - You can examine the values of the variables by pausing the graph updating and hovering the mouse over the graph:
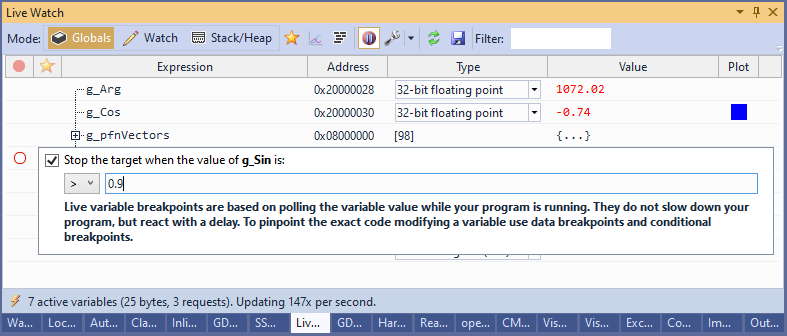
- You can also set virtual breakpoints that will be triggered once the variable value approaches the specified trigger. To demonstrate this we will set a breakpoint when g_Sin becomes greater than 0.9. Click in the breakpoint column of g_Sin and enter the condition:
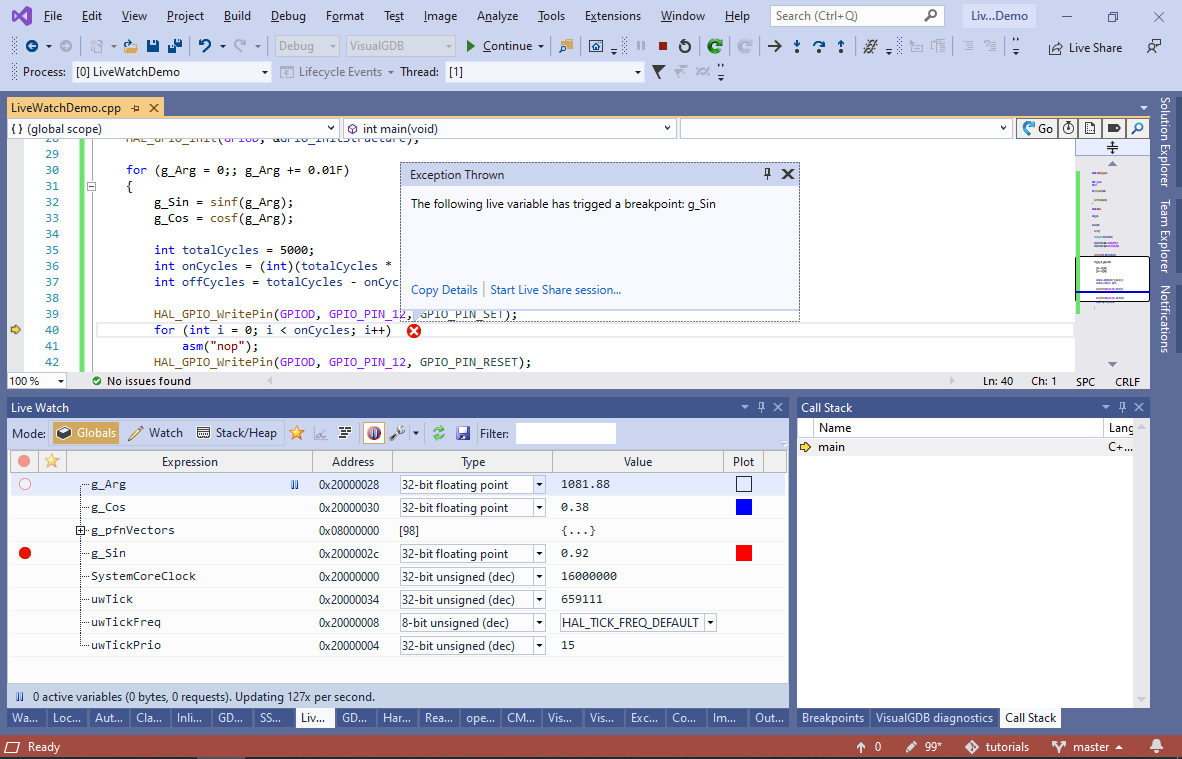
- The breakpoint will soon trigger:
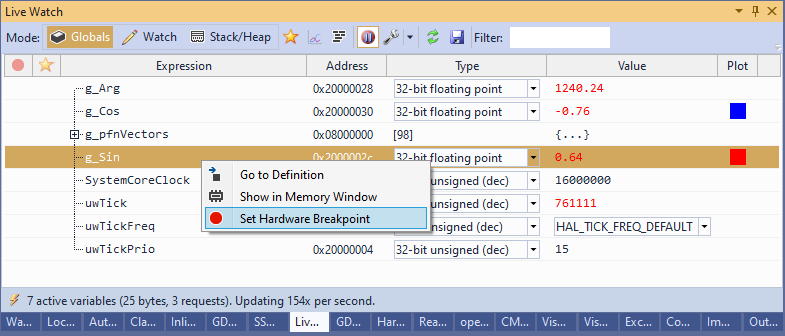
- Note that the breakpoint will be triggered when VisualGDB refreshes the variable value and not when it’s actually changed. If you want to track the exact moment of the variable change, use the hardware breakpoints instead. You can try setting a hardware breakpoint on g_Sin via the context menu:
- The breakpoint will trigger exactly after the value of g_Sin has been modified:

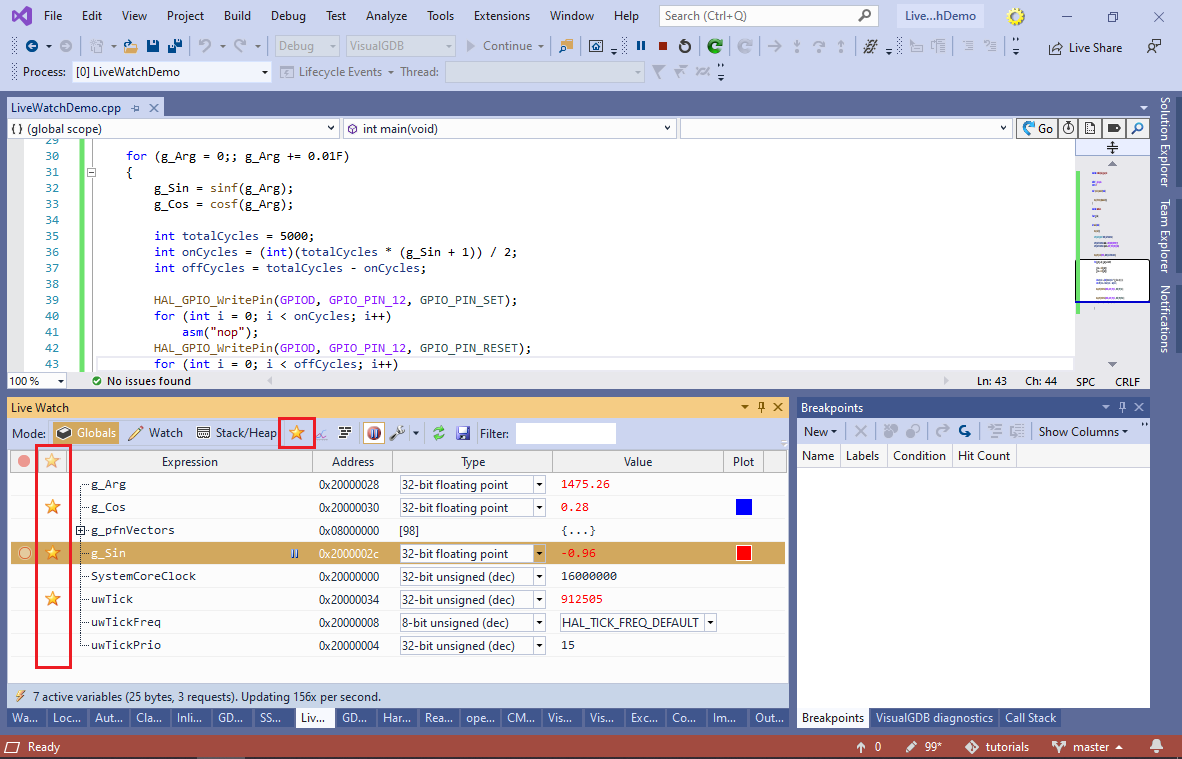
- To quickly focus on relevant variables only, tag them as favorite and then us the “Favorites Only” view on the toolbar:
- Live Watch can also display the variable contents directly where they are declared. Use the “Show Variable Values In Code” button to enable this mode:
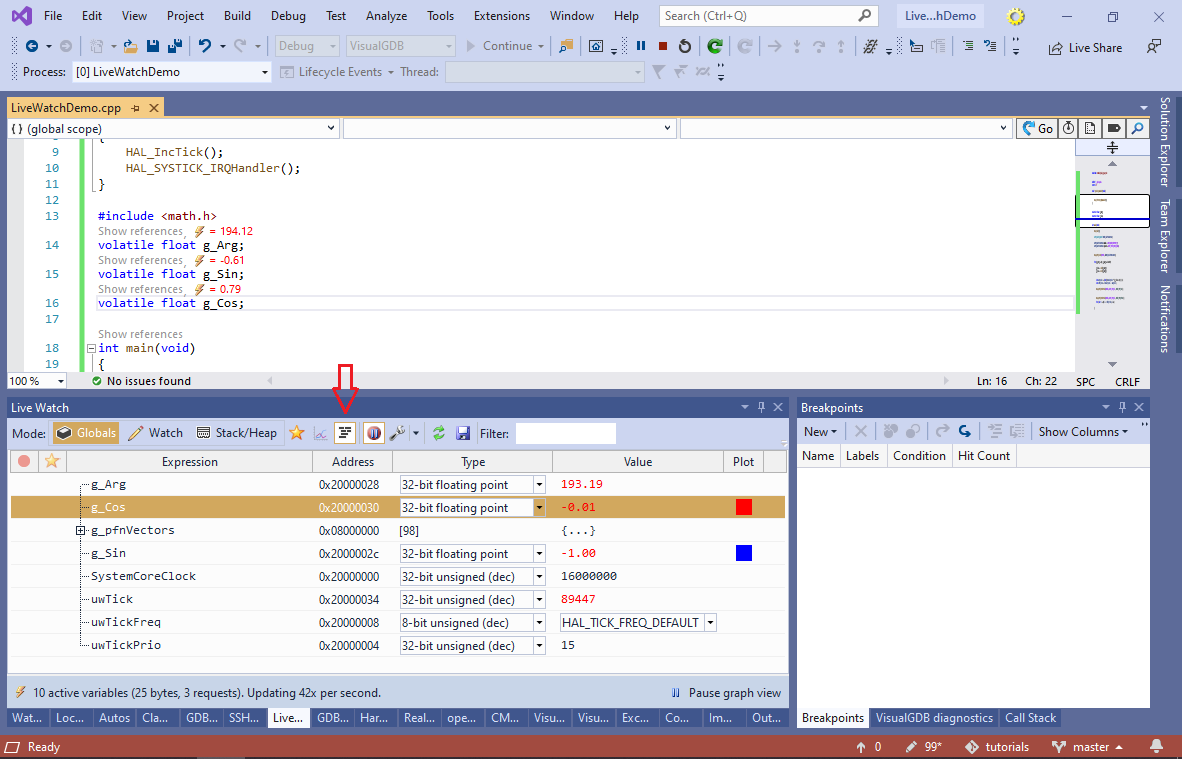 VisualGDB will only update the variable values, if they are visible either in the Live Watch window, or in the code window (or are monitored for plotting/breakpoints), so you can reliably use this view even for large projects with a huge memory footprint.
 - Now we will show how to examine pointers with Live Watch. Add the following structure to your program:
struct LinkedListNode
{
    int Value;
    LinkedListNode *Next;

    LinkedListNode(int value)
    {
        Value = value;
        Next = nullptr;
    }
};
Then modify main() to create a simple linked list and use a global pointer to run through all the nodes:
    LinkedListNode nodes[] = {0, 1, 2, 3 };
    for (int i = 1; i < sizeof(nodes) / sizeof(nodes[0]); i++)
        nodes[i - 1].Next = &nodes[i];

    volatile static LinkedListNode *s_pRootNode = nullptr;
    int index = 0;

    for (g_Arg = 0;; g_Arg += 0.01F)
    {
        s_pRootNode = &nodes[index++ % (sizeof(nodes) / sizeof(nodes[0]))];
        //...
    }
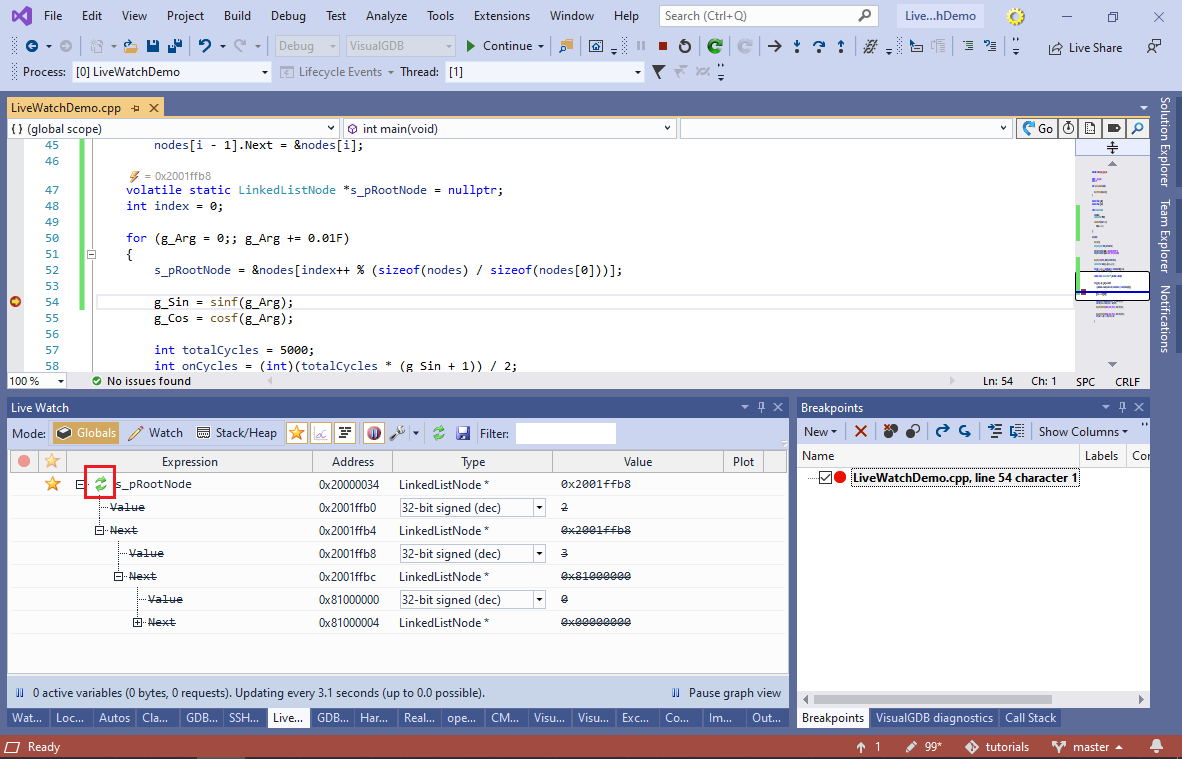
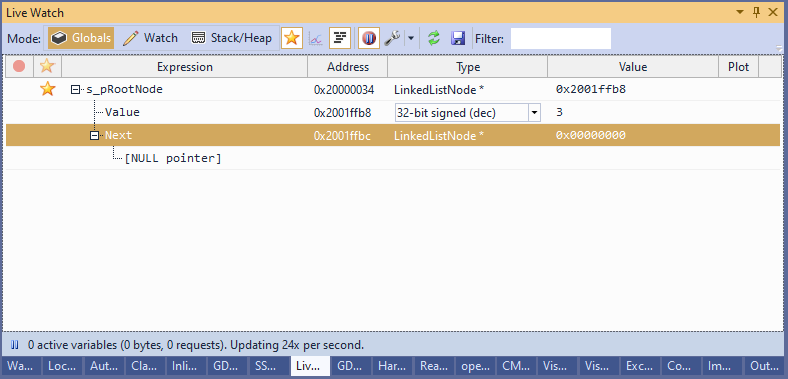
- Start a debug session and find s_pRootNode in the Globals view. To prevent flickering for rapidly changing poitner values, VisualGDB won’t immediately update the s_pRootNodes‘ children. Instead they will be tagged as stale and can be updated at any moment by pressing the Update button:
- Unlike the Watch mode, updating the variables in the Globals mode won’t stop the gdb session, so you can safely do it as needed:
- Try using the Filter box to quickly show all variables that have “Next” in their name (or anywhere within their children’s names):
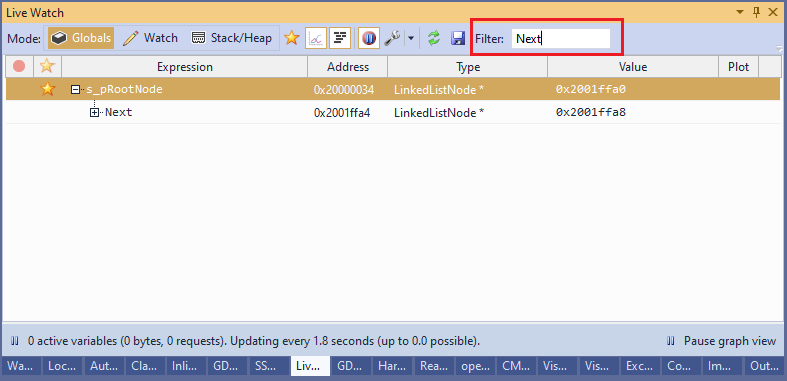 Filtering works very fast by directly searching the debugging symbols. It does not involve stopping the target, or reading any additional memory. You can press “Enter” in the Filter box to quickly expand the parent nodes, revealing the fields that actually matched the entered text.

If you are using the Custom edition of VisualGDB, you can create Live Watch plugins to analyze the state of your program and display it in a meaningful way. As a starting point, see the source for our FreeRTOS LiveWatch Plugin and Stack/Heap Analysis Plugin.