Resolving Invalid Source Paths from GDB
This page explains how to resolve invalid source paths sometimes reported by gdb, that would prevent VisualGDB from showing the relevant source code while stepping through the program.
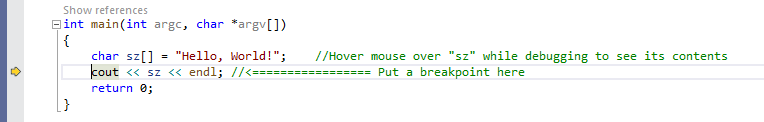
When the application you are debugging with VisualGDB raises an event (e.g. a breakpoint), or when you use the Debug->Break All command, VisualGDB asks the underlying gdb debugger for the path of the source file that corresponds to the currently running code. Normally, it would work out-of-the-box, and you would just see the relevant source code in Visual Studio:
 However, sometimes the path reported by gdb would be invalid. Typically, it is caused by one of the following:
- The project was built in a different directory (or on a different machine) and then moved
- The build tools would wrap the paths on different levels, resulting in artifacts like //c:/dir/file.cpp instead of just c:/dir/file.cpp
Note that these paths are coming directly from the debugged executable (i.e. ELF file) and are not affected by the contents of Solution Explorer, IntelliSense settings, etc.
When VisualGDB detects an invalid path reported by gdb, it shows a window that allows conveniently locating the missing files: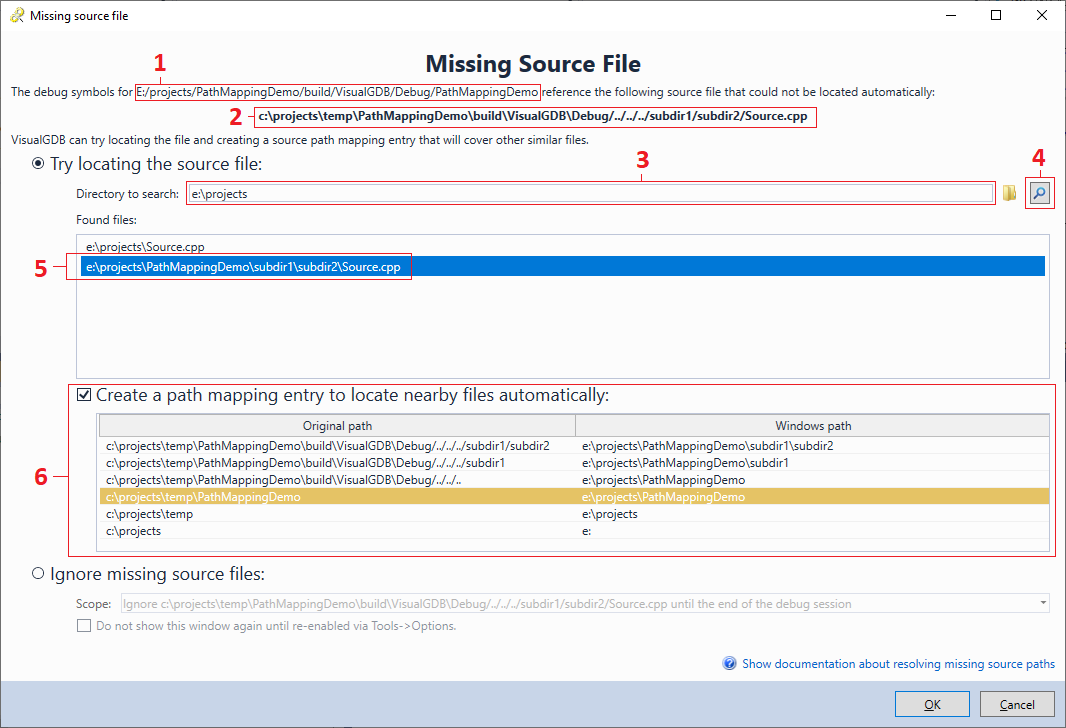
The window displays the path of the currently debugged executable (1), and the exact path reported by gdb (2) and allows recursively searching an arbitrary directory (3) for the files with the matching name.
Once you start the search (4) and select a matching file from the list (5), VisualGDB can create a generic path mapping to automatically cover other similar files. The mapping will cover all paths that begin with the selected prefix, so you can select (6) the most generic one that covers your scenario.
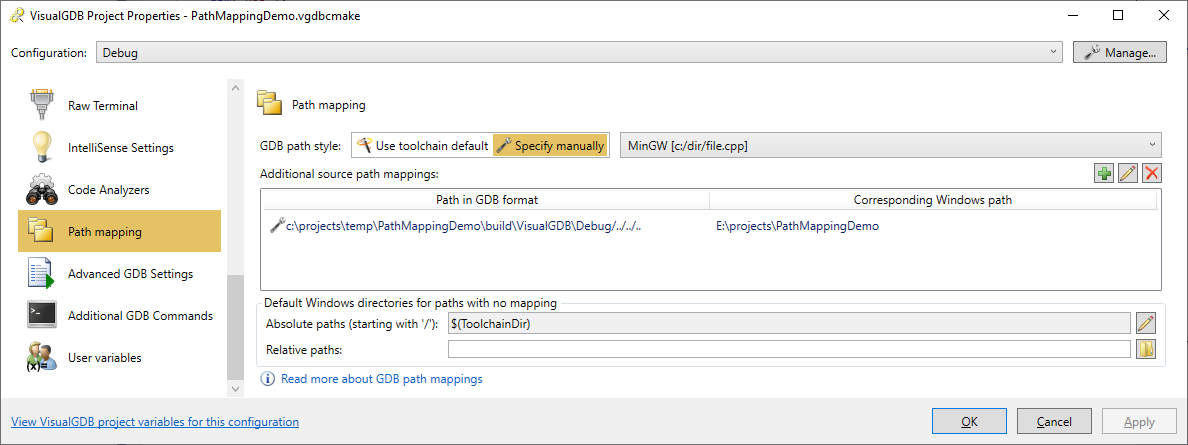
The mappings configured via this window will be saved in the project settings and editable via VisualGDB Project Properties -> Path mapping:
 You can disable the Missing Source File popup via Tools->Options->VisualGDB->General->Debug->Locate Missing Source Files.