Configuring IntelliSense for vs-android
This tutorial shows how to configure IntelliSense for vs-android to automatically parse include files from the Android NDK and support all involved GNU extensions.
- Install VisualGDB 5.0 or later (ensure that “Android Edition” is checked in the installer). This will add support for debugging and Clang-based IntelliSense to vs-android projects.
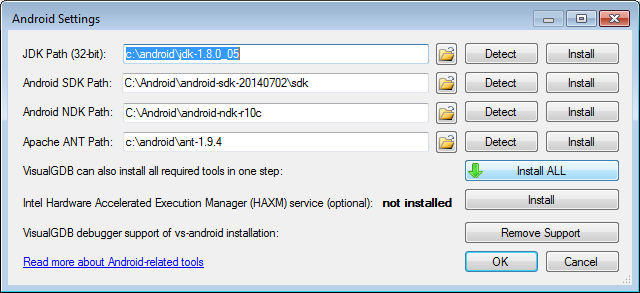
- Start Visual Studio. Select “Android->Setup SDK/NDK Locations”. Specify the paths to your Android tools and click “Add Support” to select VisualGDB as a default debugger for vs-android projects:
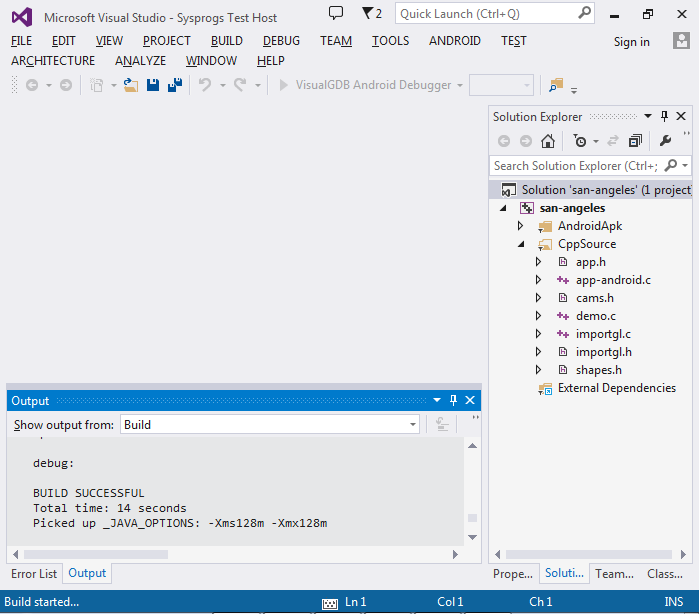
- Open a vs-android project (in this example we will use the san-angeles demo) and ensure you can build it successfully:
- Open one of the source files. Although the syntax highlighting and IntelliSense will work, you will most likely see some error messages:
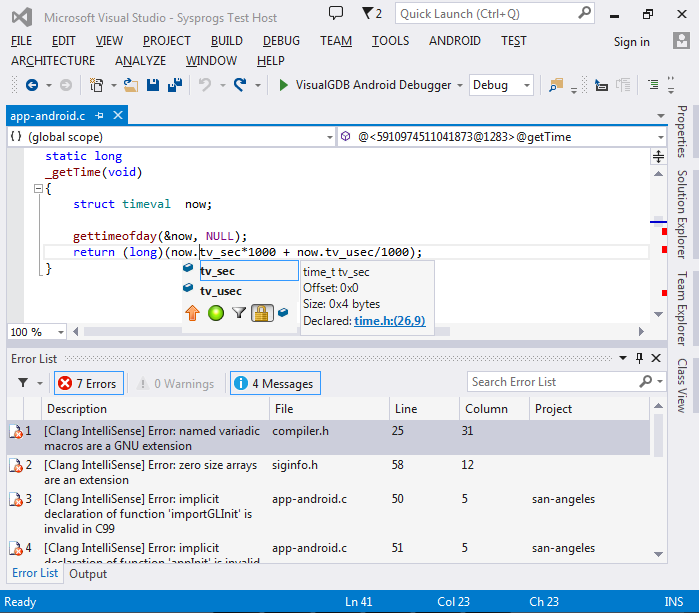
- This happens because the NDK uses some GNU extensions that are not enabled with Clang by default. As of NDK r10, the following extensions are used:
Extension Example Option to enable Named variadic macros #define __builtin_warning(x, y…) -Wno-variadic-macros Zero-length arrays char _pad[0] -Wno-zero-length-array Furthermore, the san-angeles example uses some C functions without declaring them and this will be treated as an error unless -Wno-implicit-function-declaration is specified.
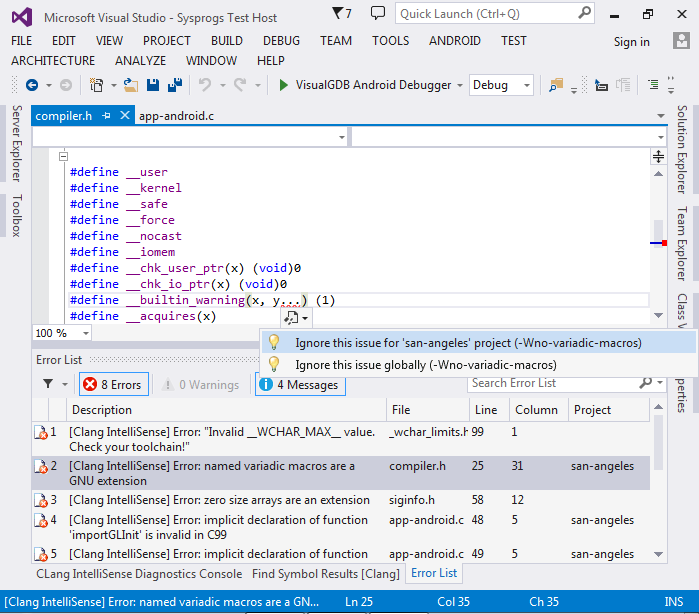
To enable those extensions, double-click on the errors in Error List and, then select the smart tag in the code at the error location and select “ignore this issue for the project”:
- Once you have enabled all relevant extensions, you can get an overview of the added IntelliSense flags by right-clicking on your project in Solution Explorer, selecting VisualGDB Project Properties, going to the IntelliSense Settings page and checking the “Additional flags for C files” field:
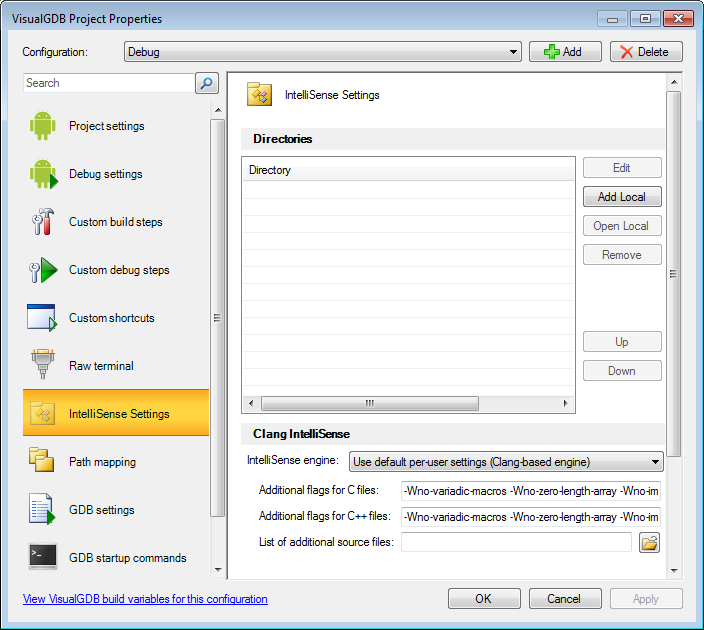
- Press OK to apply the new settings. The error messages will now disappear and the IntelliSense engine will be able to parse the code correctly. Right-click on appRender() and select “Find all references” to test it out.
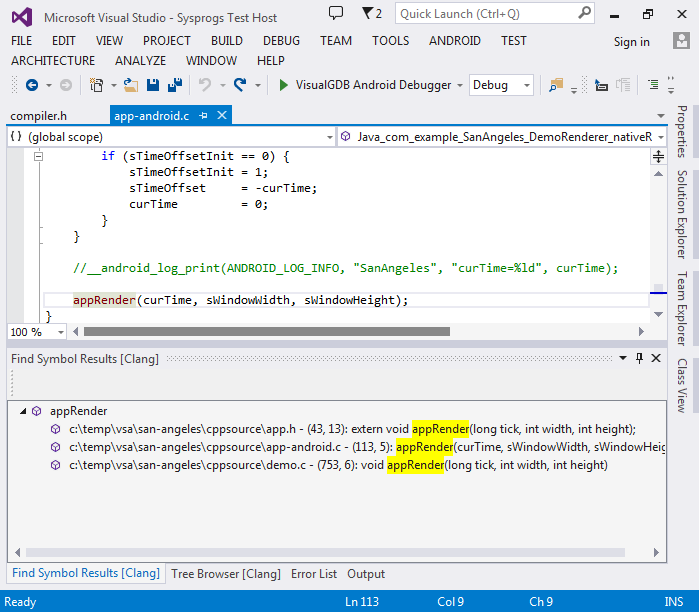 Note that clang-powered “Find All References” command will also look into references within preprocessor macro expansions and will work instantly even for huge projects.
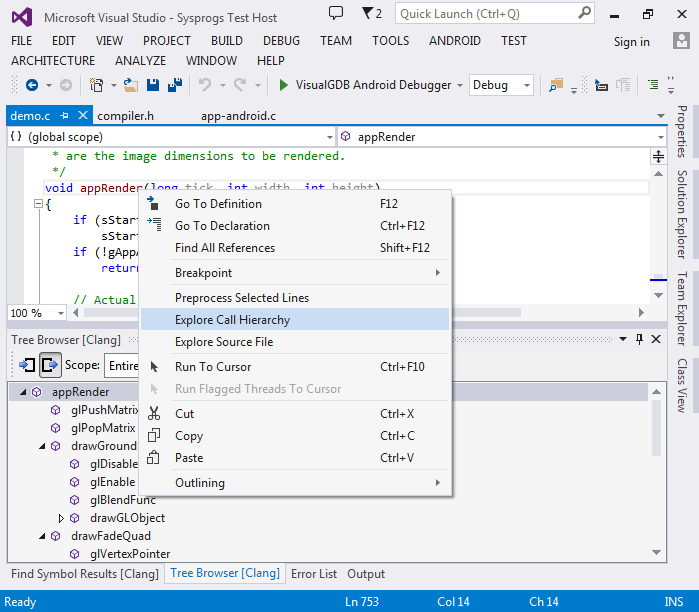
 - You can also quickly explore the structure of the source code by right-clicking on a function and selecting “Explore call hierarchy”. You can then choose to browse called functions, calling functions, or both:
- Start debugging your app by pressing F5 (given that you have enabled debugger integration as described in the beginning of this tutorial). Set a breakpoint in camTrack(). Once it is triggered, try entering a complex expression (e.g. cam->dest) in the Watch window. The auto-completion work there same way as when debugging C# programs:
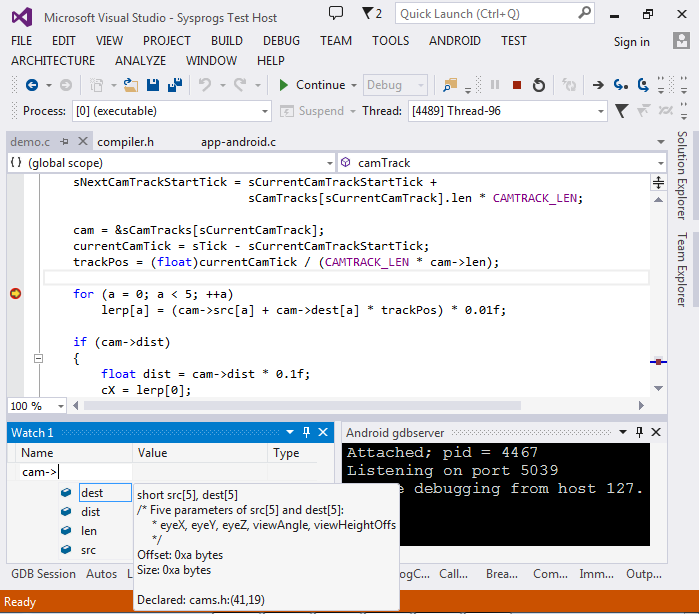
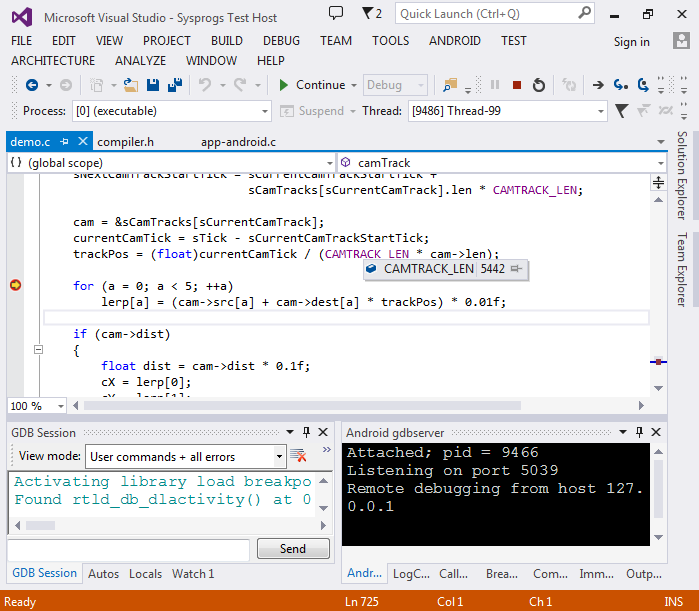
- You can also use preprocessor macros in Watch expressions or hover mouse over them to see their value in the current context:
- When you are done debugging, press Shift-F5 to end the debugging session.


