Developing NXP LPC projects with Visual Studio
This tutorial shows how to develop and debug a basic firmware project for the NXP LPC microcontrollers using Visual Studio and VisualGDB. We will use the LPCXpresso LPC1347 board modified to allow external SWD connections and the LPC-Link 2 programmer with Segger firmware.
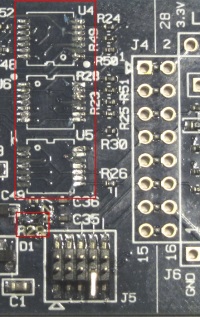
The LPCXpresso boards can be cut into two in order to use the an external SWD interface such as LPC-Link 2, however instead of cutting the entire board we will simply disconnect the on-board LPC-Link 1 from the target and reuse its JTAG/SWD connector.
This is done by removing the level converters (U4,U5,U6 on most of the boards) and soldering together both terminals of R29 (normally it is not mounted). Once this modifications are done, the J5 connector can be used to attach an external programmer.
Before we begin, ensure that VisualGDB 4.1 or later is installed.
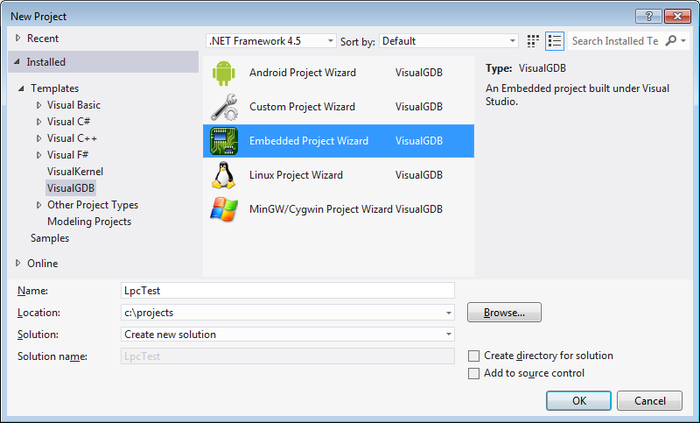
- Start Visual Studio. Begin creating a new project with the embedded project wizard:
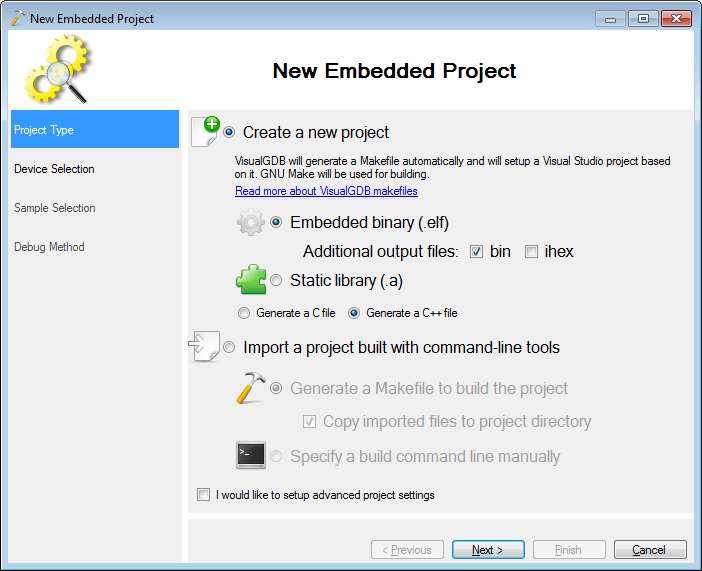
- Select “Embedded binary” on the first page:
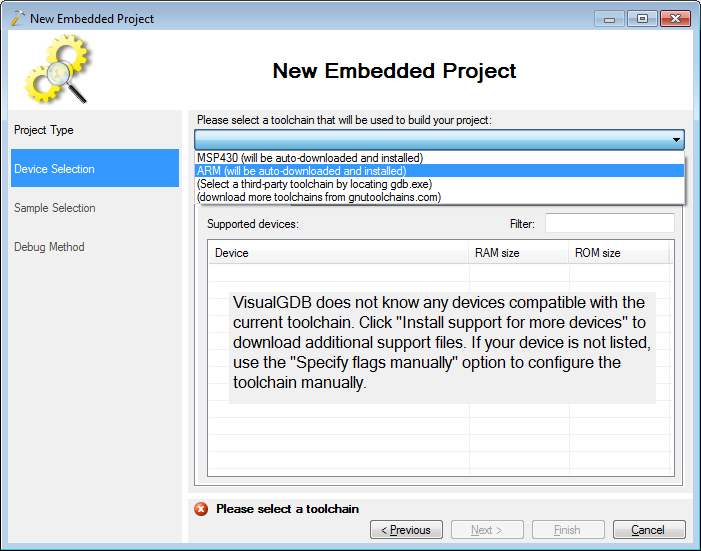
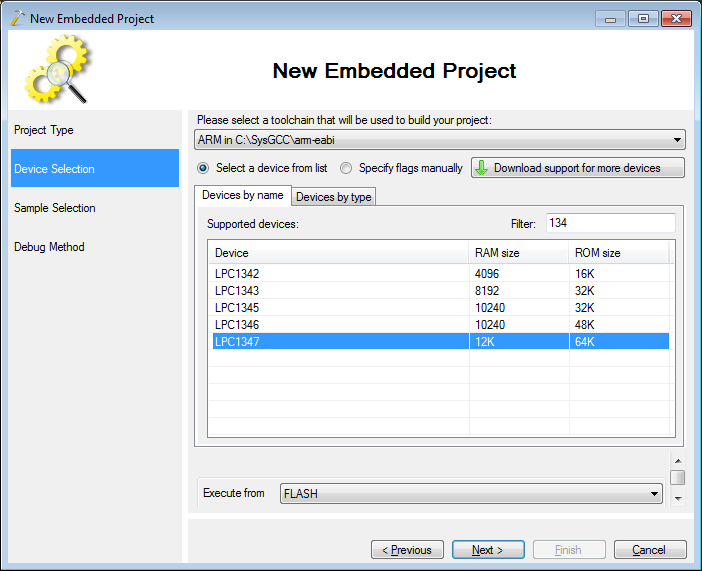
- On the next page select the ARM toolchain. If it is not installed yet, VisualGDB will download and install it automatically:
- Then
click “Download support for more devices” and select NXP LPC
in the list: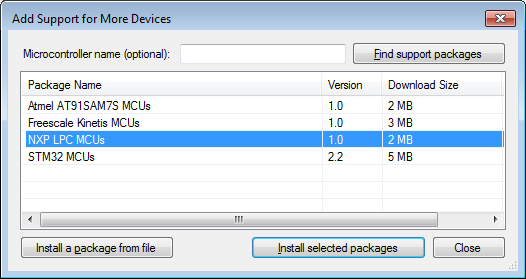
- Select LPC1347 in the device list. Use the Filter field to find the right device faster:
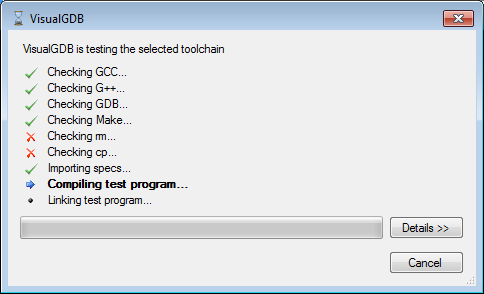
- When you press “Next”, VisualGDB will test the settings and ensure it can compile firmware for the device:
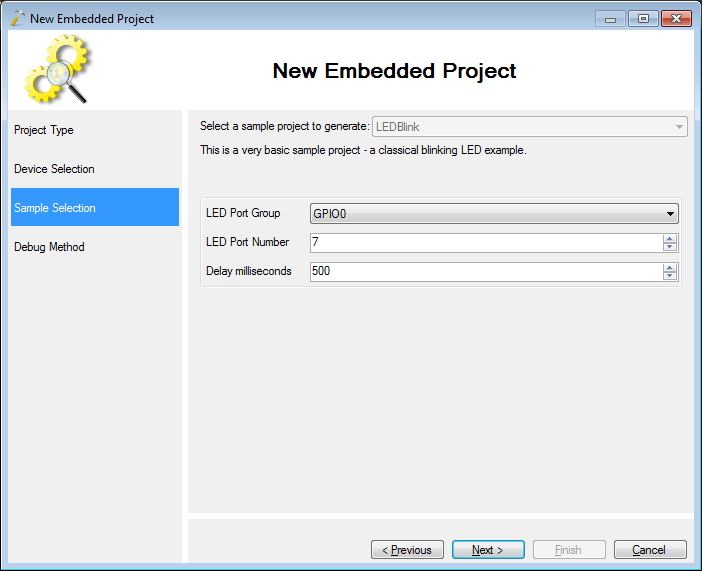
- The next page allows customizing the sample project that will be created. If you are using the LPC1347 or LPC1200 board, keep the default settings. Otherwise, ensure that the LED port matches your board layout:
- The next page allows configuring the debug interface. There are several options for debugging the NXP LPC devices with VisualGDB:
- Using Segger J-Link. It supports the NXP LPC devices out of the box.
- Using LPC-Link 2 debugger with Segger firmware. It is not as expensive as the stand-alone Segger J-Link, but would be sufficient for the most uses.
- Using some other debugger with OpenOCD. Note that OpenOCD does not support all families of the NXP LPC devices and may require manual script editing for those that are supported.
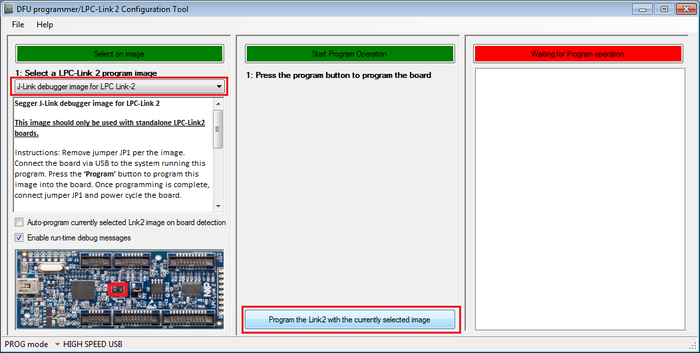
We will use the LPC-Link 2 debugger with Segger firmware. First of all remove all jumpers from your LPC-Link 2, download the LPC-Link 2 configuration tool and the LPC-Link 2 drivers, ensure the drivers are installed, plug in your LPC-Link 2 and use the configuration tool to program the Segger firmware:
- Note that the configuration tool may fail
randomly. You may need to try it several times until it
succeeds or even use another computer: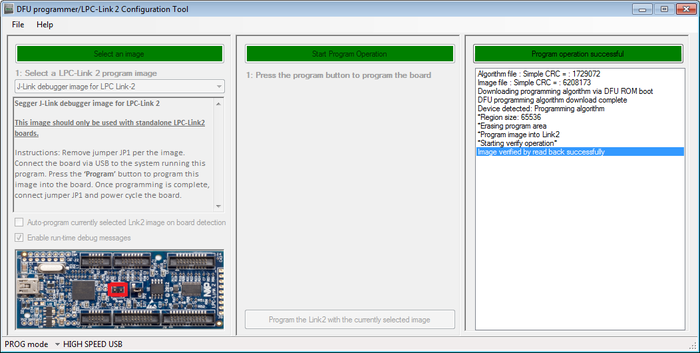
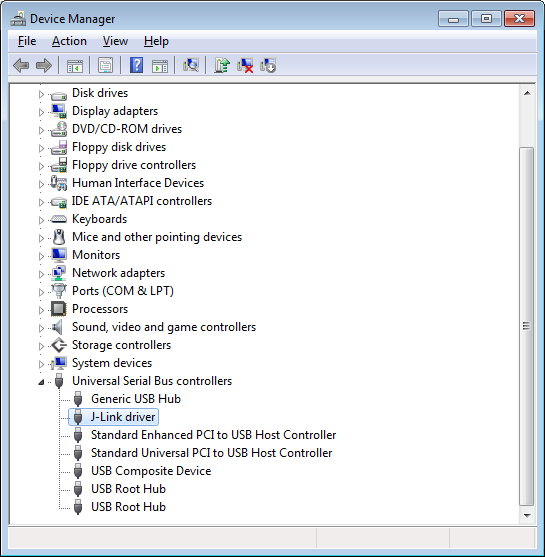
- Finally download and install the Segger software package. Connect the JP1 jumper on your LPC-Link, plug it in and ensure that it has the Segger driver installed:
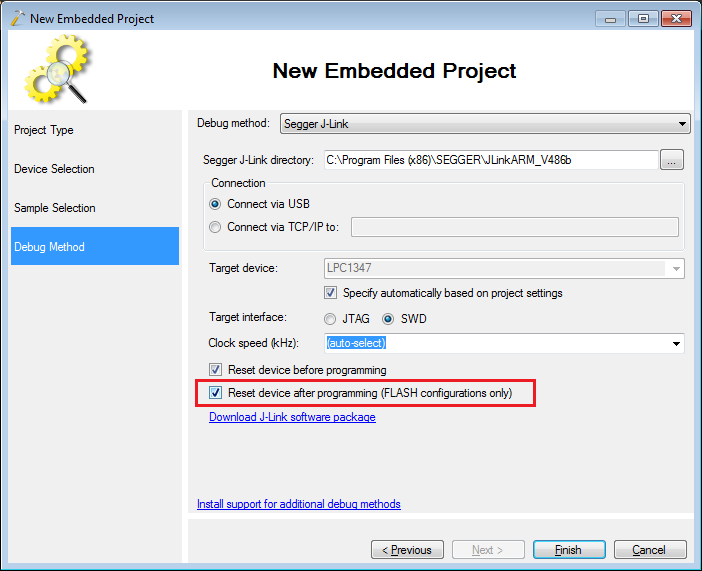
- Go back to VisualGDB project wizard, select Segger J-Link as the debug method and specify the path to the Segger software package. Ensure you enable the “reset device after programming” flag as it avoids several common problems with the interrupt controller:
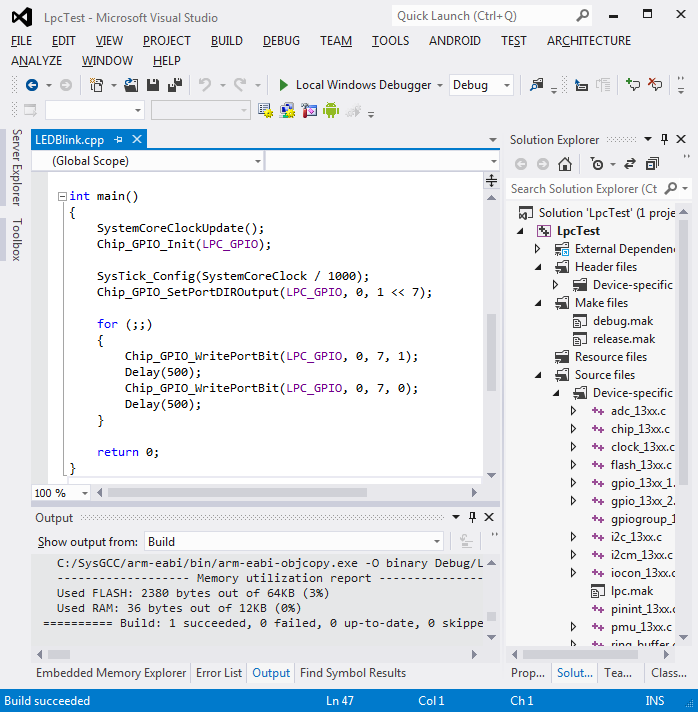
- Press “Finish” to generate your project. VisualGDB will use the new LPCOpen 2.x library to provide easier access to various LPC hardware. Press Ctrl-Shift-B to build your project:
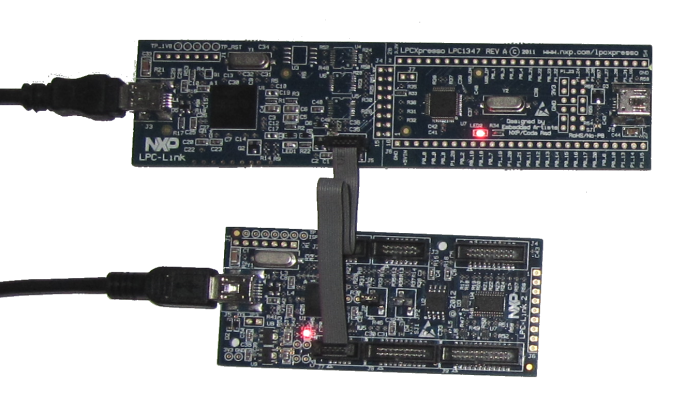
- Press F5 to start debugging. Note how the LED on the board is blinking:
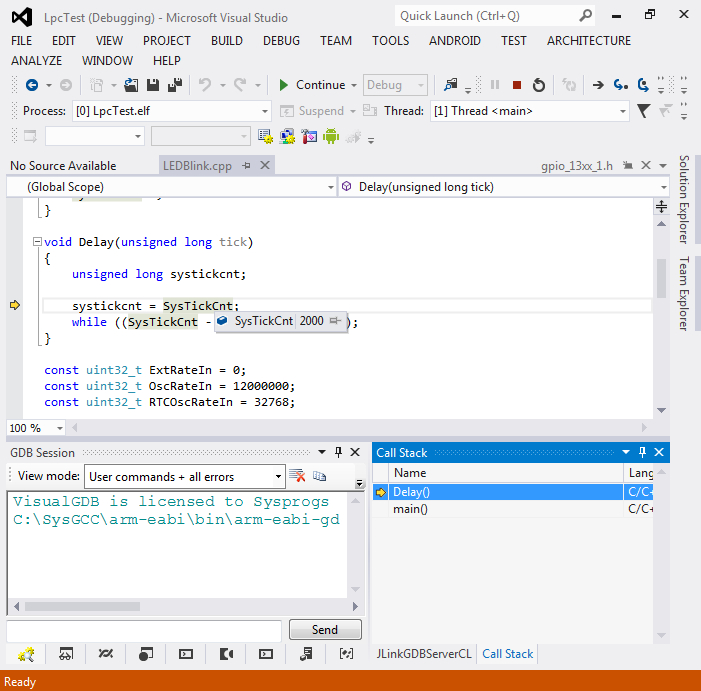
- Set a breakpoint on a call to Delay(). It will be almost immediately hit. Step into it and use the normal debugging techniques to view the variable values:
- Congratulations! You got your debugging to work. Press Shift-F5 to exit debugging session or select Debug->Detach All to remove all breakpoints and keep the firmware running in the background.


