Debugging Embedded projects with PyOCD
This tutorial shows how to debug embedded projects using the PyOCD tool and VisualGDB. PyOCD is significantly less functional than OpenOCD, however it is better integrated with mbed-specific boards, so we recommend using it as a fallback if OpenOCD doesn’t work with your board. Before you begin, install VisualGDB 5.3 or later.
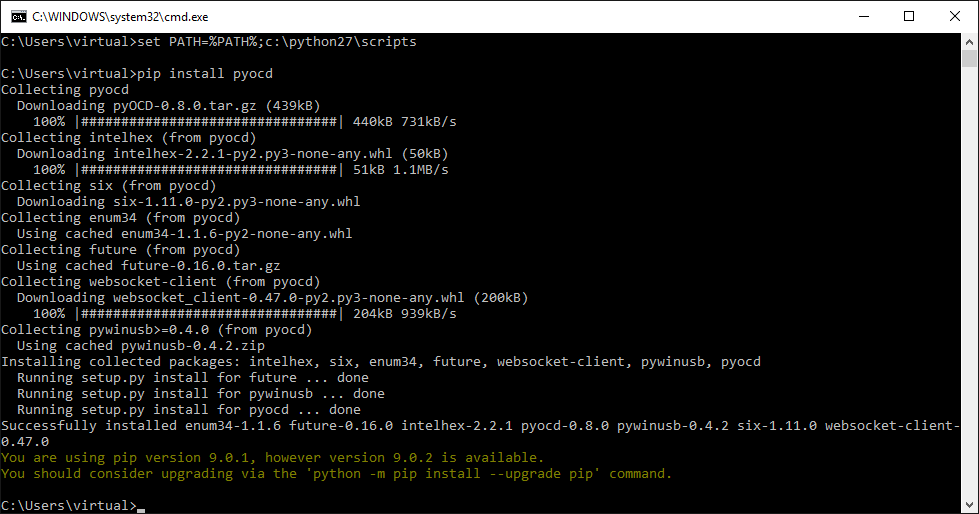
- Download and install Python 2.7 for Windows. Then open a command-line Python prompt and install PyOCD by running “pip install pyocd”:
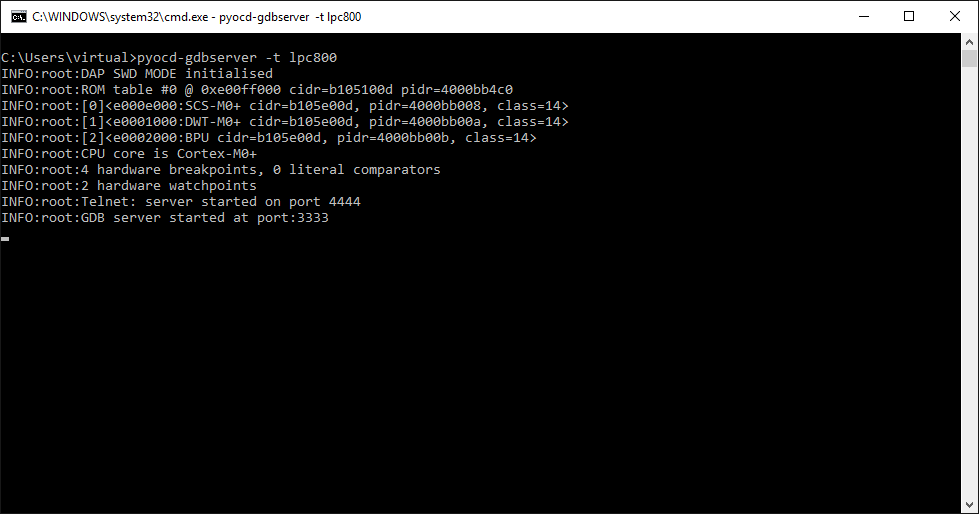
- You can quickly check that PyOCD works by connecting your board to the USB port and running “pyocd-gdbserver -t <target name>”:
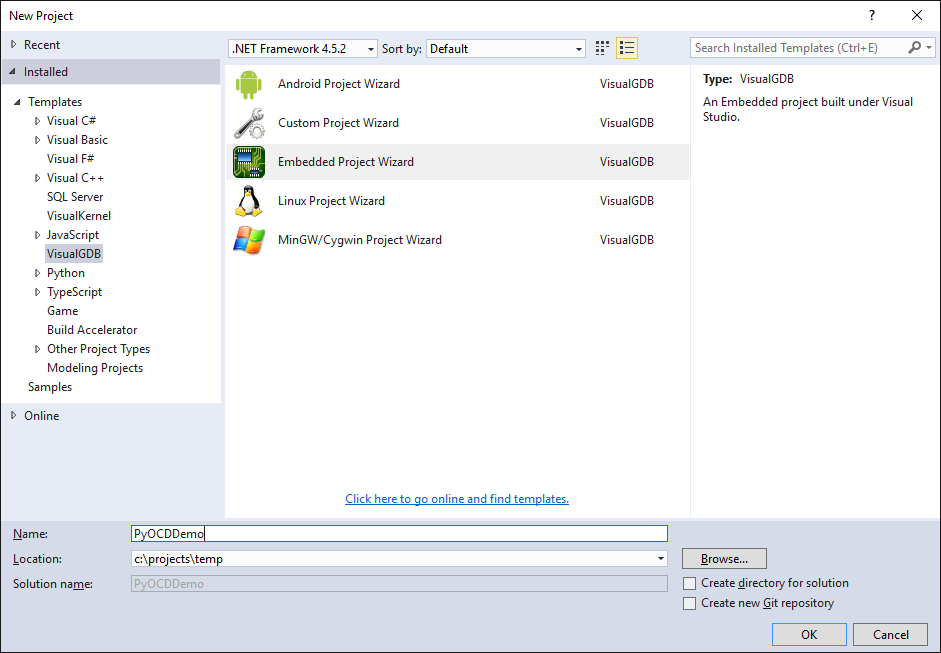
- Now we will create a project with VisualGDB. Start Visual Studio and select the VisualGDB Embedded Project Wizard:
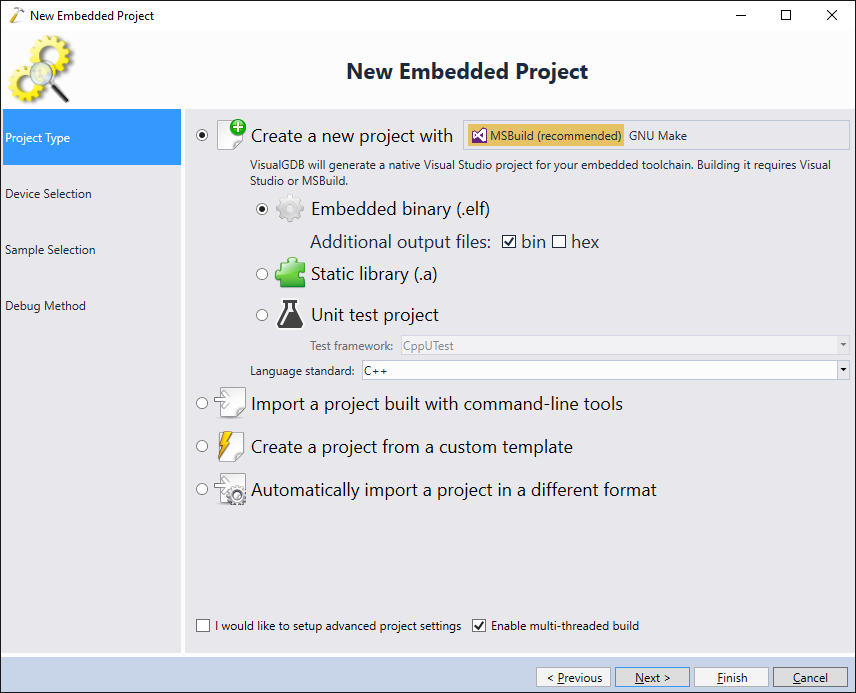
- Select “Create a new project with MSBuild -> Embedded Binary”:
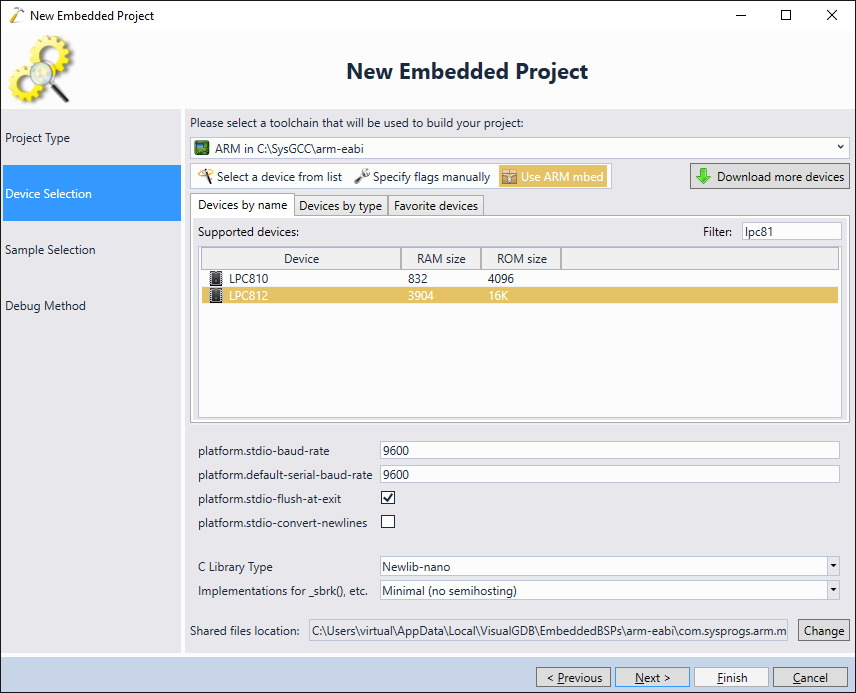
- As PyOCD is typically used with mbed-based projects, we will demonstrate its use for the LPC812 mbed/Xpresso board, however any other board supported by PyOCD will work as well. Select “use ARM mbed” and pick your board in the list:
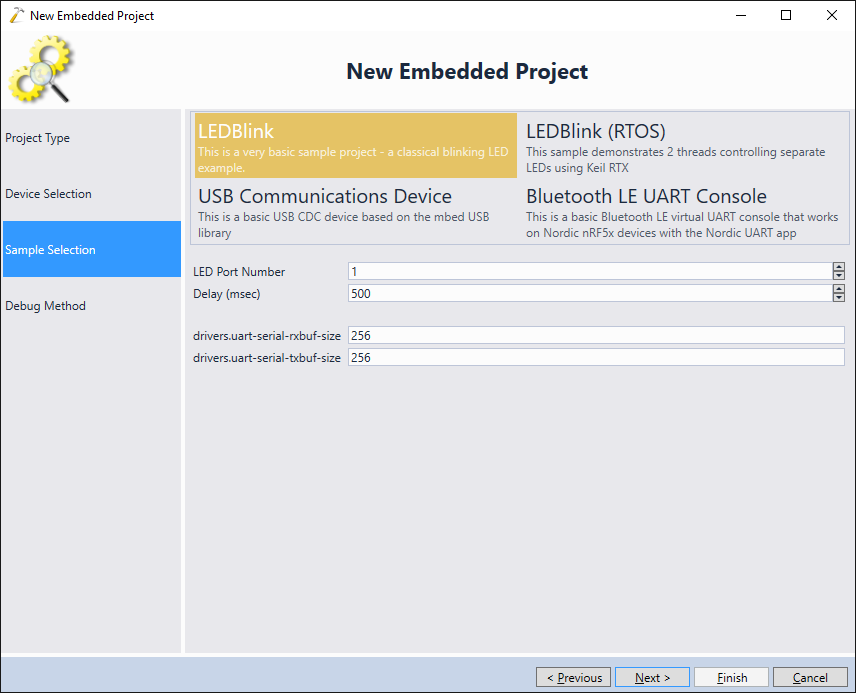
- On the next page proceed with the default “LEDBlink” example:
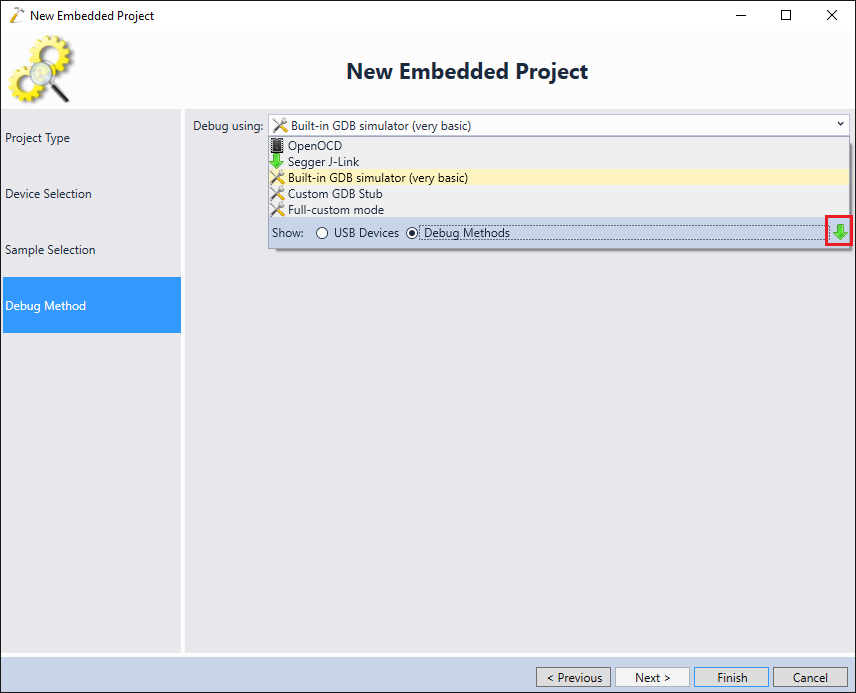
- On the last page of the wizard switch to “Debug Methods” instead of “USB Devices” and locate “PyOCD there”. If it is not shown, click the download button and install the PyOCD package:
- Once PyOCD is selected, specify the full path to the pyocd-gdbserver.exe executable (normally located in the <Python>\scripts directory) and choose your target:
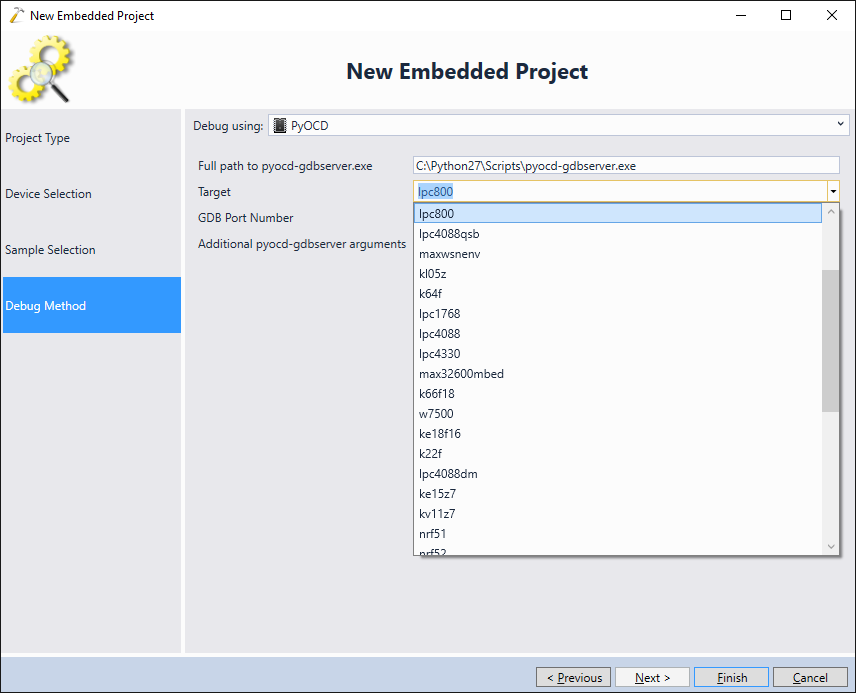 Note that as PyOCD support is more basic compared to OpenOCD, so it won’t automatically recognize/fix driver issues and won’t support live variables, profiling and other features that require background memory reads.
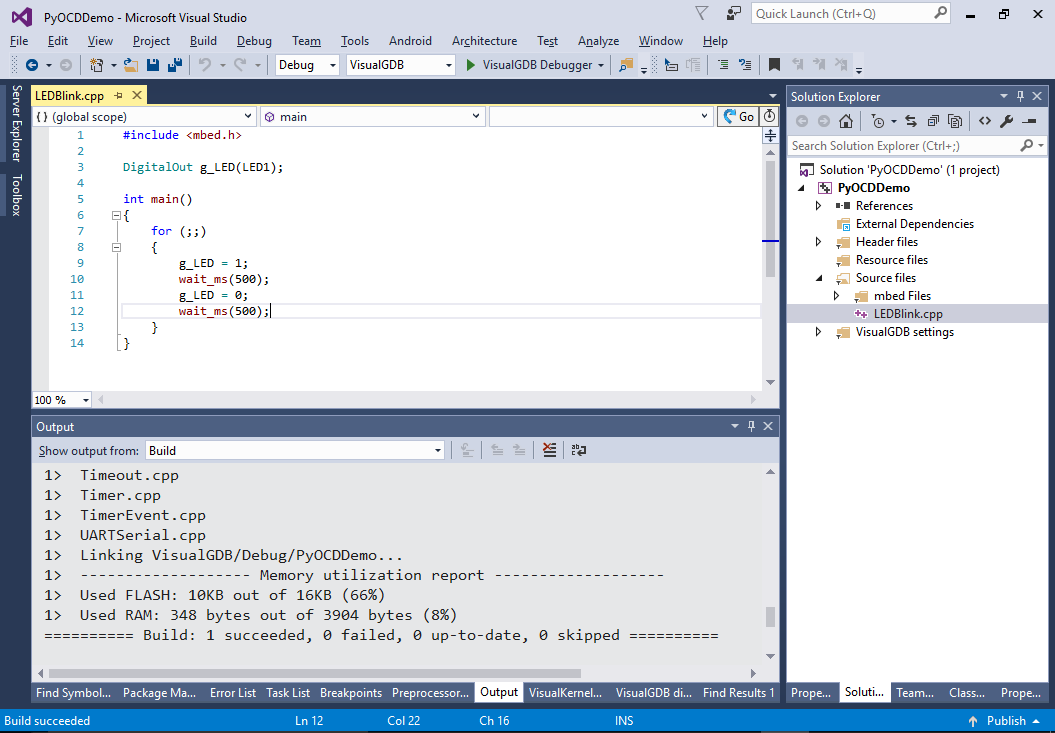
 - Press “Finish” to create the project. Build it with Ctrl-Shift-B:
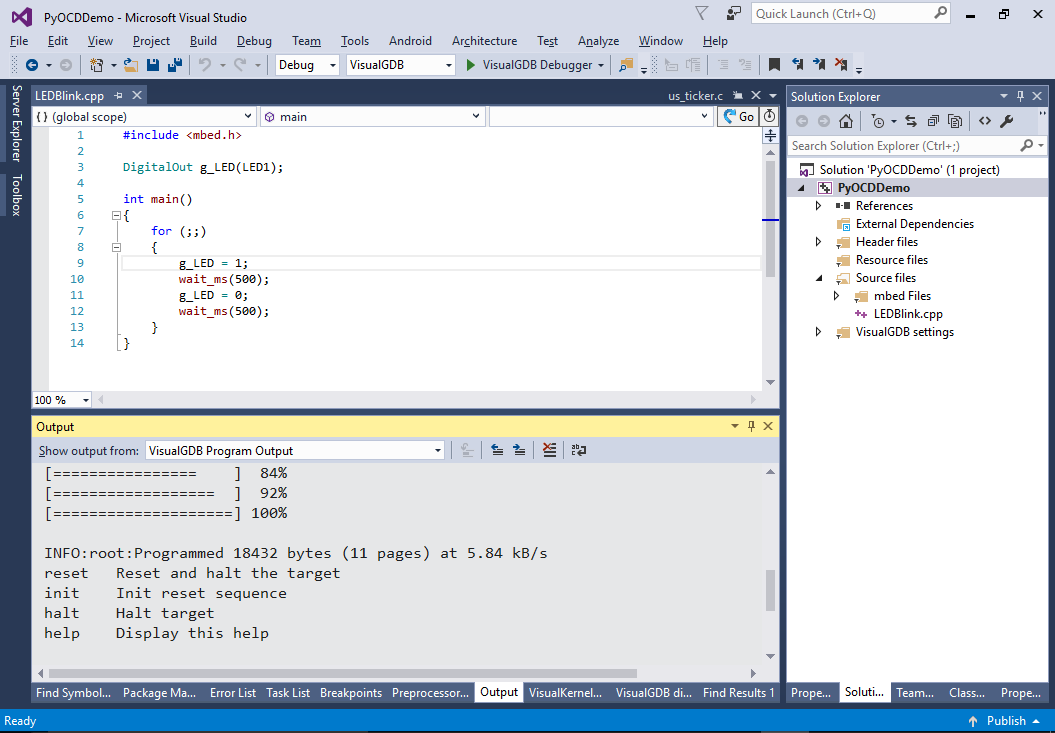
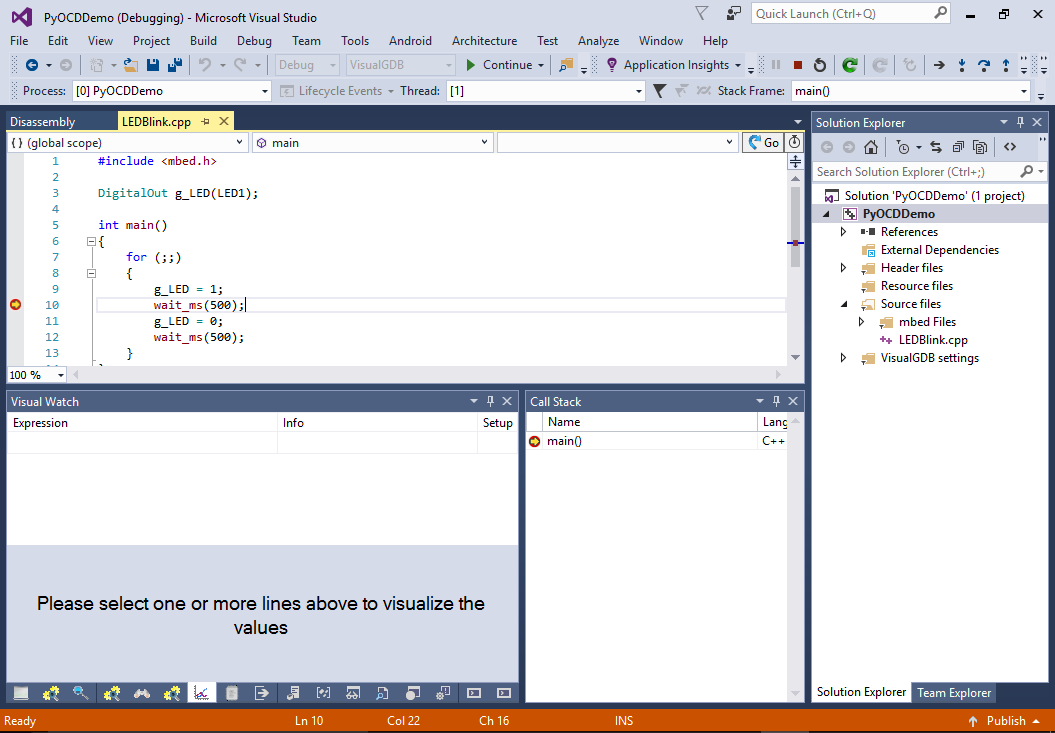
- Now you can set a breakpoint in main() and press F5 to start debugging. Your breakpoint will hit as soon as the code reaches that point:
- The PyOCD output will be displayed in the “VisualGDB Program Output” pane, so you can use it to diagnose PyOCD issues.