Adding External Memories to Embedded Projects
This tutorial shows how to add support for an external off-chip memory, such as a NOR FLASH to a VisualGDB Embedded Project, place some code and data into it and configure VisualGDB to program it automatically. In this example we will use the QSPI memory on the STM32F7-Discovery board. We will map it to the microcontroller’s address space and show how to offload some code and data there to reduce the utilization of the on-chip FLASH memory.
Before you begin, install Visual Studio and VisualGDB.
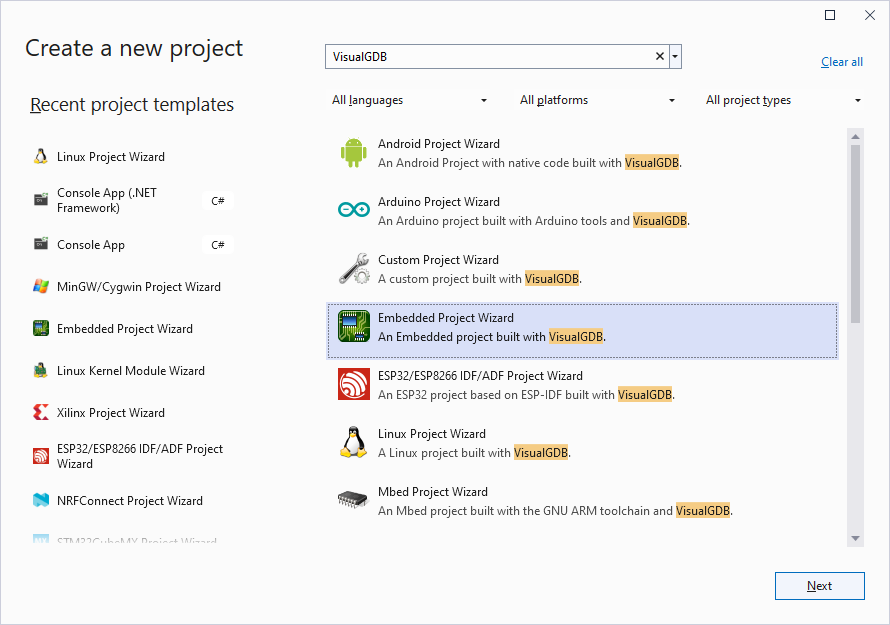
- Start Visual Studio and open the VisualGDB Embedded Project Wizard:
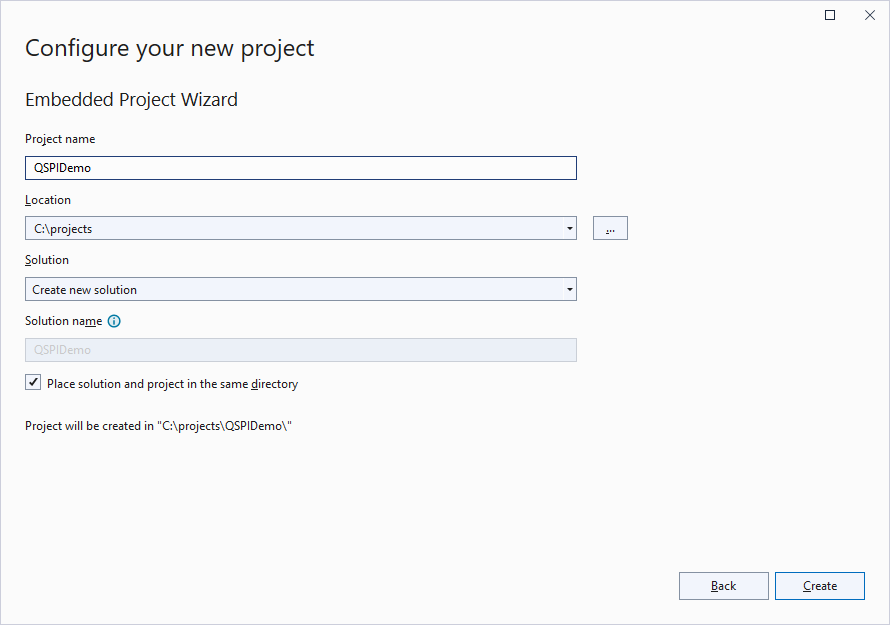
- Enter the name and location for your project:
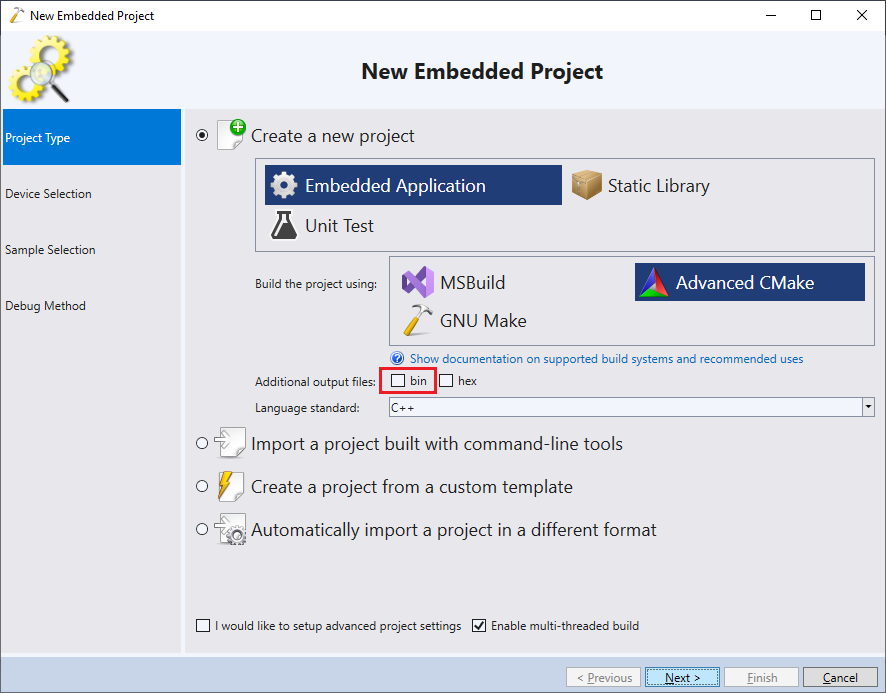
- Proceed with the default “Embedded Binary” setting, but uncheck the “bin” checkbox, as trying to fit the contents of memories located far from each other would result in a very big binary file:
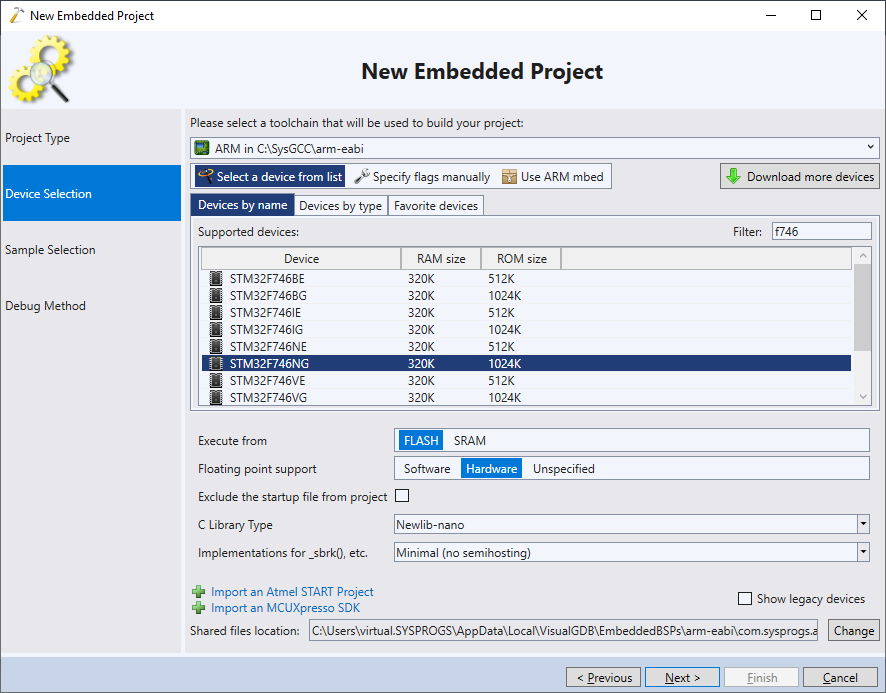
- Select your device from the list. In this example we will use the STM32F746NG microcontroller that is installed on the STM32F7-Discovery board:
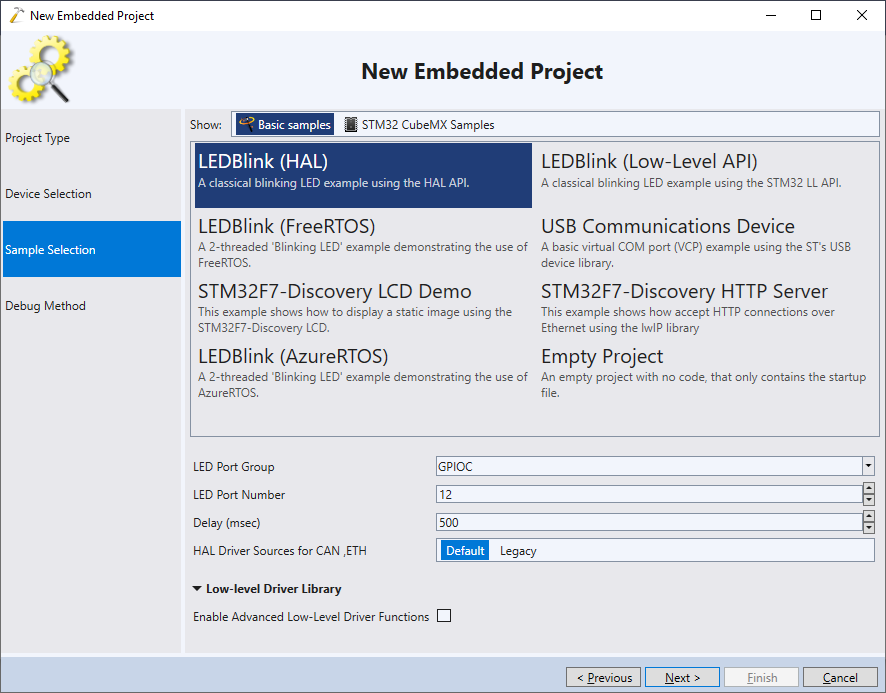
- Select the “LEDBlink (HAL)” sample and select the LED group and port that corresponds to your board layout. For STM32F7-Discovery we select GPIO1 and port 1:
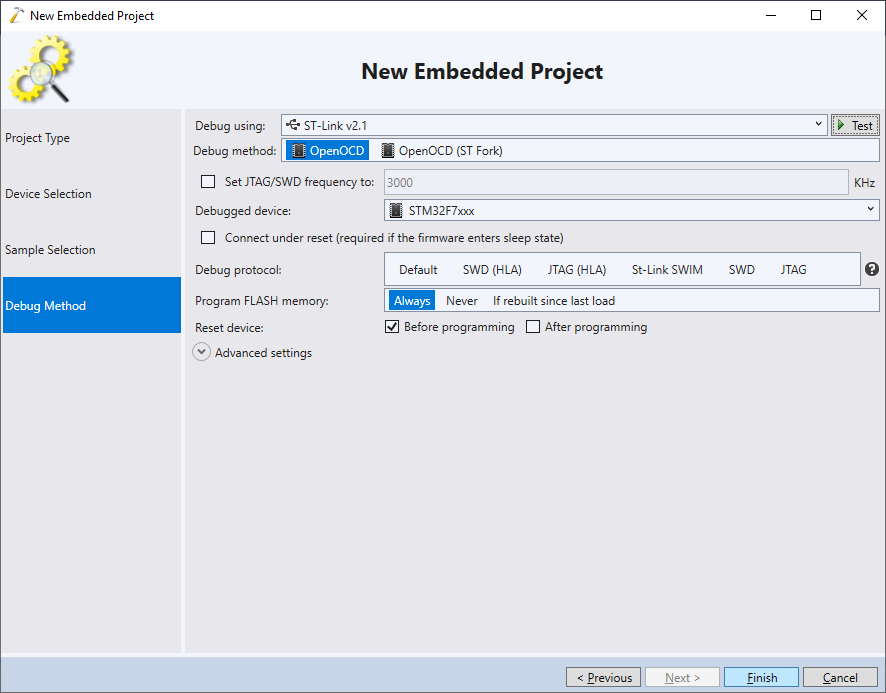
- Select the debugging method that works with your device. For most of the devices we recommend using OpenOCD. Connect your board (and external programmer if any) and allow VisualGDB to detect it. You can use the “Test” button to verify the connection:
- Click “Finish” to generate the basic project. Then add the QSPI FLASH driver file (QSPIRoutines.cpp) to your project:
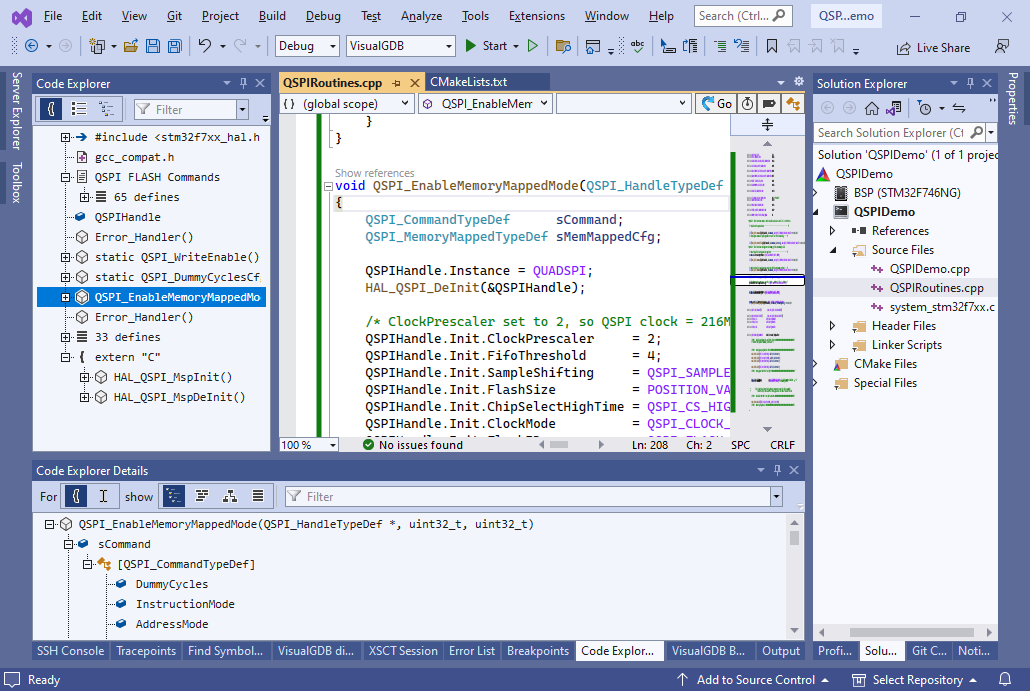
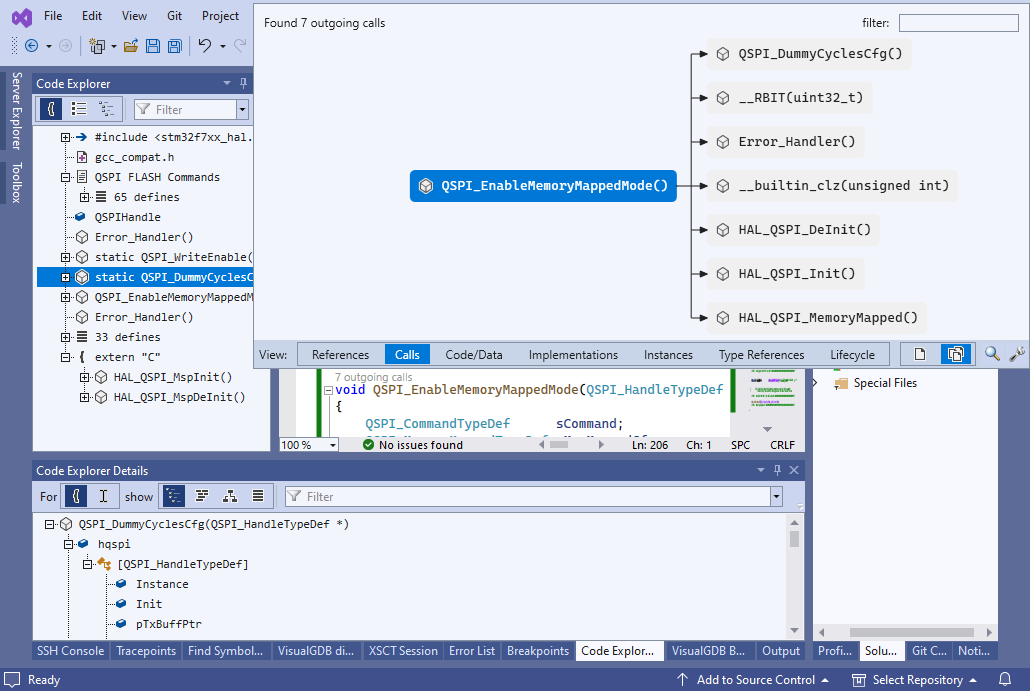
- The QSPIRoutines.cpp file contains QSPI FLASH setup functions copied from the ST’s QSPI_ExecuteInPlace example. If you are using a different board, you may need to adjust those functions. You can use the VisualGDB’s Code Jumps popups to get a quick overview of the QSPI-related functions and relations between them:
- QSPI_EnableMemoryMappedMode() is the main function that maps the QSPI FLASH to address 0x90000000
- Functions like QSPI_DummyCyclesCfg() and QSPI_WriteEnable() configure the external FLASH memory chip by writing chip-specific commands
- Functions like HAP_QSPI_Transmit() are provided by the STM32 HAL library and are responsible for delivering the commands to the chip
- Move the code responsible for the blinking LED to a function called FunctionInQSPIFLASH() and edit the main source file to call the QSPI_EnableMemoryMappedMode() function before calling the LED blinking function:
QSPI_HandleTypeDef QSPIHandle;

int main(void)
{
    HAL_Init();
    QSPI_EnableMemoryMappedMode(&QSPIHandle, 0, 0x10000);
    FunctionInQSPIFLASH();
}
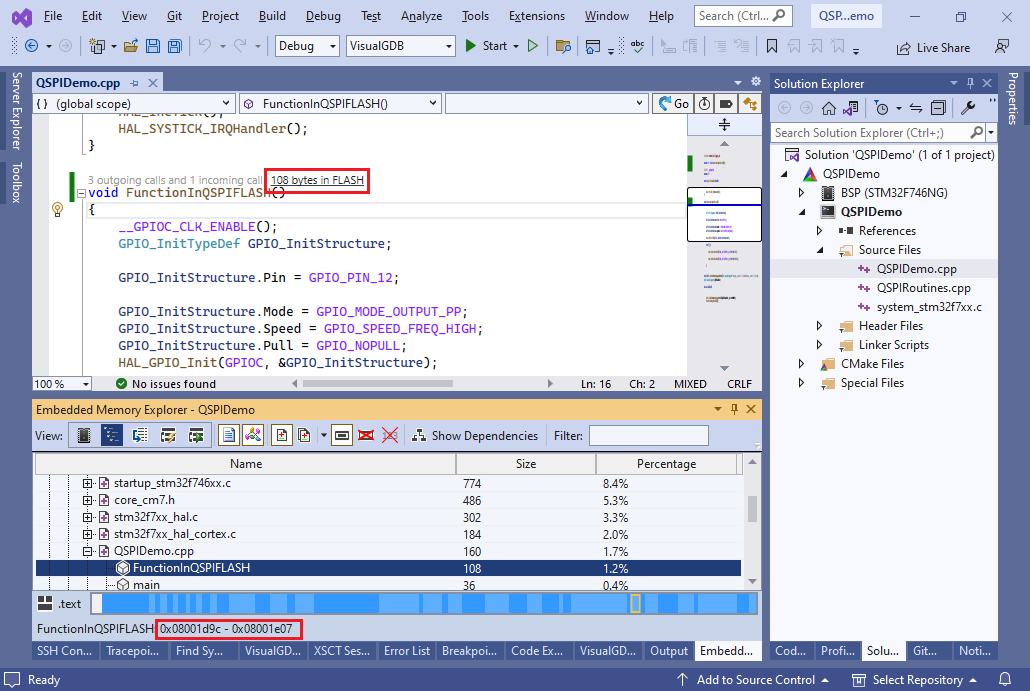 Note that we have NOT placed the function to the QSPI FLASH yet, so the function will reside in normal FLASH memory. Build the project and note how the FunctionInQSPIFLASH got placed in the regular 0x0800xxxx range.
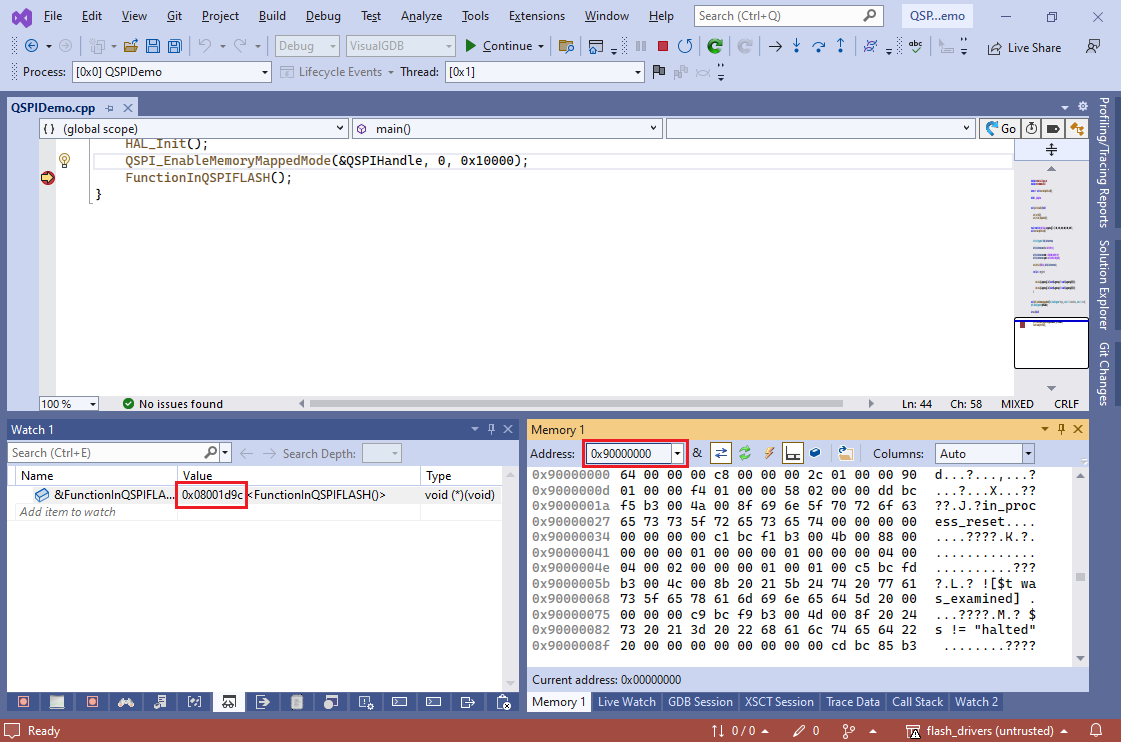
 - Set a breakpoint at the call to FunctionInQSPIFLASH() and hit F5 to start debugging. Once the breakpoint is hit verify that the address of FunctionInQSPIFLASH is still inside the main FLASH area (0x08xxxxxx) and that the memory at address 0x90000000 is readable (it should show contents of the actual QSPI FLASH memory programmed by any previous QSPI-based program that ran on the board):
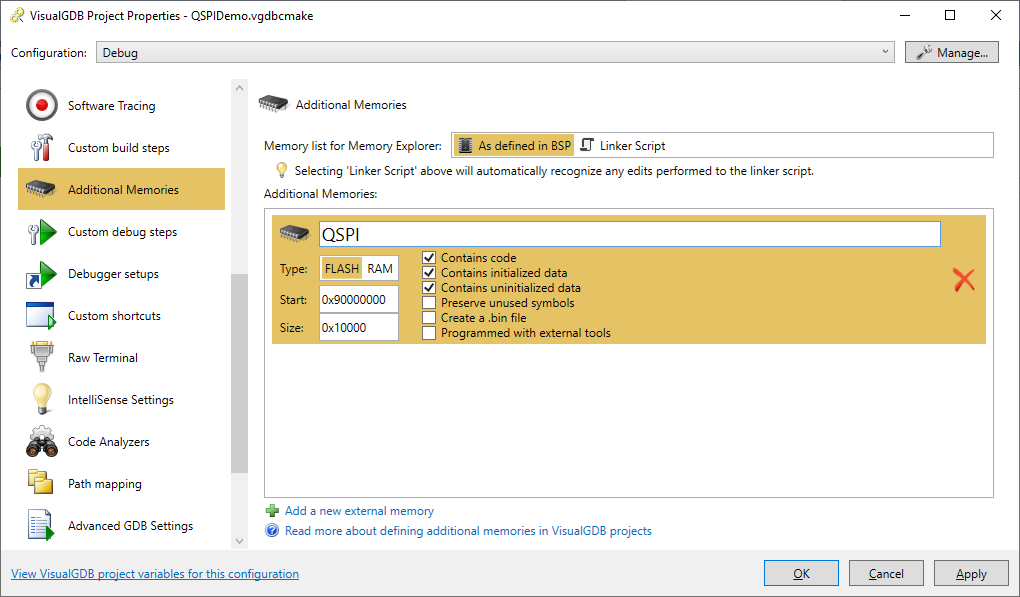
- Now we will actually configure the project to use the QSPI memory. Open VisualGDB Project Properties and go to the Additional Memories page. Add a new memory called QSPI at address 0x90000000. In this example we will limit the memory size to 64K (0x10000), however you can specify the actual QSPI FLASH chip size as well:
 Note that the “Additional Memories” feature is supported on VisualGDB Custom Edition and higher.
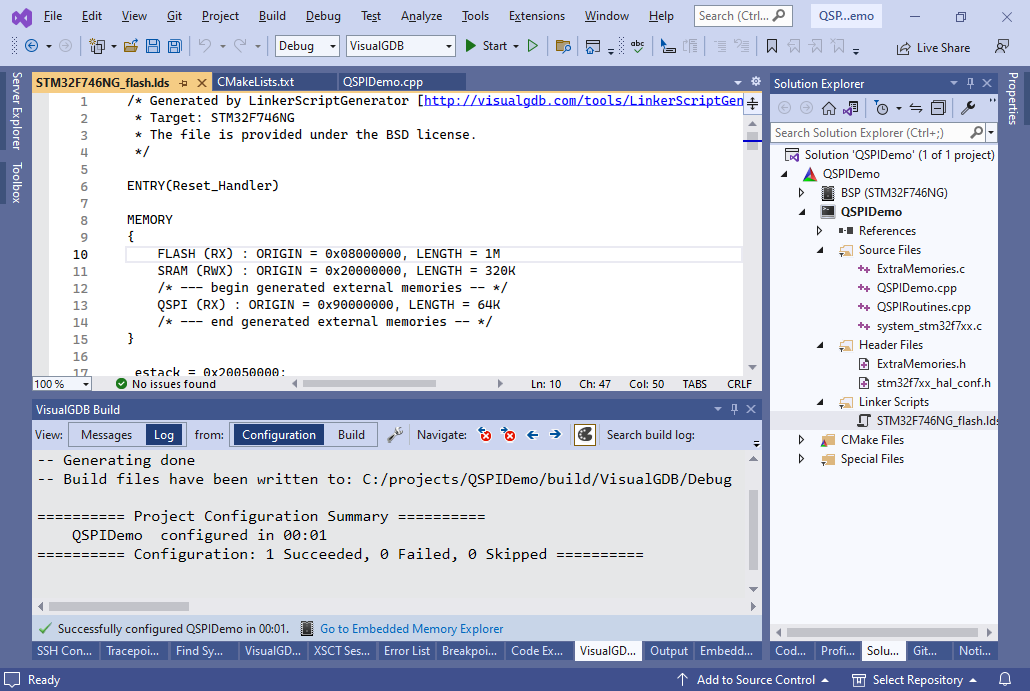
 - Press OK to apply the settings. Note how VisualGDB has created a copy of the linker script file and inserted the memory definition lines there. When you edit the external memory settings, VisualGDB will replace the lines between “— begin generated xxx —” and “— end generated xxx –” lines, preserving the rest of the linker script:
- VisualGDB as also added an ExtraMemories.h file that defines macros for placing your functions and variables to the external memories:
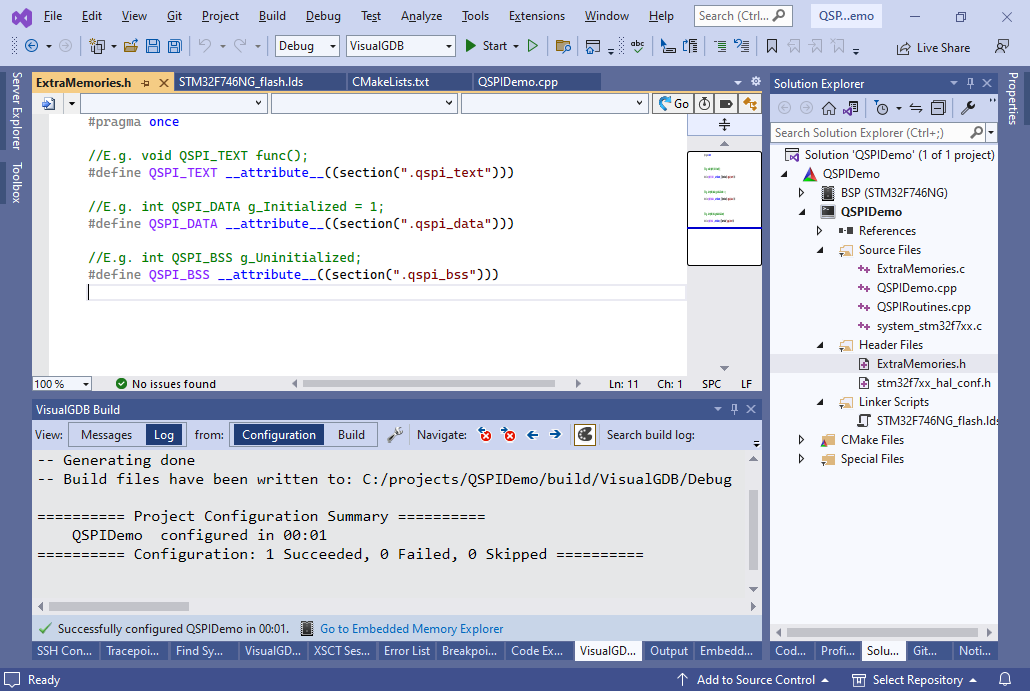
- Include the “ExtraMemories.h” file from your main file and add the QSPI_TEXT macro to the declaration of FunctionInQSPIFLASH(). Then build your project:
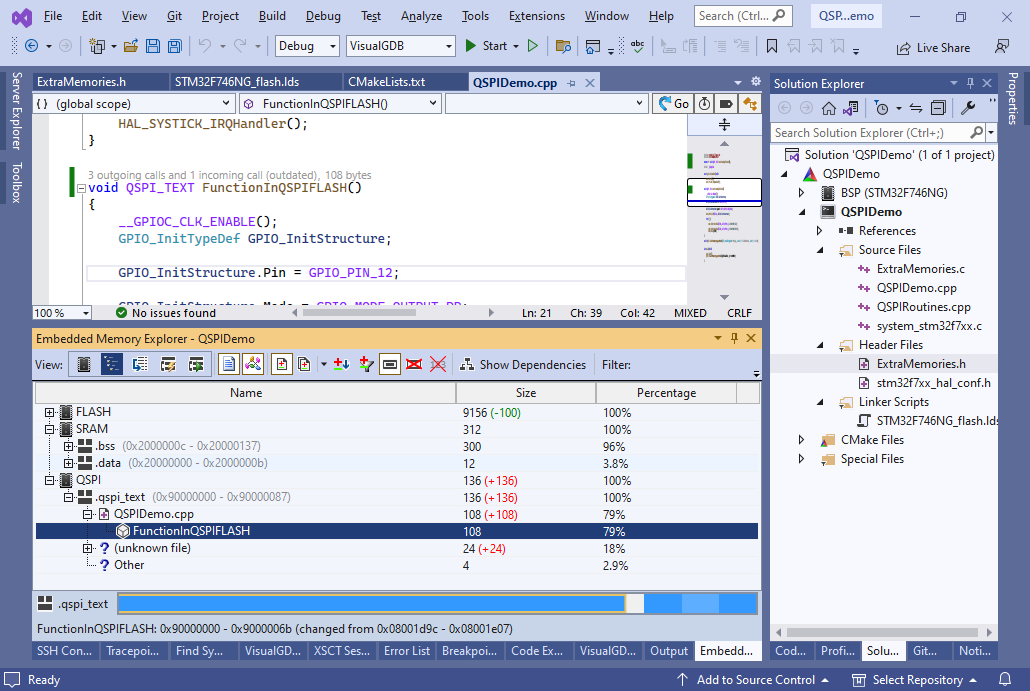 Note how the used FLASH size has reduced and the FunctionInQSPIFLASH got moved to a new memory called QSPI.
 - If you try to start debugging your project now, you will see that although the main FLASH memory expects the FunctionInQSPIFLASH() to be at address 0x90000000, the actual data at this address is different. This happens because OpenOCD does not know how to program the QSPI FLASH. This can be fixed by downloading the QSPI FLASH plugin for OpenOCD, or building it as described in this tutorial and adding the following command to the OpenOCD command line:
-c "flash bank qspi plugin 0x90000000 0 0 0 0 $(ProjectDir.forwardslashes)/stm32f7disco_qspi.elf"

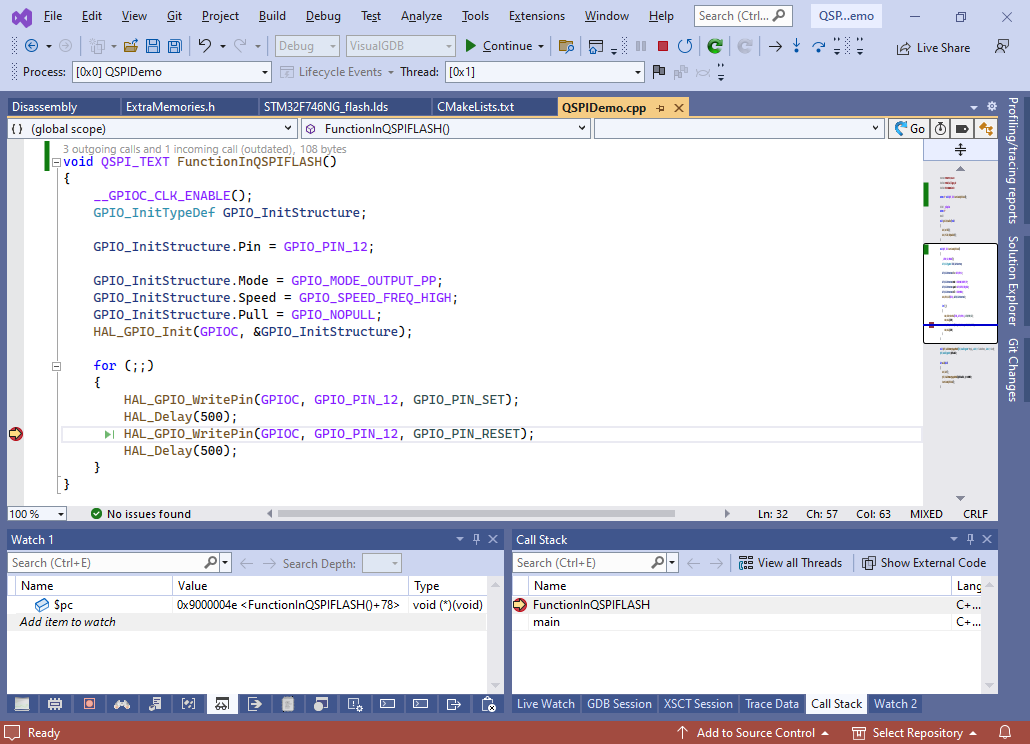
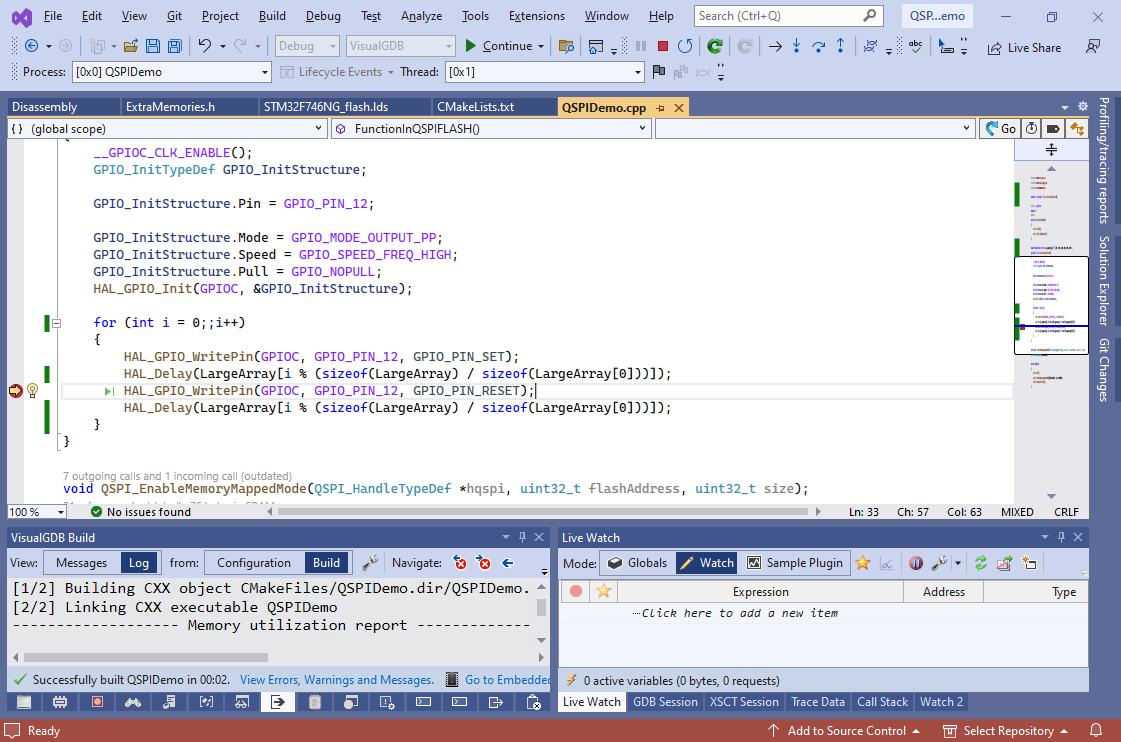
- Now you can simply press F5 to automatically program the chip and begin debugging it. As of September 2023, OpenOCD now properly supports setting hardware breakpoints in QSPI memories, so you can set a breakpoint in FunctionInQSPIFLASH() and wait for it to hit:
- Now we will show how to place a pre-initialized array into the QSPI FLASH memory without increasing the utilization of the normal FLASH. Declare a static const array with the QSPI_DATA macro and change FunctionInQSPIFLASH() to use it:
static const int QSPI_DATA LargeArray[] = { 100, 200, 300, 400, 500, 600 };
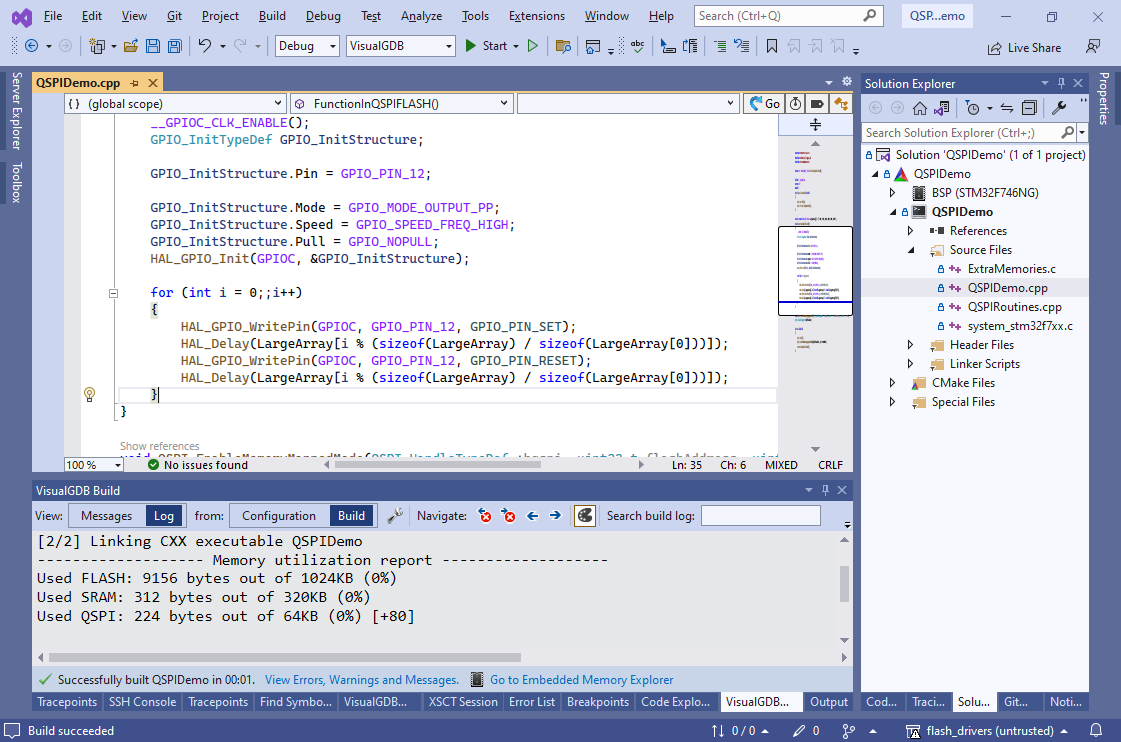 Build your program and observe how the QSPI utilization has increased while the FLASH and RAM utilizations were unchanged.
 - You can launch debugging with F5 (don’t forget to re-program the QSPI memory using the ST-Link tool unless you have automated this using the OpenOCD plugin) and see that LargeArray got placed to QSPI FLASH after the FunctionInQSPIFLASH:
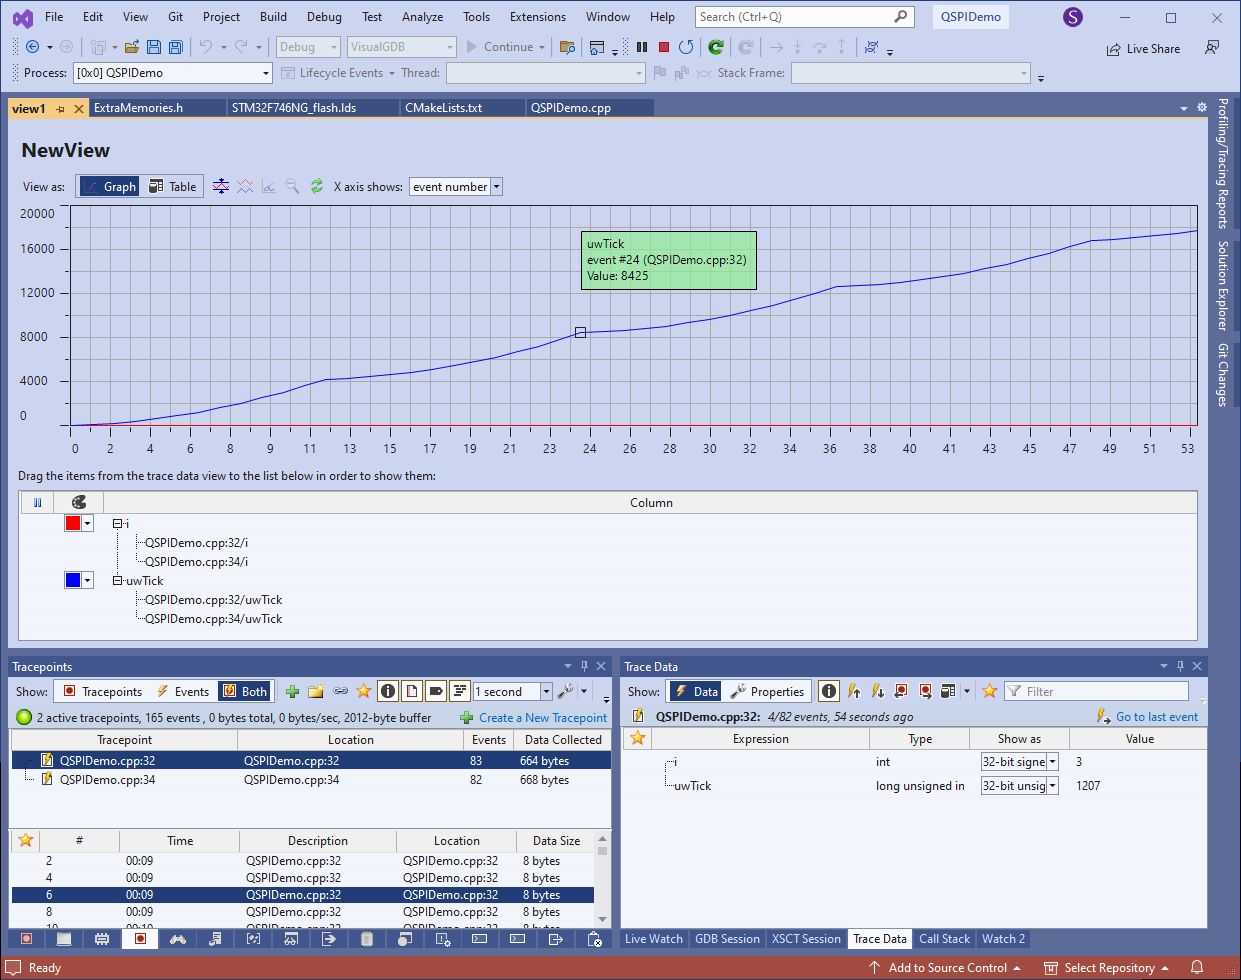
- If you are using VisualGDB Custom Edition 6.0 or later, you can set tracepoints instead of breakpoints to quickly record what the program is doing without actually stopping it. Try enabling software tracing as shown here and setting a tracepoints on the calls to HAL_Delay() tracing the values of TickCount and i. If you run the program now, you will immediately see how these lines get executed in real time:
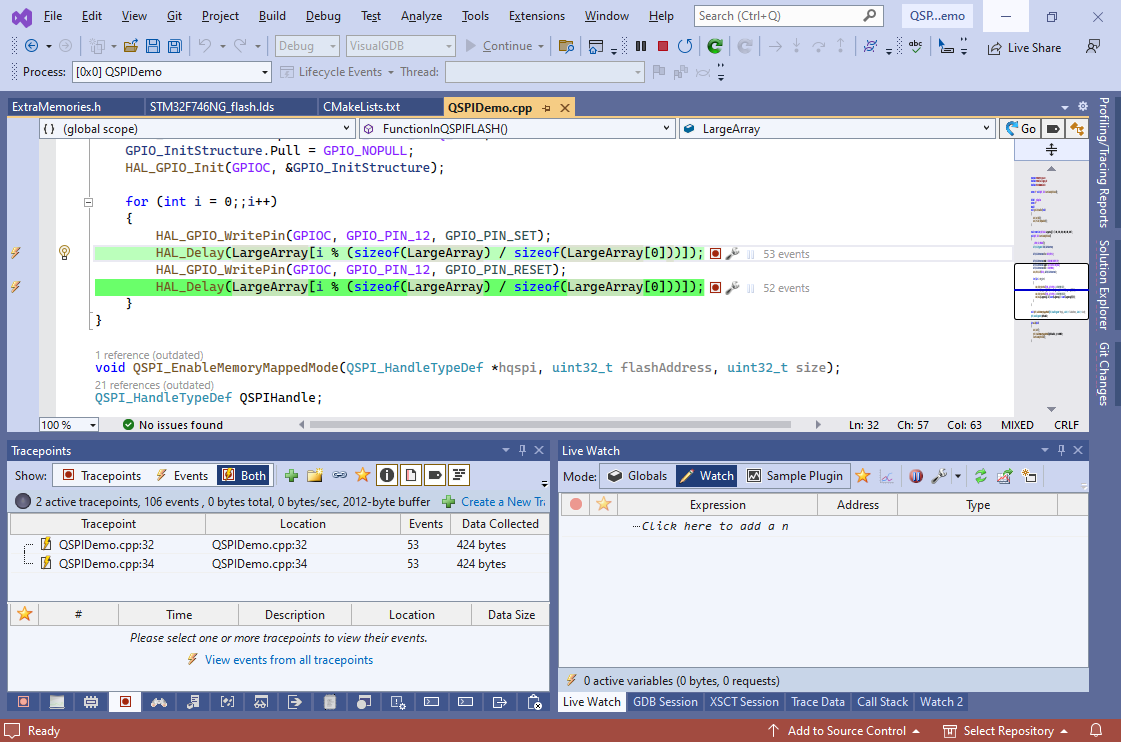
- You can use the tracepoints/trace data windows to review each recorded invocation of the HAL_Delay() line, or create a trace data view to quickly visualize how the variable values changed over time: