GDB Session window
When you start a debug session with VisualGDB, it will open a GDB Session window that shows the interaction between VisualGDB and the low-level GDB debugger, and also allows configuring various parameters of the debug session: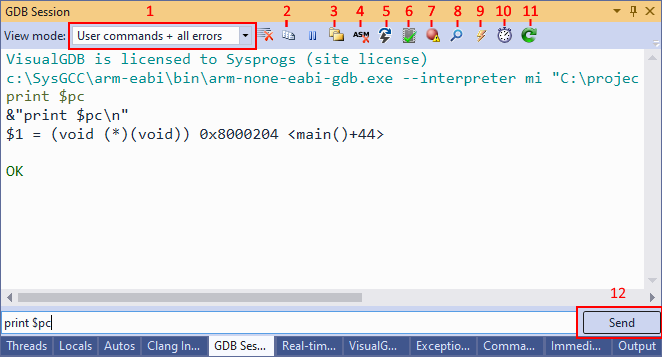
This page provides an overview of the controls in the GDB Session window and explains their functionality.
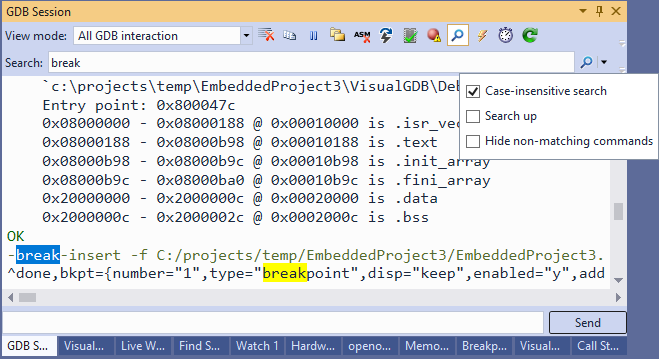
- View Mode controls the commands that will be shown in the GDB Session window. Normally, VisualGDB will only show the custom commands executed via the ‘send’ button, and critical errors. However, if you are troubleshooting strange gdb behavior, you can change the view to “All GDB interaction”. This will show the commands that were automatically executed by VisualGDB (e.g. setting breakpoints). You can then use the search button to quickly find the relevant commands and understand how GDB responded to them.
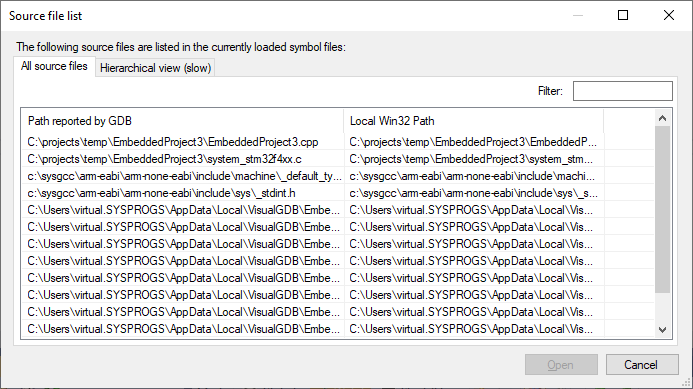
- Source File List button displays all source files known to GDB at the moment. This list is derived from the debug symbols stored in the debugged executable and is independent from the contents of Solution Explorer. Use this button to troubleshoot problems with debug symbols, as it will show the exact paths of source files reported by GDB (i.e. where it would accept breakpoints) and the Windows paths that correspond to them:
- Edit Path Mapping button allows setting path mapping rules between the paths seen by GDB and the physical paths on the Windows machine. It could be useful if the debugged executable was built on a different machine, or under a different path, and hence does not recognize breakpoints in the regular source file locations:

- Disassembly Shutoff button allows completely disabling disassembly-related commands for the rest of the debug session. It could be useful if the code often stops in the locations without any source code, and gdb takes considerable time fetching the disassembly from the target.
- Stepping over Interrupts. This button modifies the behavior of the “step into” command to automatically step over interrupts. It only works for barebone ARM targets that support this feature.
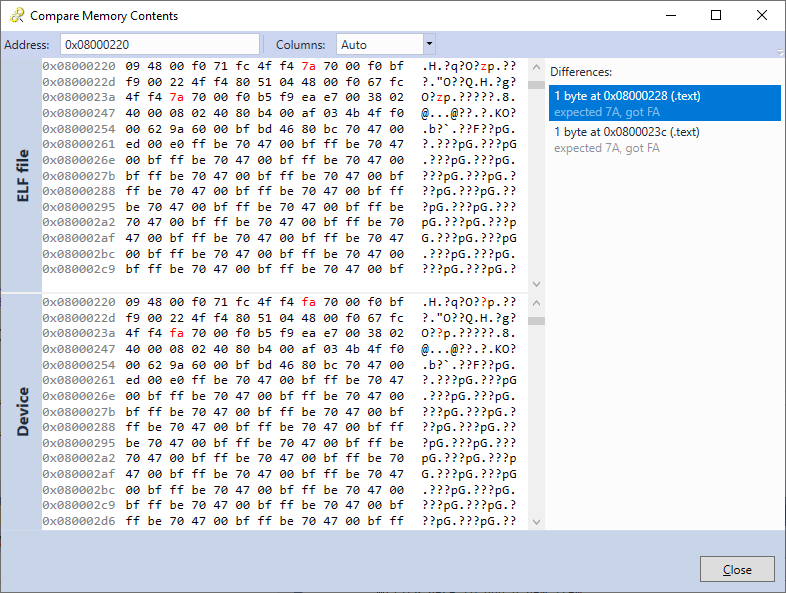
- Memory Verification button allows comparing the physical contents of the target memory against the debugged ELF file. It simplifies troubleshooting the cases where the FLASH memory could not be programmed correctly, or got overwritten during runtime:
- Breakpoint Diagnostics button can automatically troubleshoot path mapping problems between the debug symbols and the source directories on the Windows machine.
- Search button can be used to quickly locate various commands in the GDB session log and see the reply from gdb. It is especially useful combined with the “All GDB Interaction” view mode:
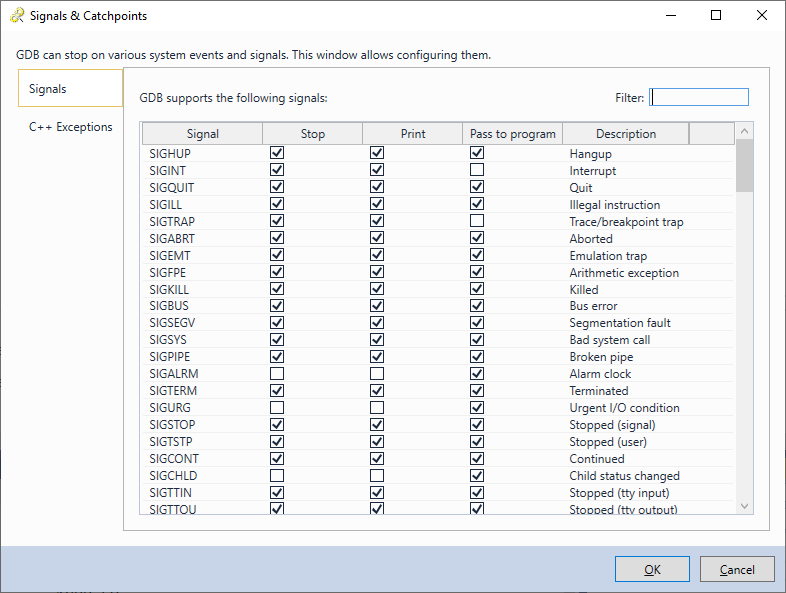
- Signals button allows configuring how the exact GDB signals and C++ exceptions will be treated by VisualGDB:
- Timing button allows analyzing the exact time taken by various gdb commands and could be useful in optimizing debugging performance:

- Reset button restarts an embedded target by sending a low-level reset signal.
- Send button allows sending custom commands to GDB. Note that common commands like “break” and “step” will be automatically translated to global Visual Studio commands, so it will not lose synchronization with the underlying gdb session.