Observing ITM Trace Output from ARM Targets with Segger J-Link
This tutorial shows how to configure VisualGDB to view the debug output produced by ARM targets via the ITM_SendChar() function. We will create a basic project for the nRF52840 device using Segger J-Link and will show how to configure VisualGDB to view the ITM output.
ITM is a mechanism that allows sending arbitrary text directly to the debugger, reusing the regular JTAG/SWD interface. It is supported by most ARM targets and works reliably with Segger J-Link probes when using the J-Link software. It is also theoretically supported by OpenOCD, however works less reliable.
Note that for most scenarios, we recommend using our Fast Semihosting mechanism instead. It relies on background memory reads and works much faster than ITM, or any other tracing mechanisms.
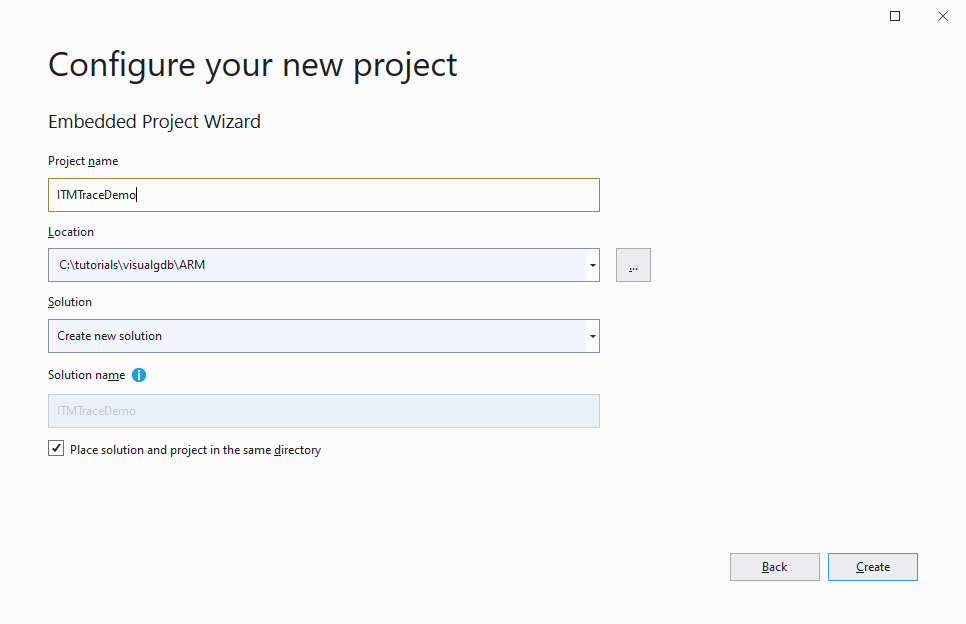
- Start Visual Studio and select the VisualGDB Embedded Project Wizard. Then pick the name and location of the project:
- Proceed with creating a new embedded binary using MSBuild:

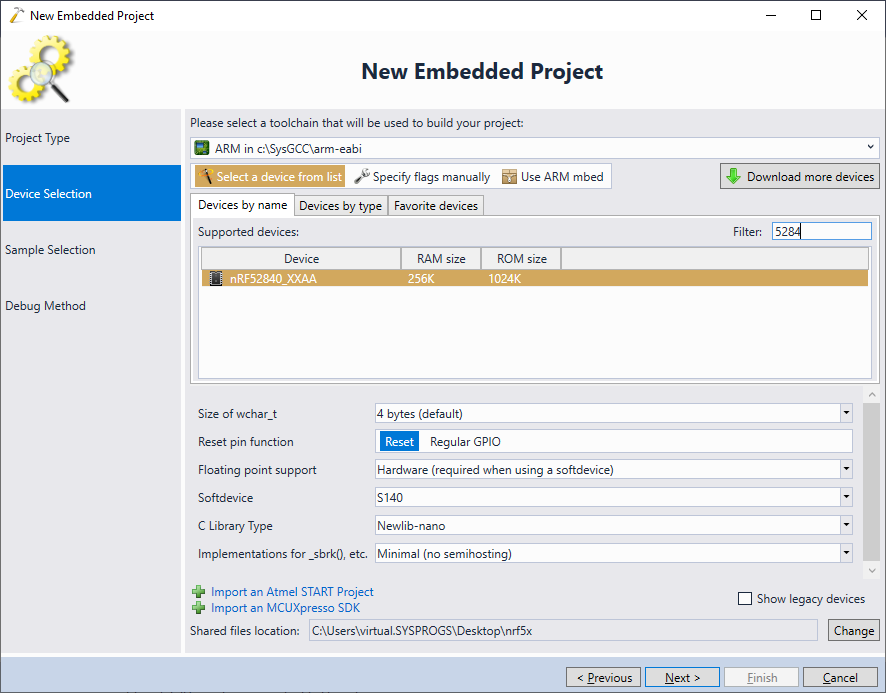
- On the next page select your toolchain and device. ITM tracing will work with most ARM-based targets. In this tutorial we will use the Nordic nRF52840 device, as its evaluation board includes an on-board J-Link debug probe:
- Pick a sample project to clone. In this tutorial we will use the basic “LEDBlink (BSP)” sample:

- Finally, choose the debug settings that work with your board. The ITM only works reliably with Segger J-Link, so make sure you are using the J-Link software:
 For other debug methods, consider using the Fast Semihosting instead.
 - Press “Finish” to generate a project based on the sample. Then add the following function to the main file and call it from main():
static void ITMPrint(const char *pString)
{
    for (const char *p = pString; *p; p++)
        ITM_SendChar(*p);
}
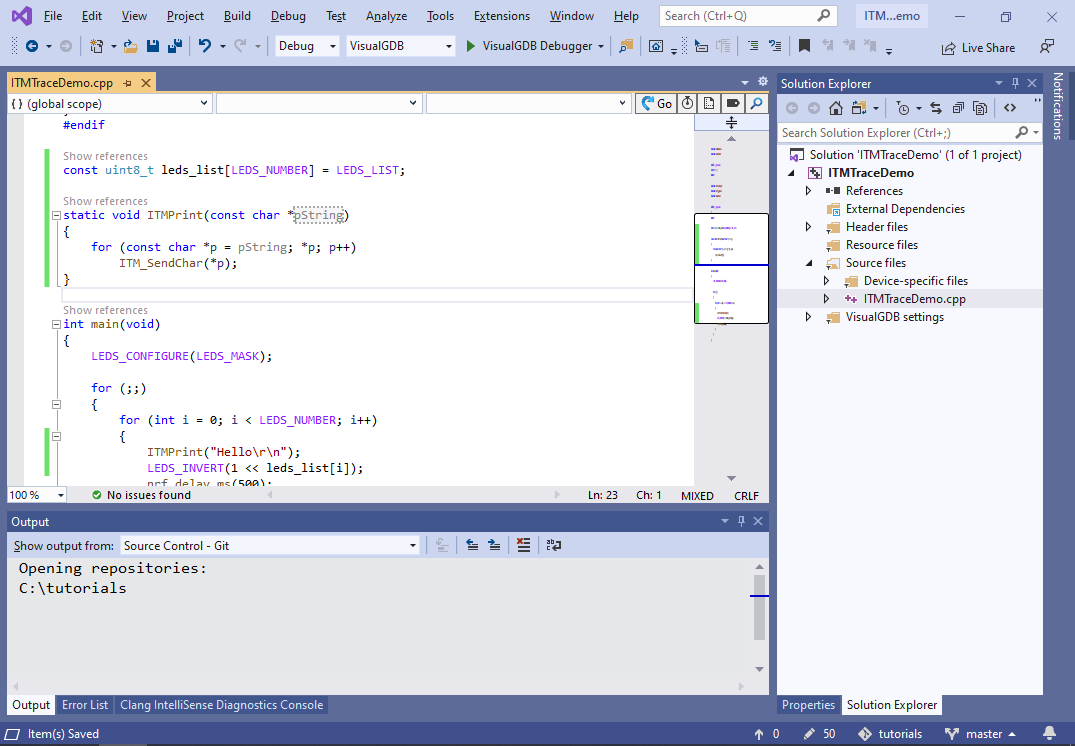
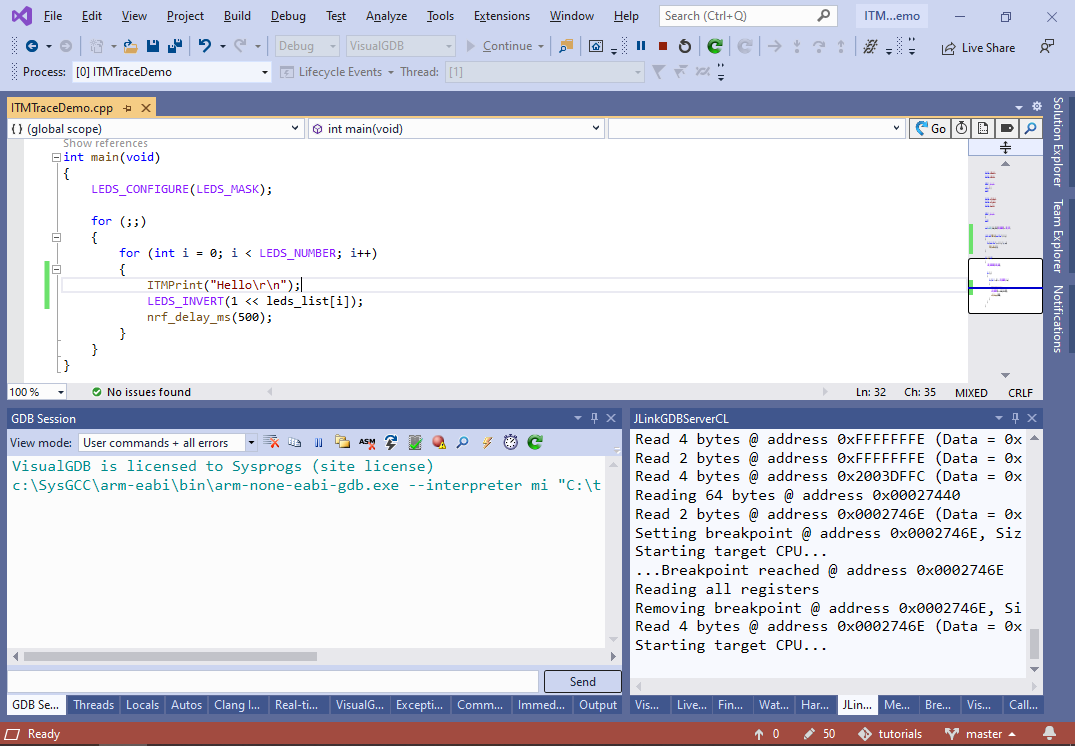
- If you just start debugging the project, the ITMPrint() function will work, however the output it produces will not be shown anywhere:
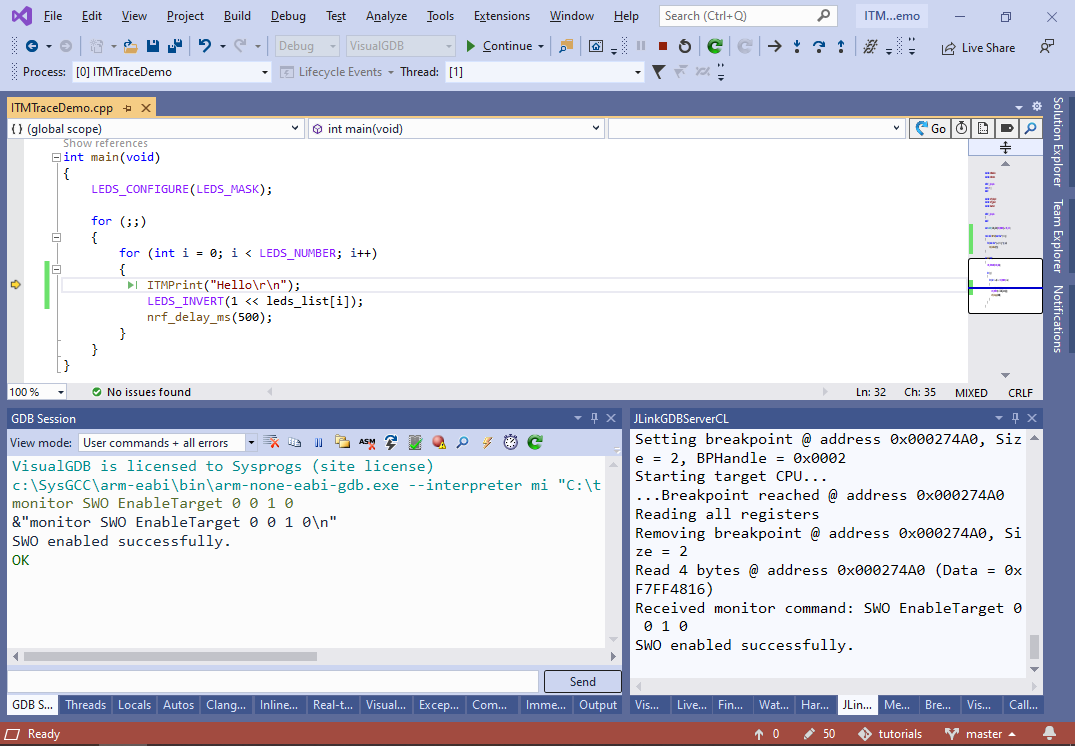
- To enable reading of the ITM messages, run the SWO EnableTarget command in the GDB session window:
monitor SWO EnableTarget 0 0 1 0
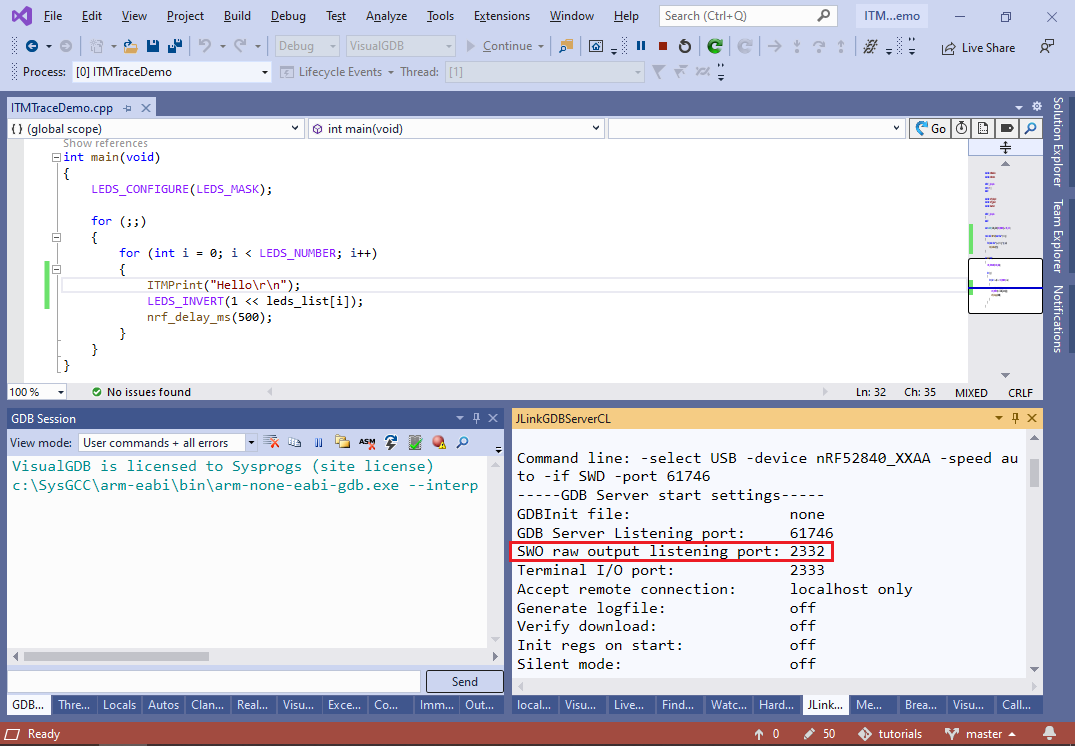
- Now you can connect to the port 2332 on localhost using telnet to see the output from printf. You can find out the exact port number (normally, 2332) in the J-Link window:
 Note that if you are using VisualGDB 5.5 or later, the output from JLinkGDBServerCL will be shown as one of the tabs inside the generic VisualGDB Output window that can be opened via a command under Debug->Windows.
 - To make the ITM output appear in VisualGDB GUI, add the “monitor SWO EnableTarget 0 0 1 0” command to the post-target GDB commands:

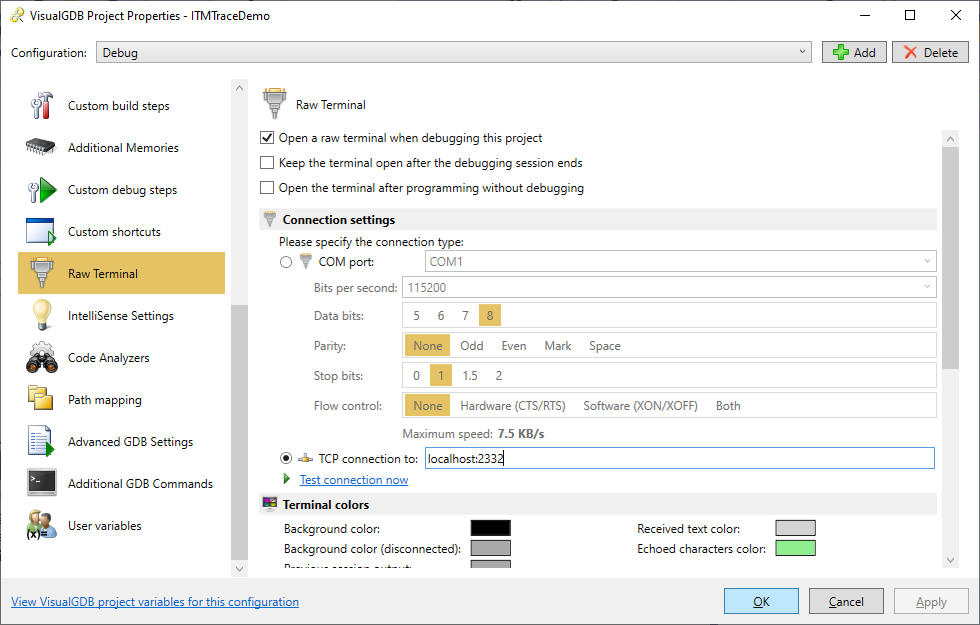
- Then enable the raw terminal (Custom edition and higher) to connect to that port:
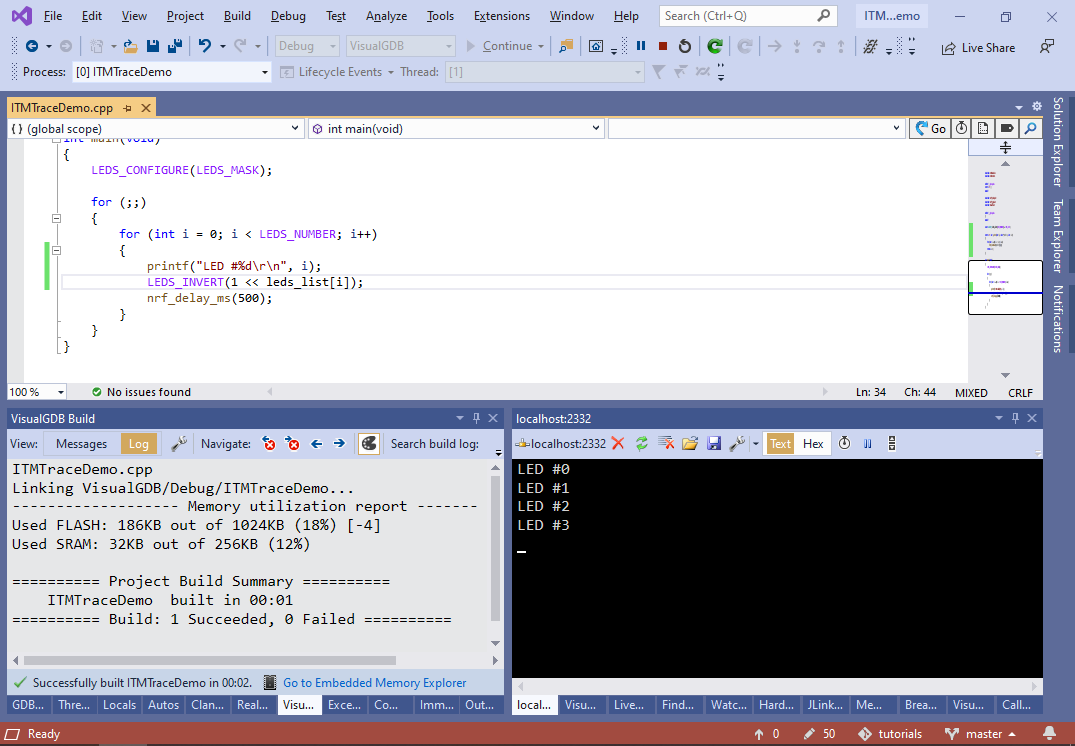
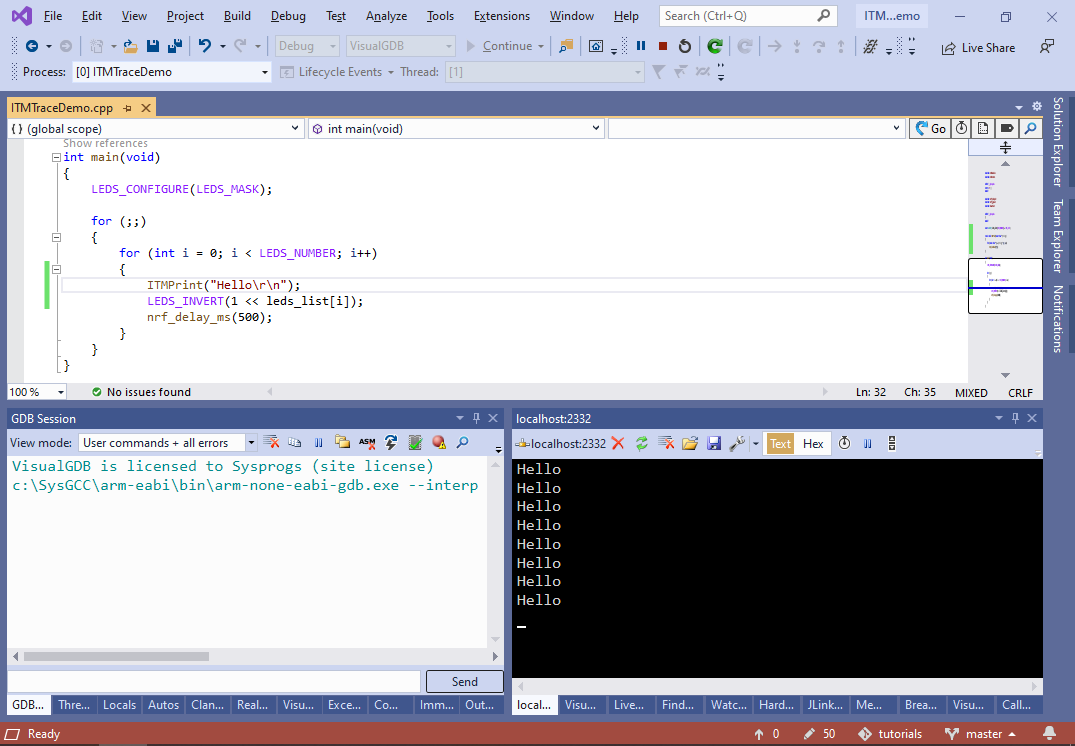
- Now you will see the output from ITM_SendChar() directly in Visual Studio:
- If the output from the Segger J-Link does not match the characters passed to ITM_SendChar(), the automatic detection of the CPU and SWO frequencies may not be working (or the CPU frequency could be changed after it was detected). In this case you may need to specify the CPU and SWO frequency explicitly in the “monitor SWO EnableTarget” command as shown on this page.
- You can also use the regular printf() call as long as you define a _write() function somewhere in your code:
extern "C" int _write(int fd, char *pBuffer, int size)
{
    for (int i = 0; i < size; i++)
        ITM_SendChar(pBuffer[i]);
    return size;
}