Troubleshooting Corrupt Toolchains
This page explains how to troubleshoot toolchain corruption problems that might prevent VisualGDB from building the projects.
When you create a new project with the VisualGDB Project Wizard, it will try running the gcc compiler from the selected toolchain to make sure it can compile code and produce valid executables. If the test fails, VisualGDB will display an error message as shown below: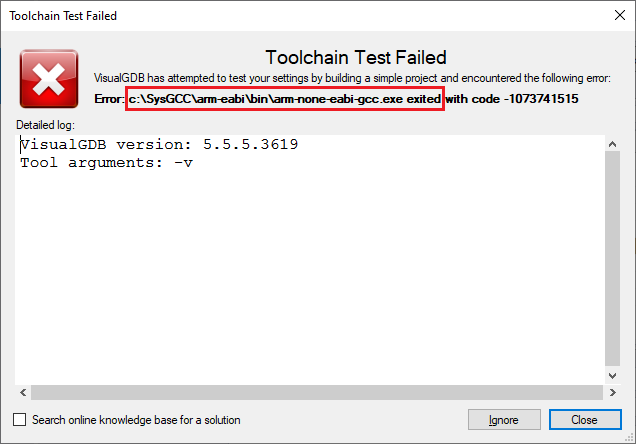 In order to troubleshoot this, try running the executable shown in the error message manually from the Command Prompt window. If the toolchain error is caused by a missing DLL, Windows will explicitly report it when running gcc manually:
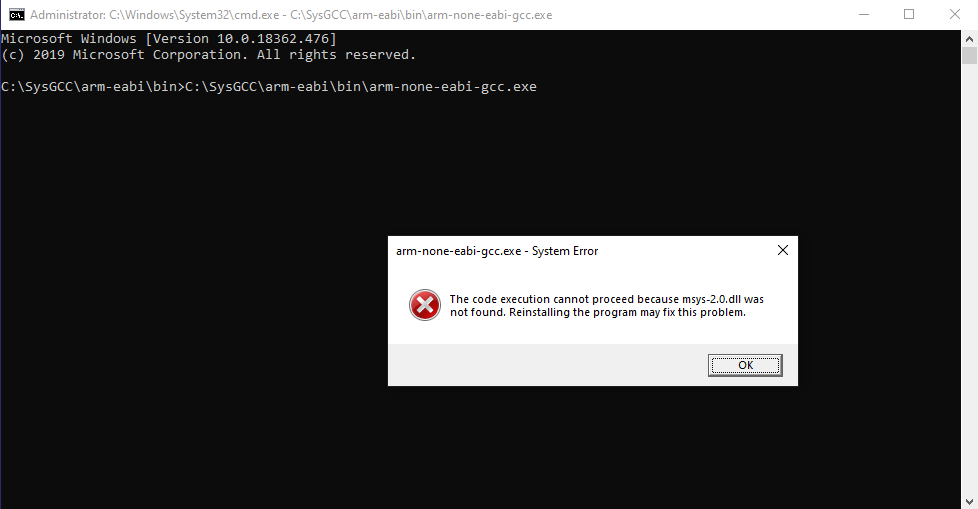 Copying the necessary DLLs to the directory of the gcc executable should resolve the issue (make sure you use compatible versions of the DLLs):
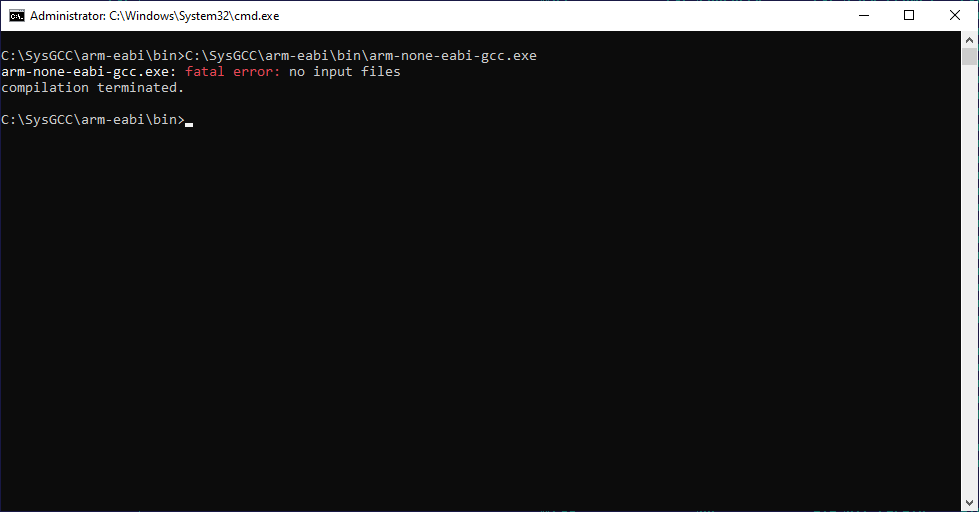
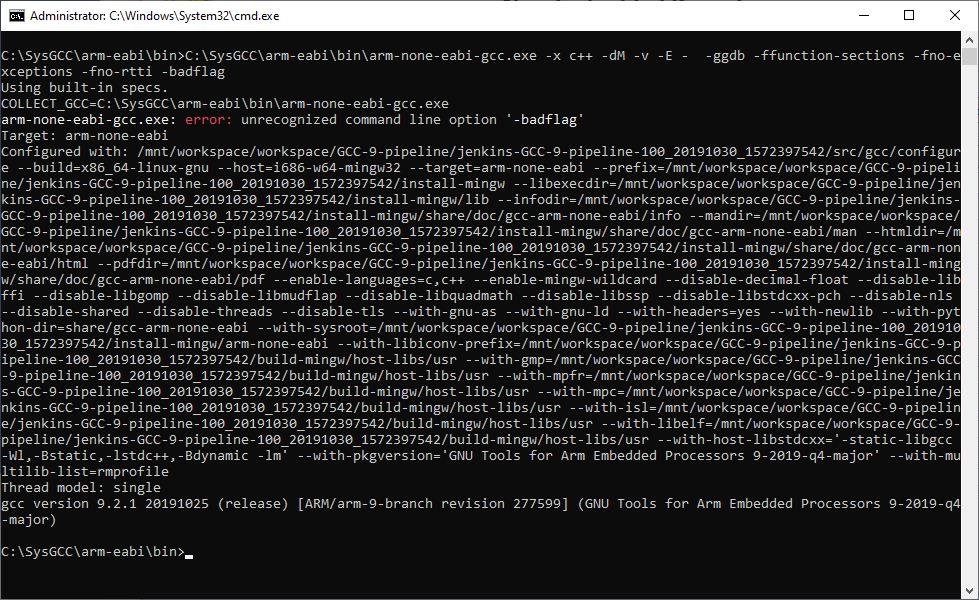
If running GCC without any arguments works as expected, the problem might be caused by some command-line flags (e.g. coming from a project template) that are not supported by the selected GCC. You can retest it by trying to run GCC manually with the flags shown by VisualGDB (make sure you select the “Tool arguments” until the end of the line by pressing Shift+End before copying them to Clipboard):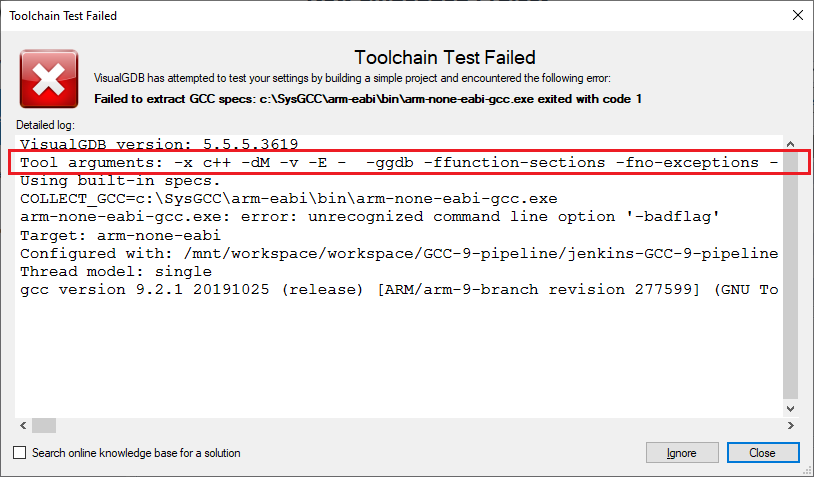 Running GCC with the same arguments manually will confirm the exact argument responsible for the error: