Developing ESP32 Arduino Projects with Visual Studio
This tutorial shows how to develop and debug Arduino projects for the ESP32-based boards using Visual Studio and the Advanced Arduino Project Subsystem of VisualGDB. We will create a basic “Blinking LED” project for the SparkFun ESP32 Thing board and will show how to navigate the code and debug the project.
Before you begin, install VisualGDB 5.4 Preview 4 or later.
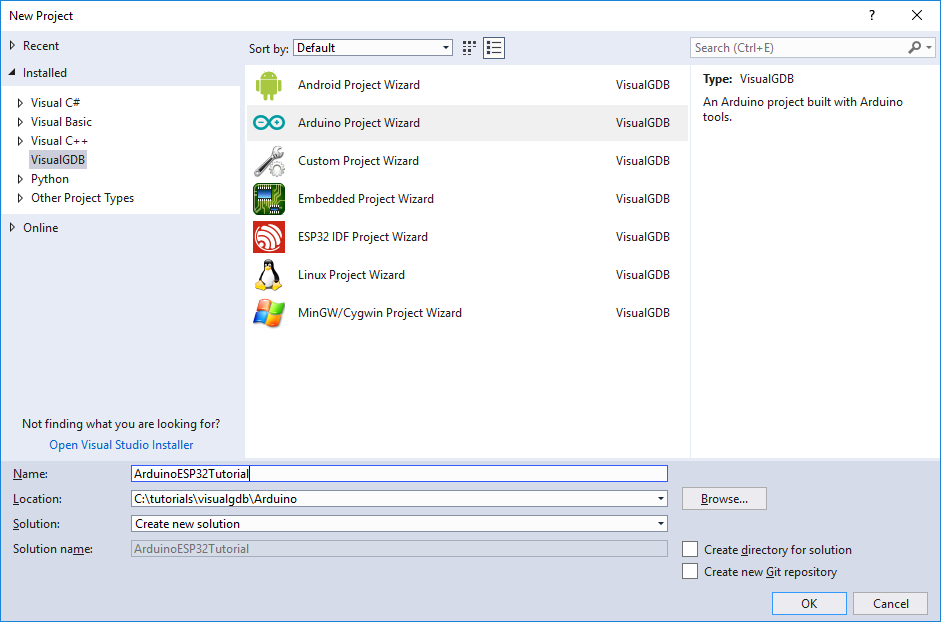
- Start Visual Studio and open the VisualGDB Arduino Project Wizard:
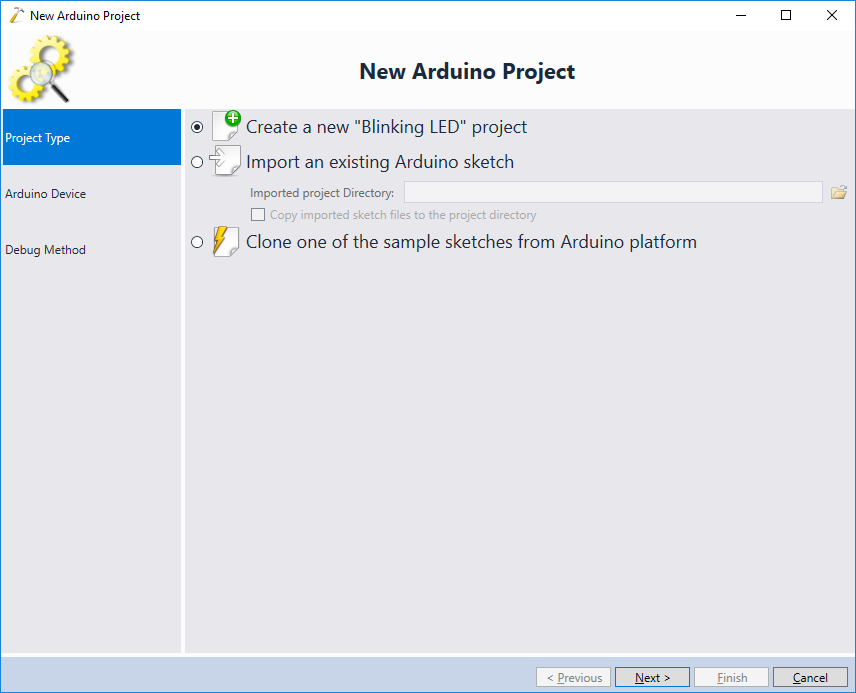
- Proceed with the default “Blinking LED” project:
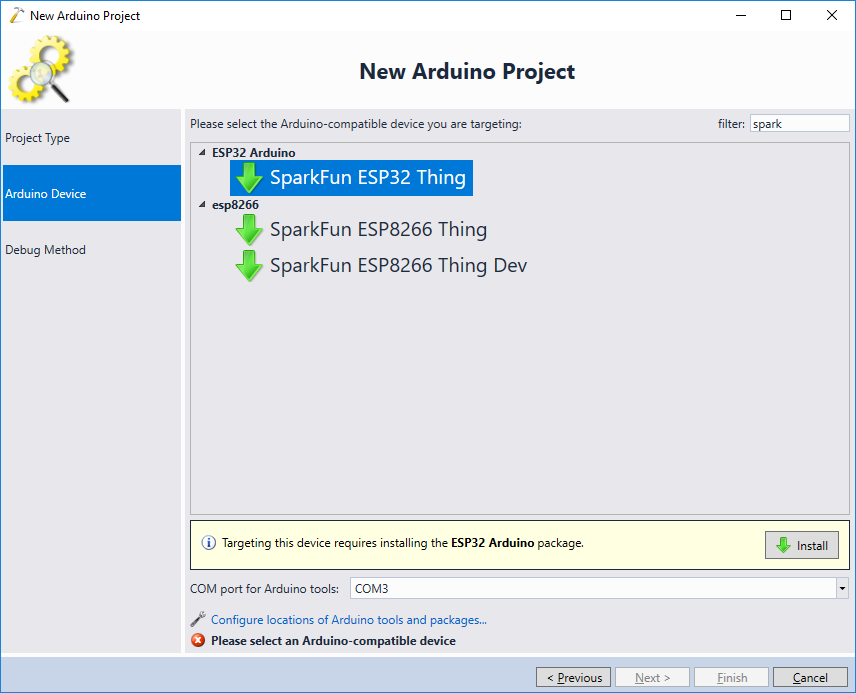
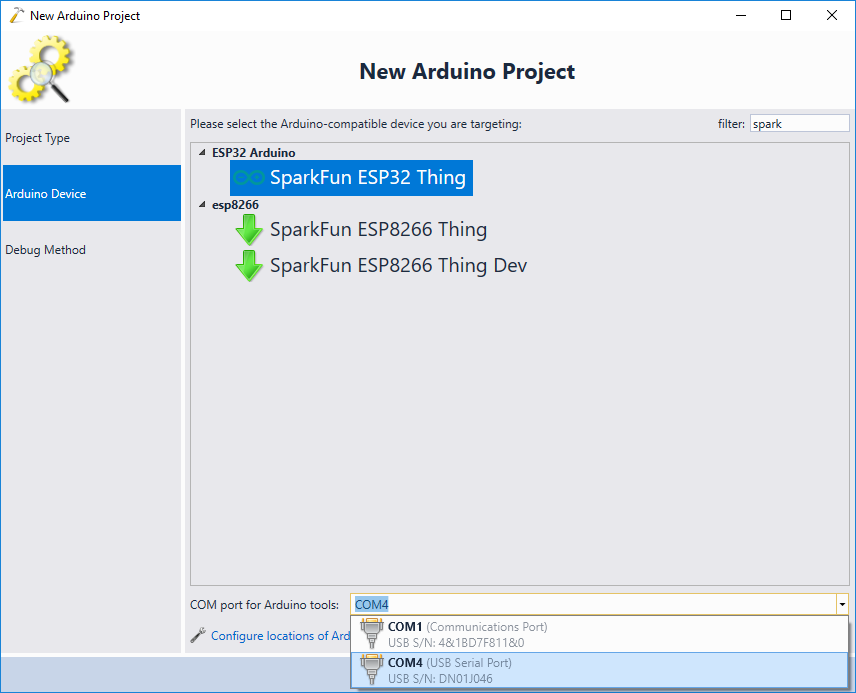
- On the next page select your ESP32 board. If you don’t see your board in the list, select any other ESP32-based board and click “Install” to automatically get the ESP32 Arduino core along with an up-to-date board list:
- Once you selected your board, connect it to the USB port and pick the COM corresponding to it below:
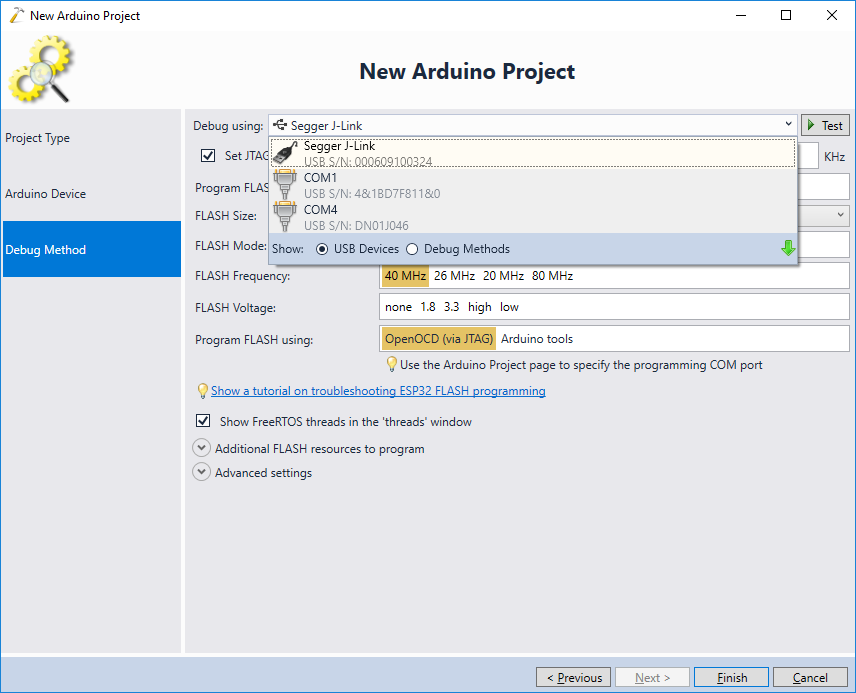
- Debugging ESP32 boards requires a JTAG debugger (e.g. Olimex ARM-USB-OCD-H or Segger J-Link). You can find detailed board-specific wiring instructions in our ESP32 tutorials (see this tutorial for SparkFun ESP32 Thing instructions). Connect your debugger to the board and plug it into the USB port. Select it in the “USB Devices” view to automatically configure it for debugging:
- Press “Finish” to generate the project. VisualGDB will generate an Advanced Arduino Project including both a basic sketch and the ESP32 Arduino core. Build it via Ctrl-Shift-B:
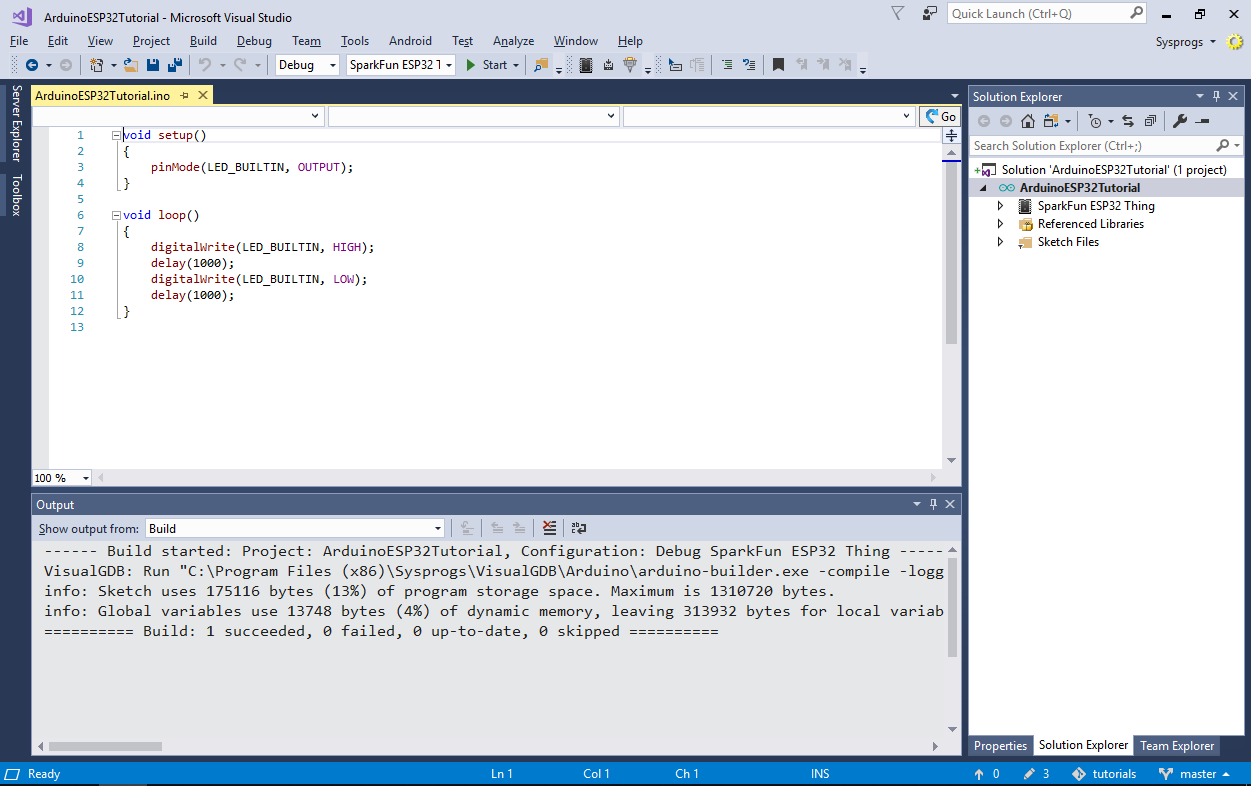 Note that the build is done using the Arduino builder tool, so the result will be the same as when using the Arduino IDE. VisualGDB also queries the detailed code model from the Arduino builder that allows displaying the precise list of source files used by the project and various libraries, and also configures IntelliSense to see the code exactly as the compiler does.
 - Once the project is built, press F5 to start debugging it:
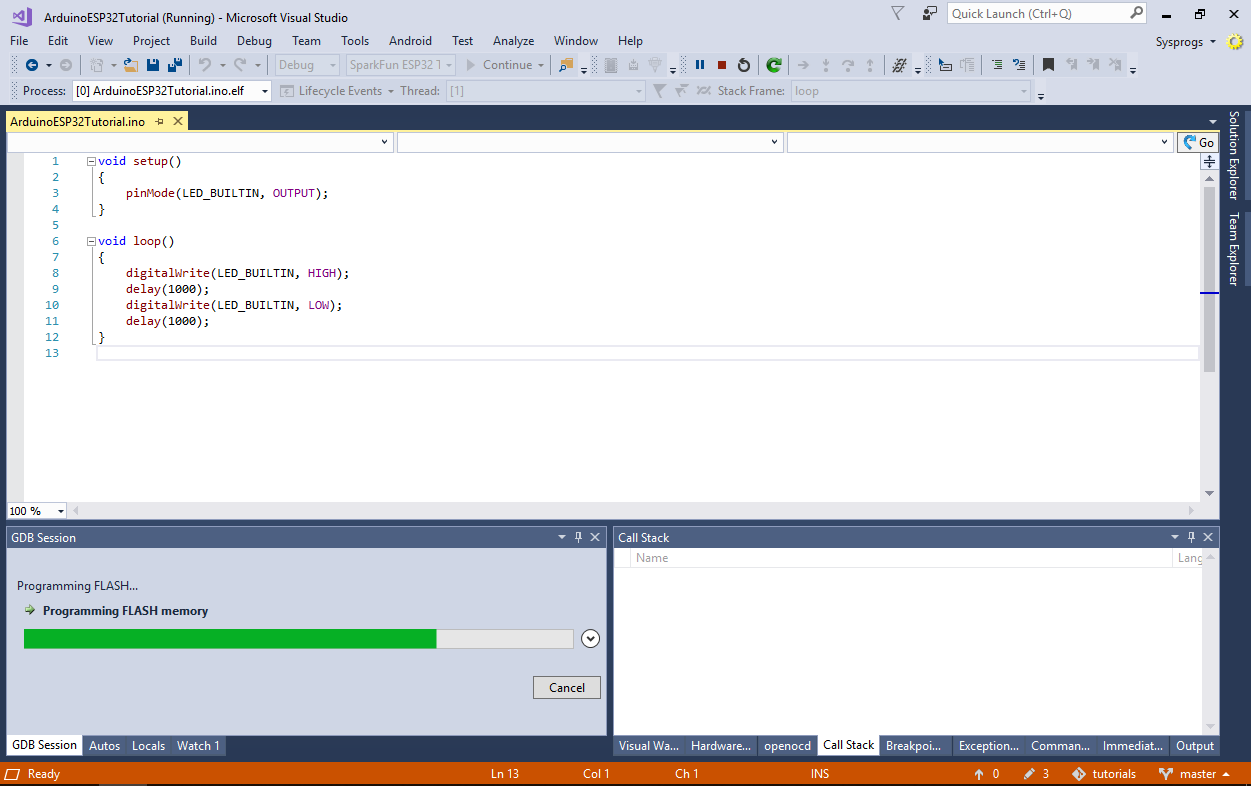 VisualGDB will automatically program the FLASH memory and begin running the project. The on-board LED will start blinking as expected.
 - Set a breakpoint inside the loop() function and wait for it to trigger:
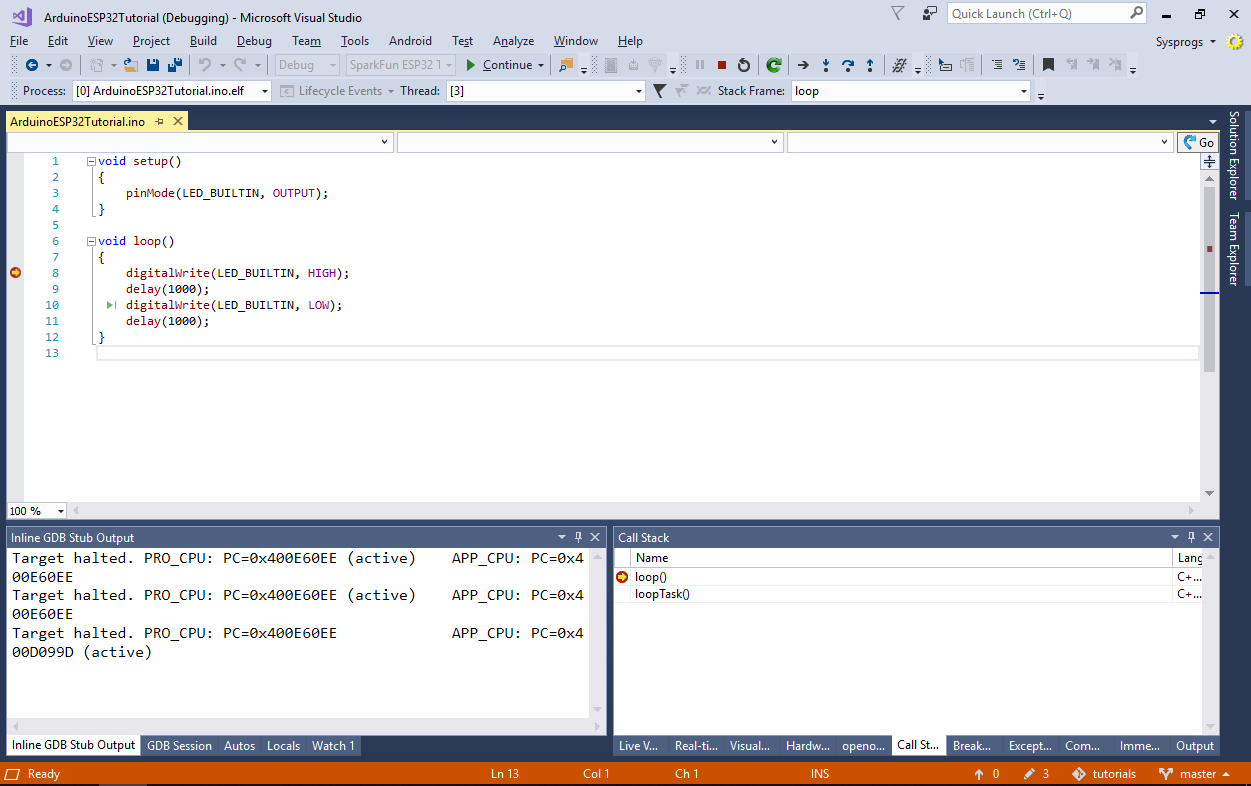 Once the breakpoint triggers, you will be able to debug the code as any other Visual Studio project.
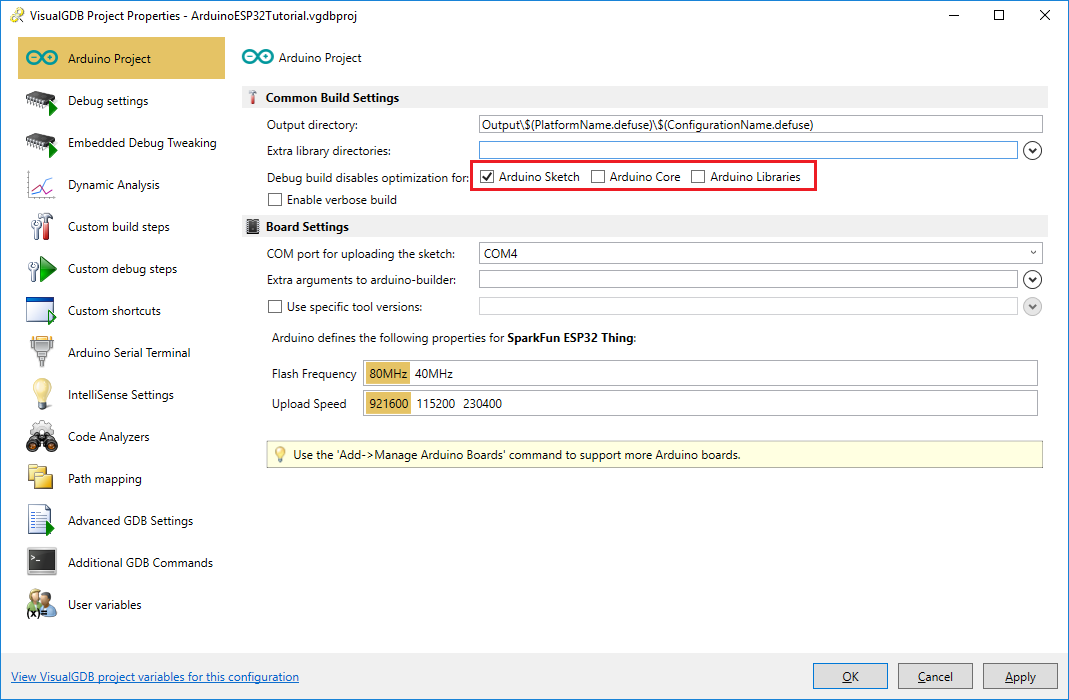
 - VisualGDB will automatically disable optimization when compiling the sketch (but not the platform or the libraries) when building the debug configuration, to ensure the best debugging experience. You can alter this behavior via the first page of VisualGDB Project Properties:
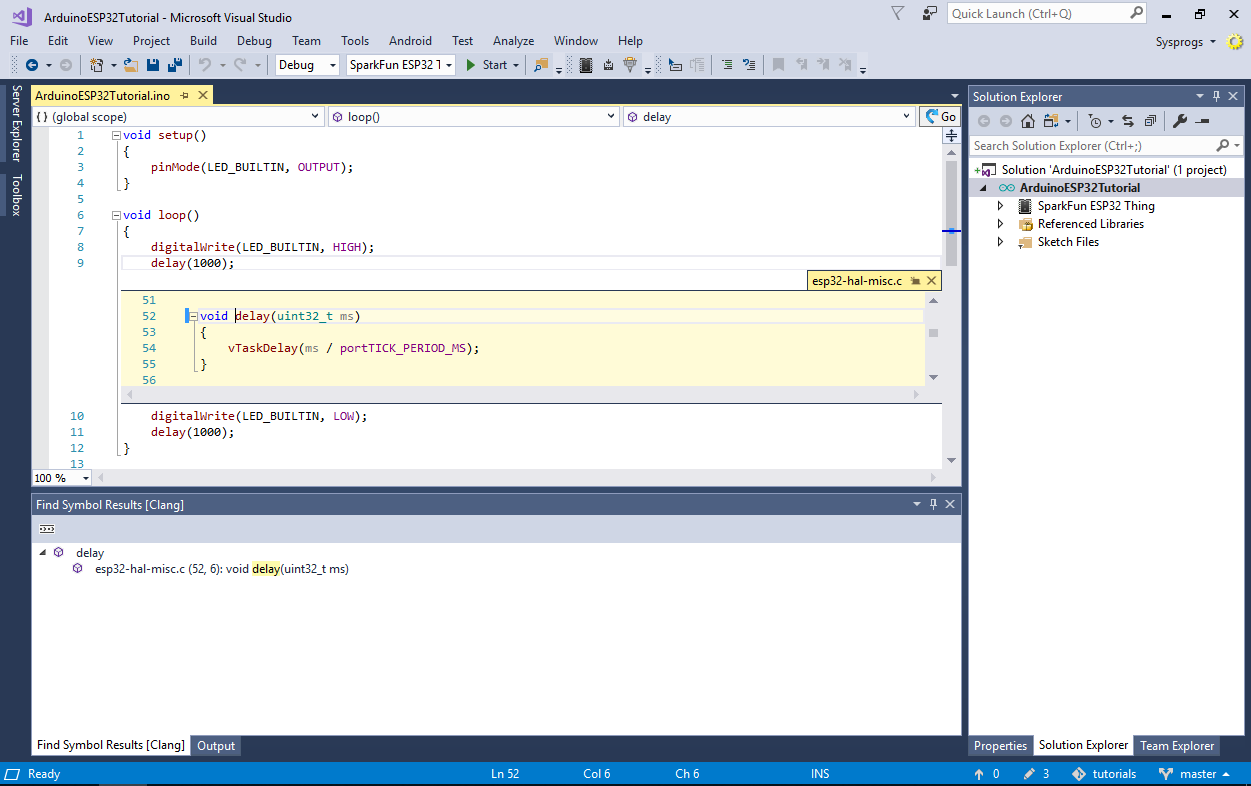
- As VisualGDB indexes all the source files used by the project, you can use commands like Go To Definition, Peek Definition, Code Map, etc. to easily explore the code of your sketches, the Arduino core and the related libraries:
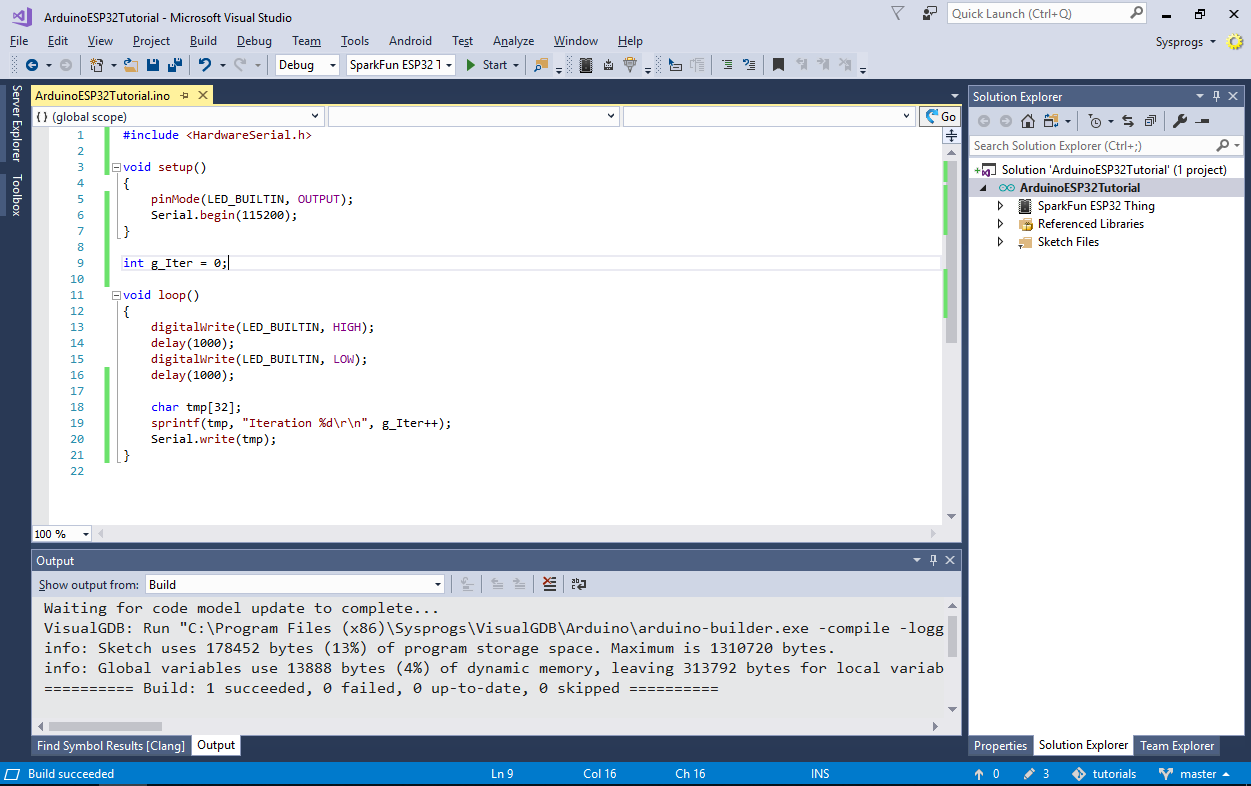
- Now we will show how to use the Arduino API for the serial port. Include the <HardwareSerial.h> file from your sketch:
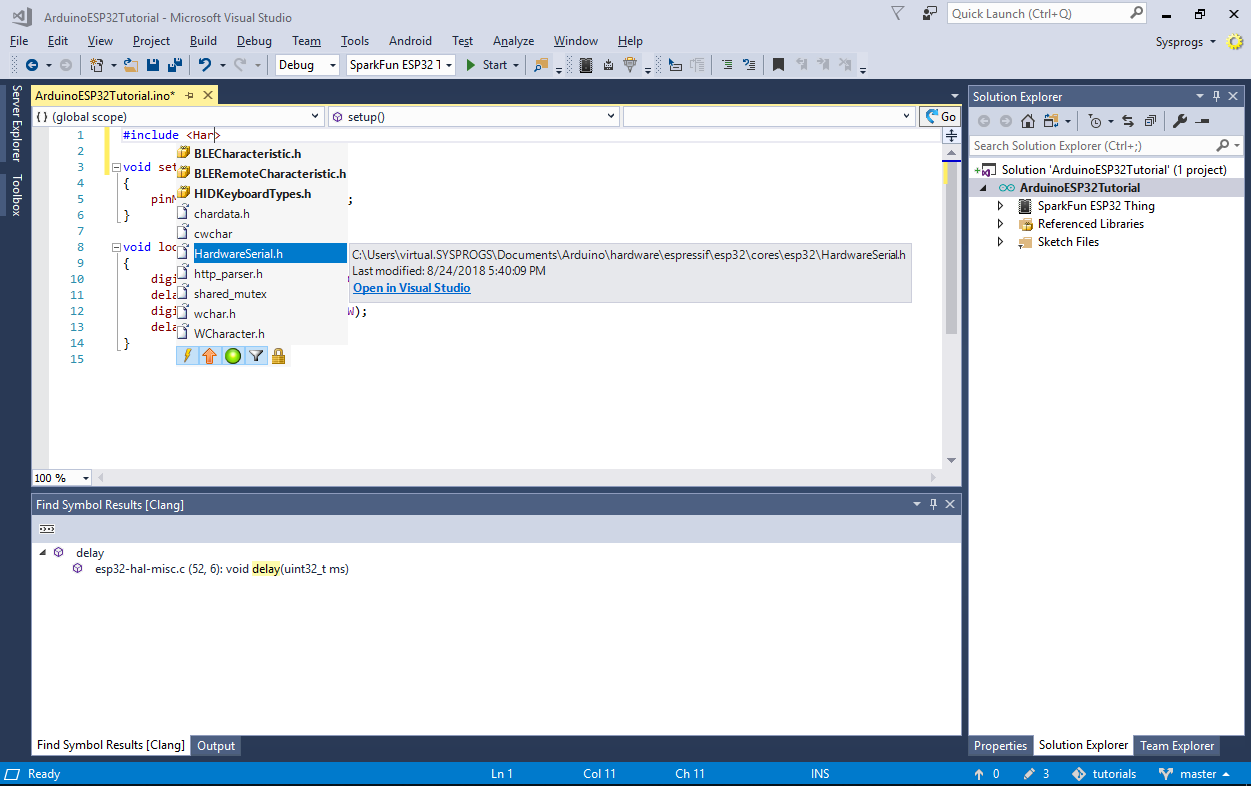 Note how VisualGDB shows the header files of available libraries with a special package icon. Including those header files will automatically reference the corresponding libraries once you save the sketch file.
 - Replace the contents of your sketch file with the following code:
#include <HardwareSerial.h>

void setup()
{
    pinMode(LED_BUILTIN, OUTPUT);
    Serial.begin(115200);
}

int g_Iter = 0;

void loop()
{
    digitalWrite(LED_BUILTIN, HIGH);
    delay(1000);
    digitalWrite(LED_BUILTIN, LOW);
    delay(1000);

    char tmp[32];
    sprintf(tmp, "Iteration %d\r\n", g_Iter++);
    Serial.write(tmp);
}
Then build your project by pressing Ctrl-Shift-B:
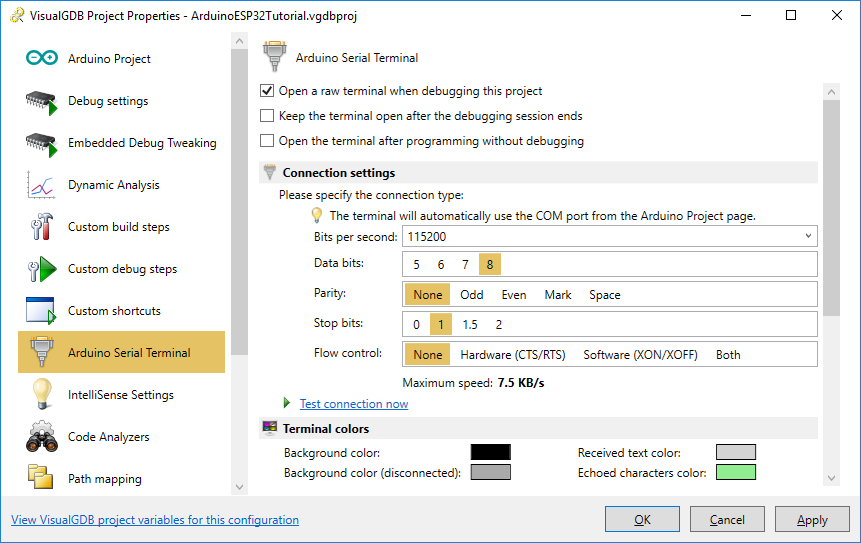
- Open VisualGDB Project Properties and go to the Arduino Serial Terminal page. Enable the serial terminal and ensure that the baud rate matches the one configured in the sketch file:
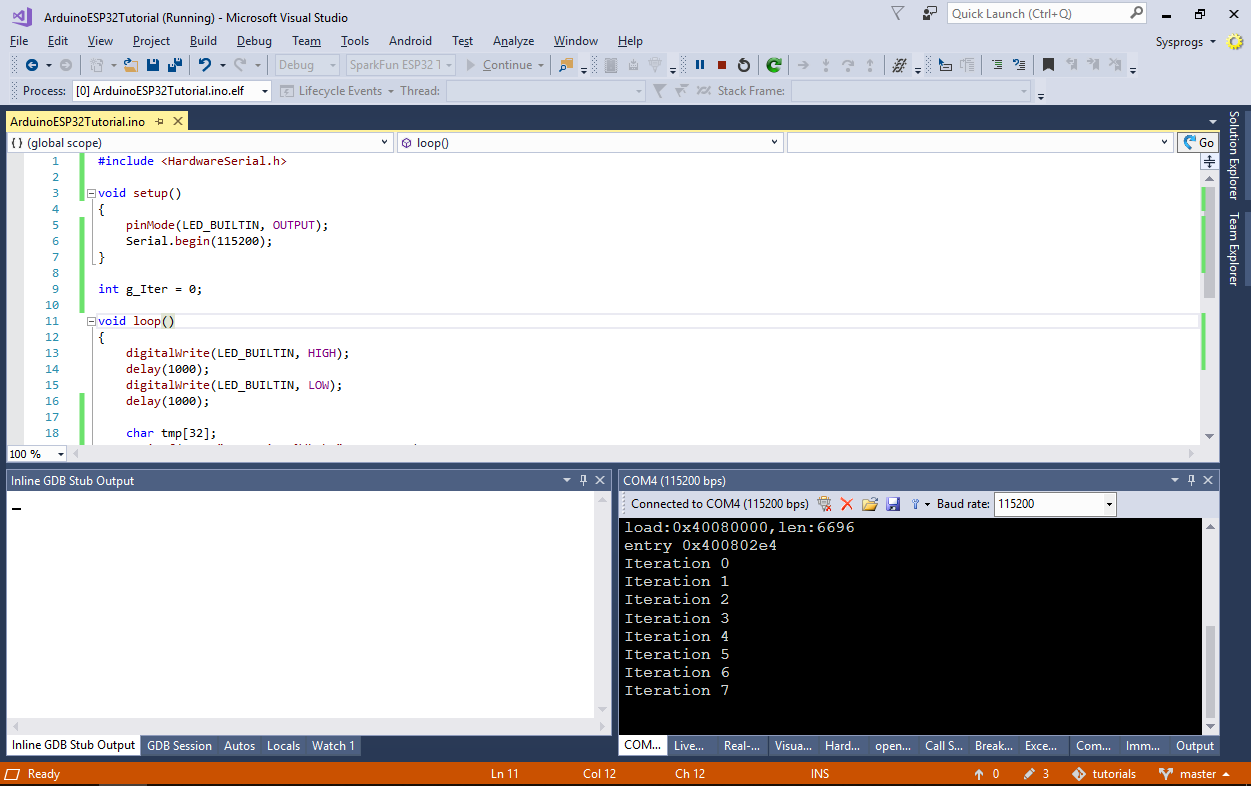
- Press F5 to begin debugging. Now you will see the output from the Serial API in the terminal pane inside Visual Studio:
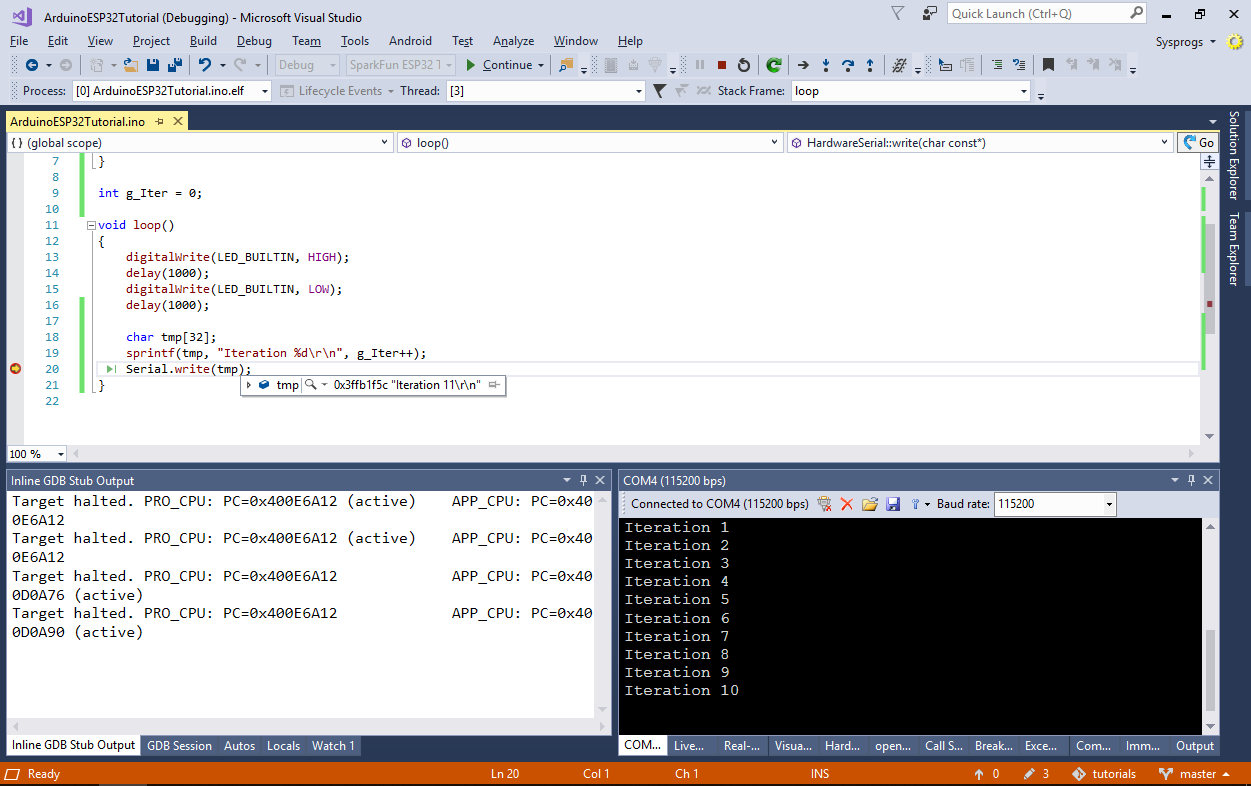
- You can set breakpoints and step through your code as usual. Since the debugging is done via the JTAG interface, it will not interfere with the serial port output:
- You can also program the FLASH memory without debugging and open the serial terminal via the context menu in Solution Explorer:
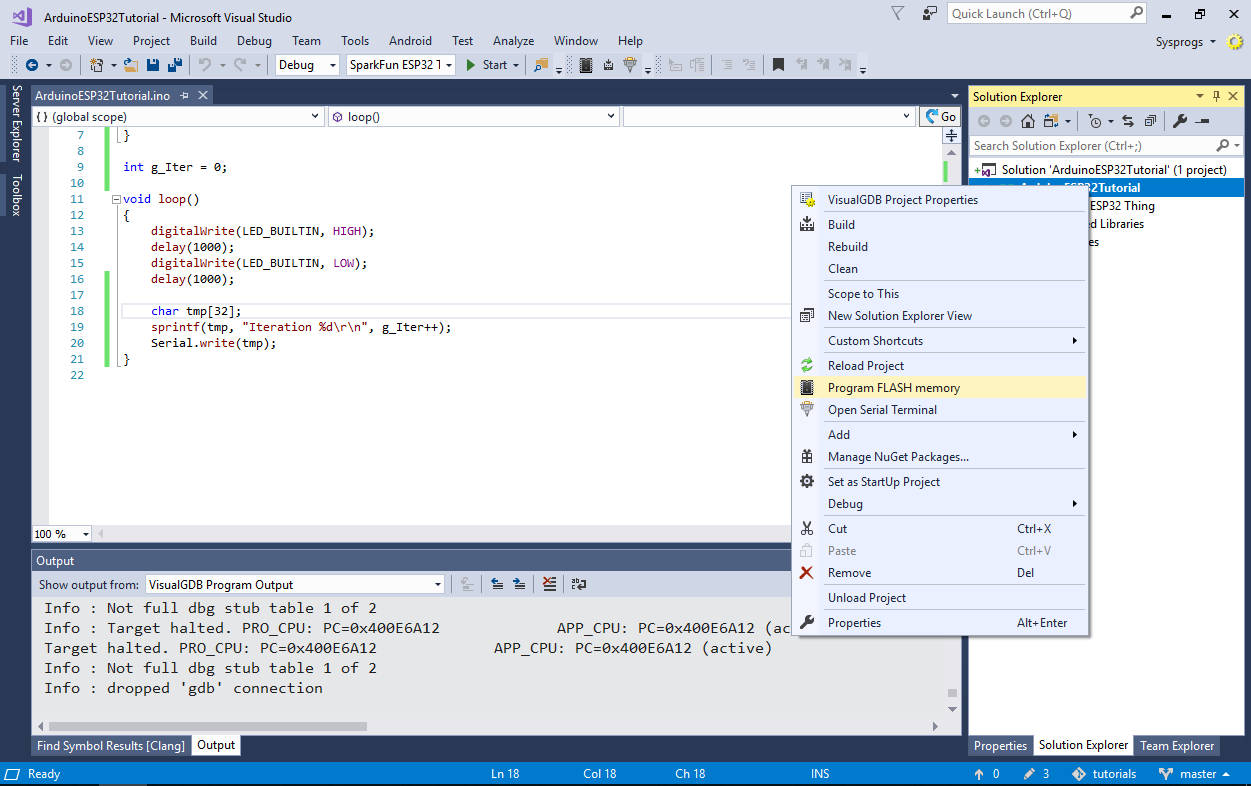
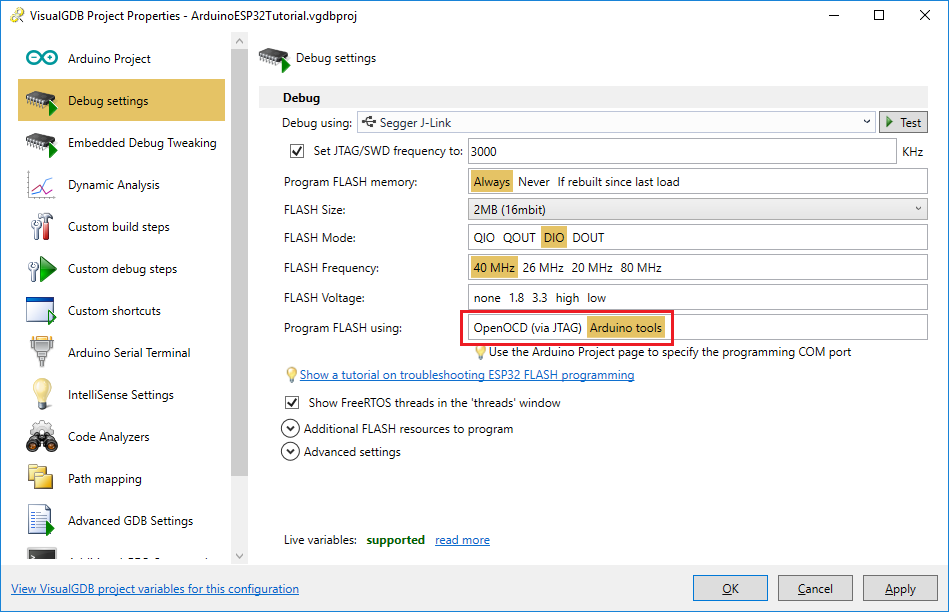
- If you encounter problems programming the FLASH memory using OpenOCD, select “Program FLASH using Arduino tools” on the Debug Settings page of VisualGDB Project Properties. This will configure VisualGDB to program the FLASH memory using esptool.py and the ESP32 bootloader instead of the OpenOCD FLASH programming logic:
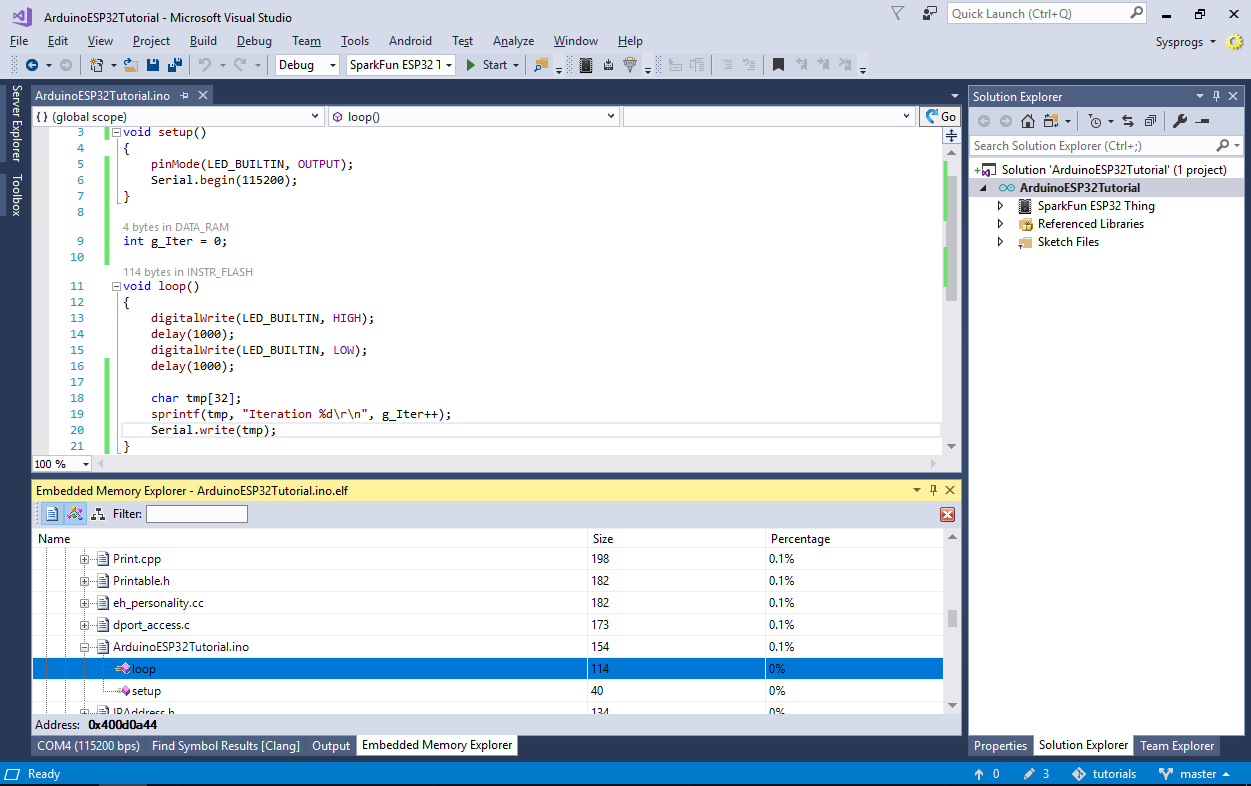
- Run the View->Embedded Memory Explorer command to see an overview of memory utilization for your ESP32 board:
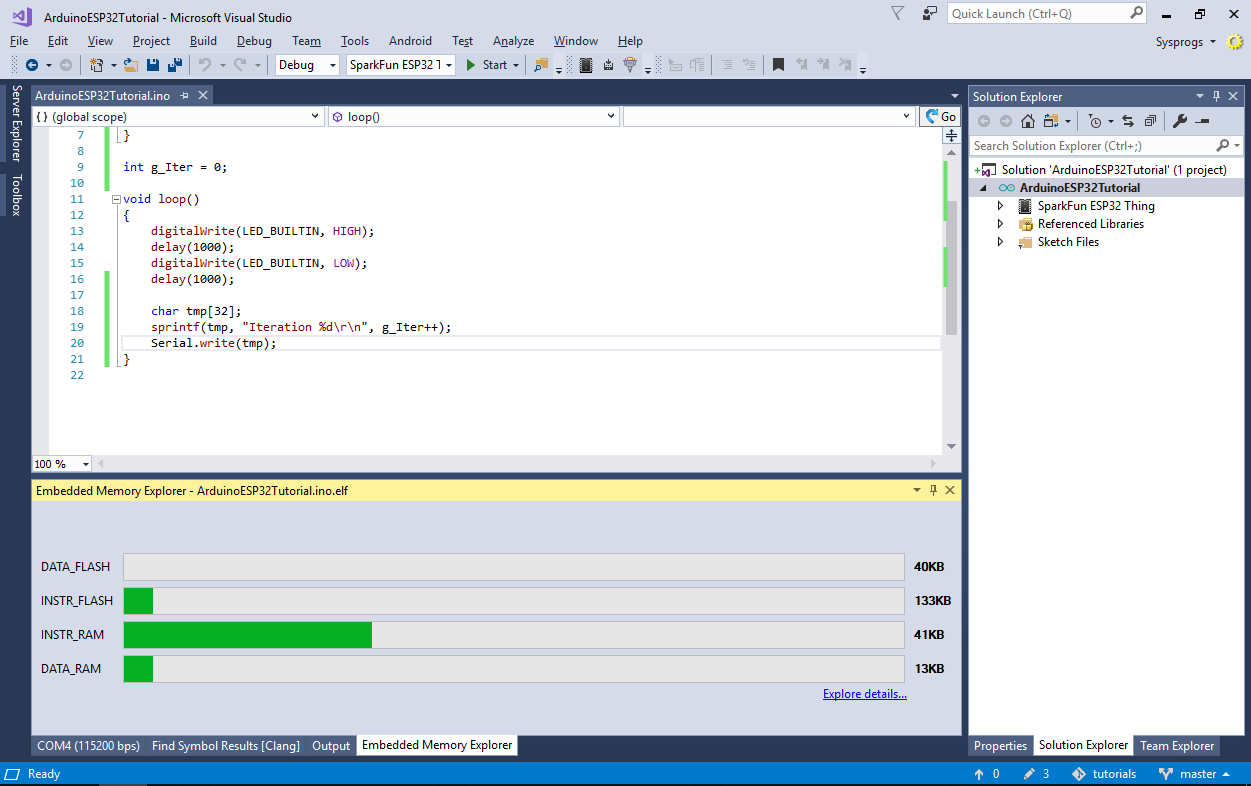
- Click “explore details” to view the detailed information about each function, method and global variable and also highlight their sizes and the memory type where they are placed directly in the code: