Monitoring Dynamic Stack and Heap Usage of IAR-based Projects
This tutorial shows how to use the VisualGDB Live Watch to monitor the live stack and heap usage of projects built with the IAR compiler.
We will create a basic IAR project for the STM32F4Discovery board, and will show how to check its stack and heap usage. Before you begin, install VisualGDB 5.5 or later and make sure you are using the Custom edition or higher.
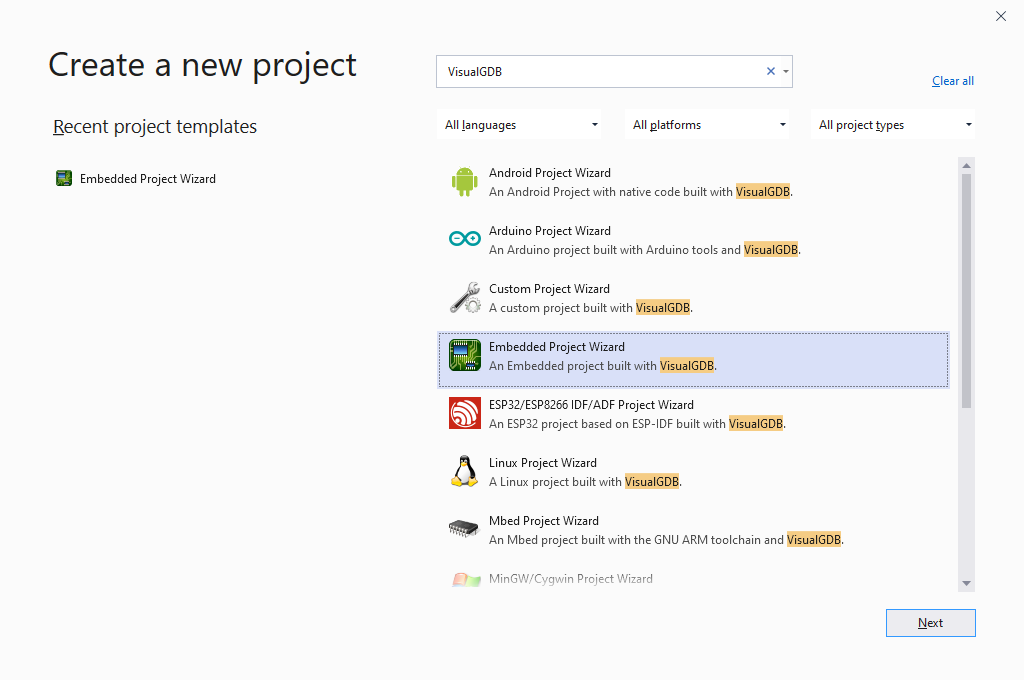
- Start Visual Studio and locate the VisualGDB Embedded Project Wizard:
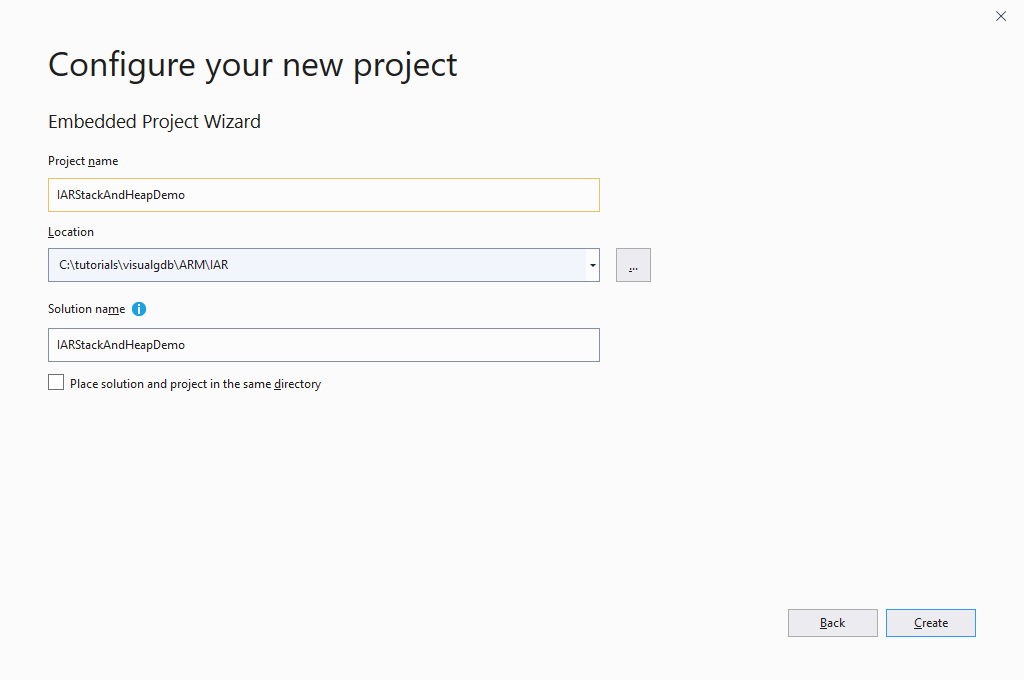
- Enter the name and location of the project you are creating, then click “Create” to proceed with the VisualGDB-specific part of the wizard:
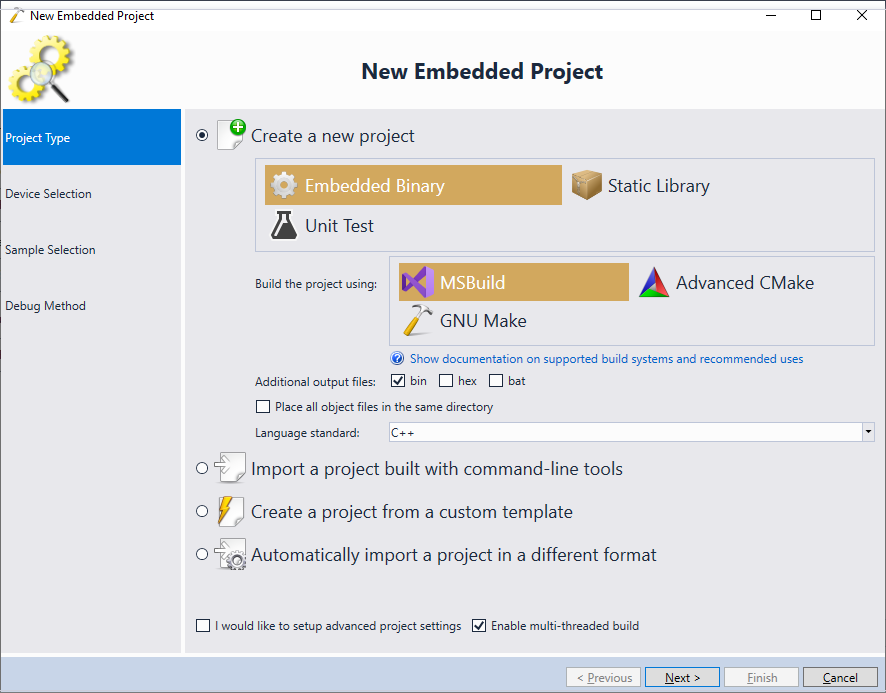
- On the first page of the wizard, select “Create a new project -> Embedded binary -> MSBuild”:
- Then, choose the IAR compiler from the toolchain list and select your device:

- The IAR compiler does not include device-specific project samples, so simply proceed with creating an empty project:

- On the Debug Method page of the wizard, select the debugging settings that work with your setup:
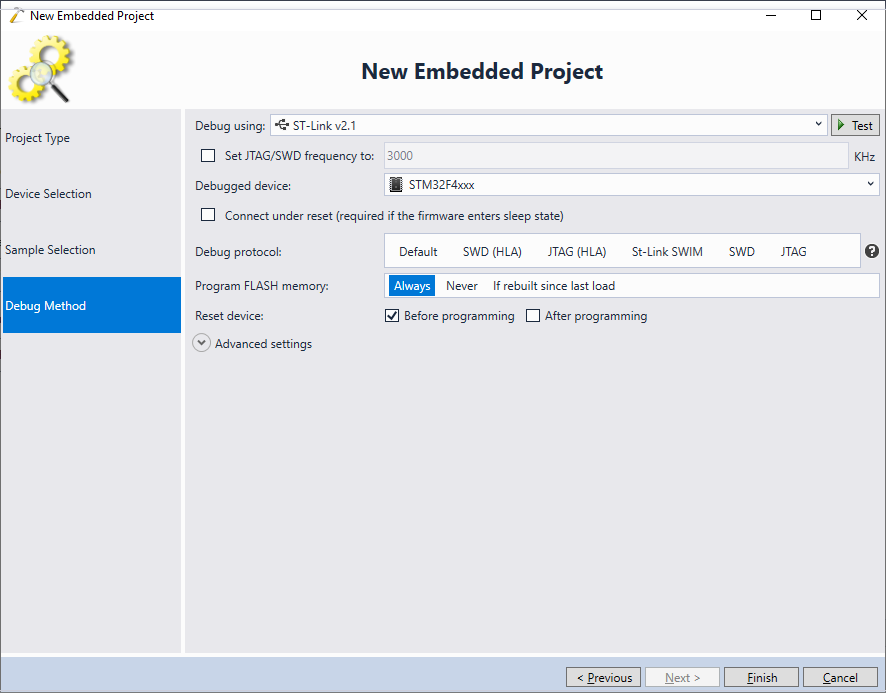 When done, click “Finish” to create the project.
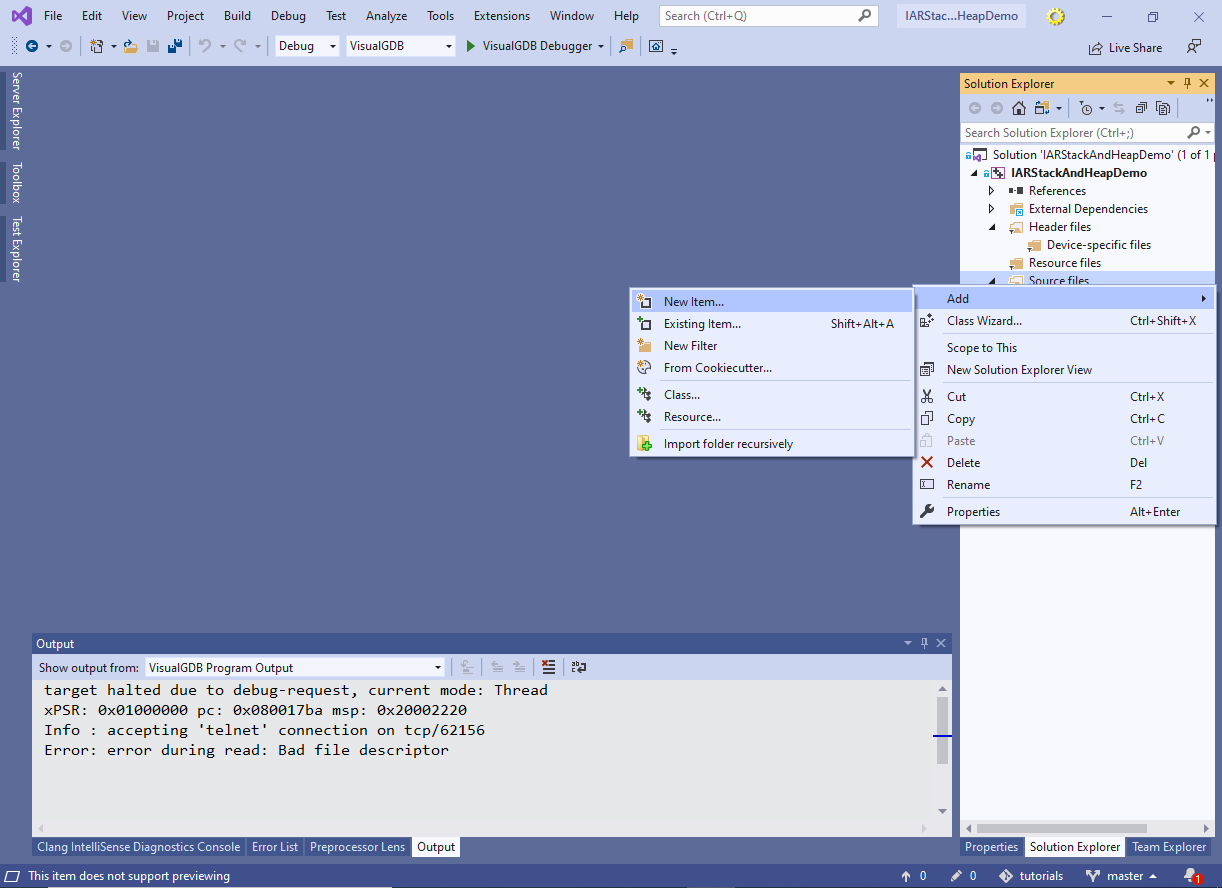
 - As the created project does not contain any sources yet, right-click on the Source Files folder and select Add->New Item. Then proceed with adding a C++ source:
- Copy the following code into into the source file you just created:
#include <iar_dlmalloc.h>
#include <stdlib.h>

struct mallinfo IARHeapInfo;

void RecursionTest(int level)
{
    volatile int test = 123;
    if (level > 0)
        RecursionTest(level - 1);
}

int main()
{
    RecursionTest(1);
    RecursionTest(2);
    RecursionTest(3);

    IARHeapInfo = __iar_dlmallinfo();
    void *p = malloc(123);
    IARHeapInfo = __iar_dlmallinfo();
    free(p);
    IARHeapInfo = __iar_dlmallinfo();
}
The sample code calls the RecursionTest() function to demonstrate increasing stack usage, then it calls malloc() and free() to demonstrate the use of heap. Note that IAR does not automatically update the heap statistics unless you explicitly call the __iar_dmallinfo() function as shown in this tutorial. In order to monitor the heap usage in real time, you can create a wrapper around malloc()/free() that will call __iar_dmallinfo(), or simply call it periodically from an interrupt handler.
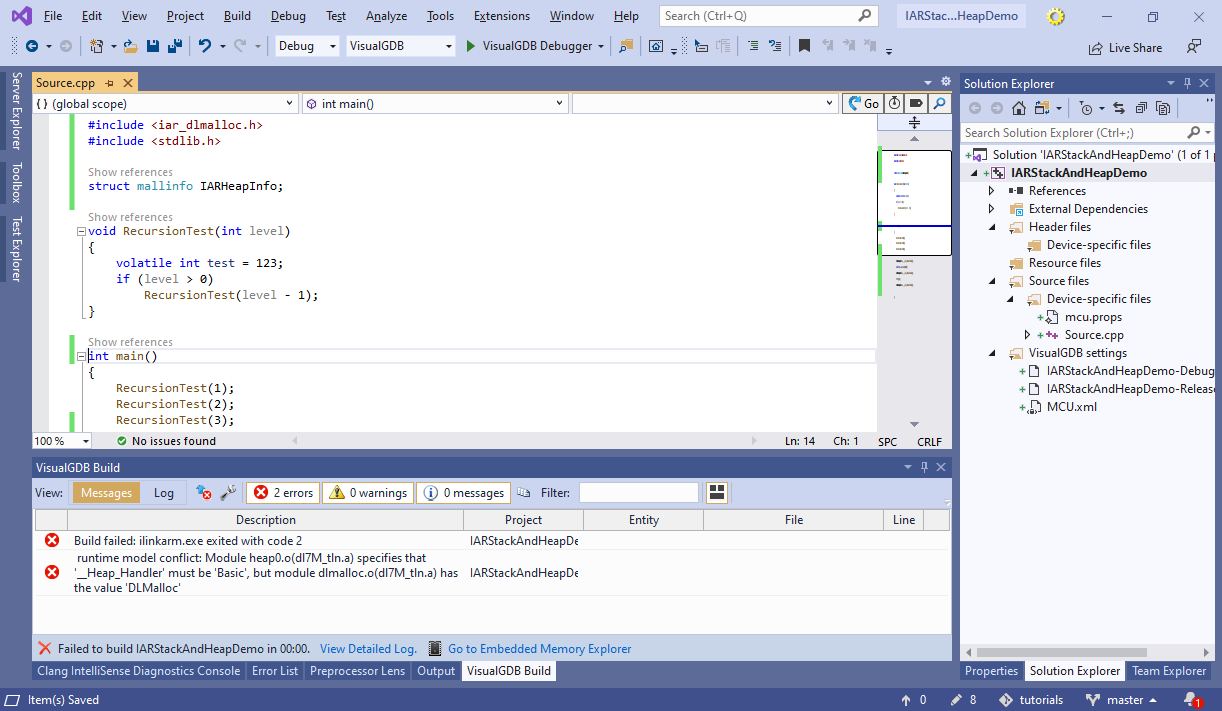
- Note that if you try building the project now, it will fail because the default heap mode is not compatible with the __iar_dmallinfo() function:
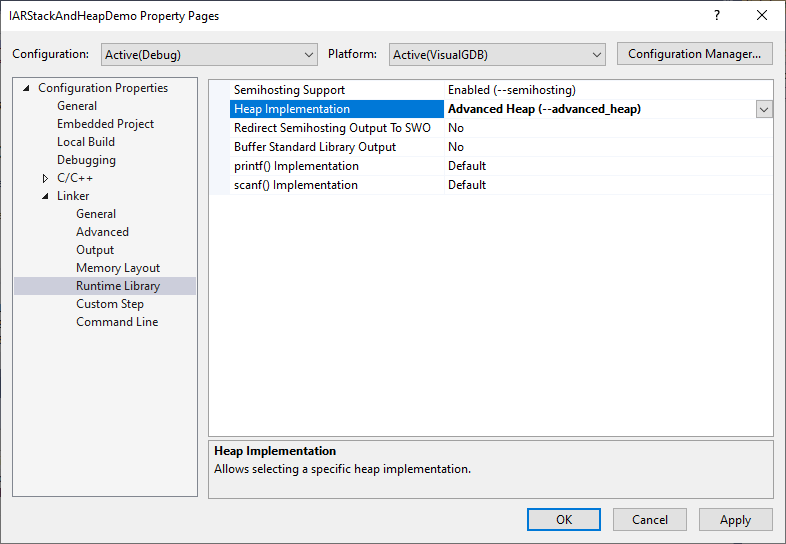
- In order to resolve it, change the heap implementation to “Advanced Heap” via VS Project Properties:
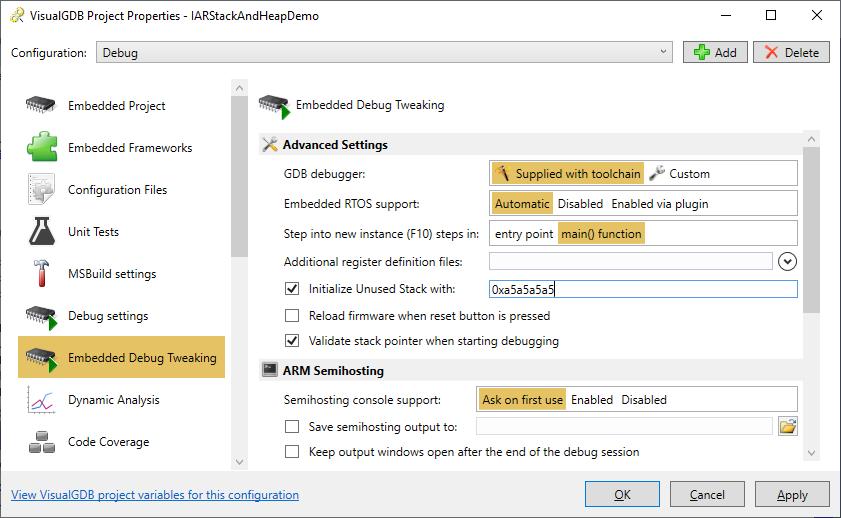
- Before we can monitor the stack usage, we need to configure VisualGDB to fill the stack area (between CSTACK$$Base and the value of $sp in main()) with a fixed pattern. This can be done via the Embedded Debug Tweaking page of VisualGDB Project Properties:
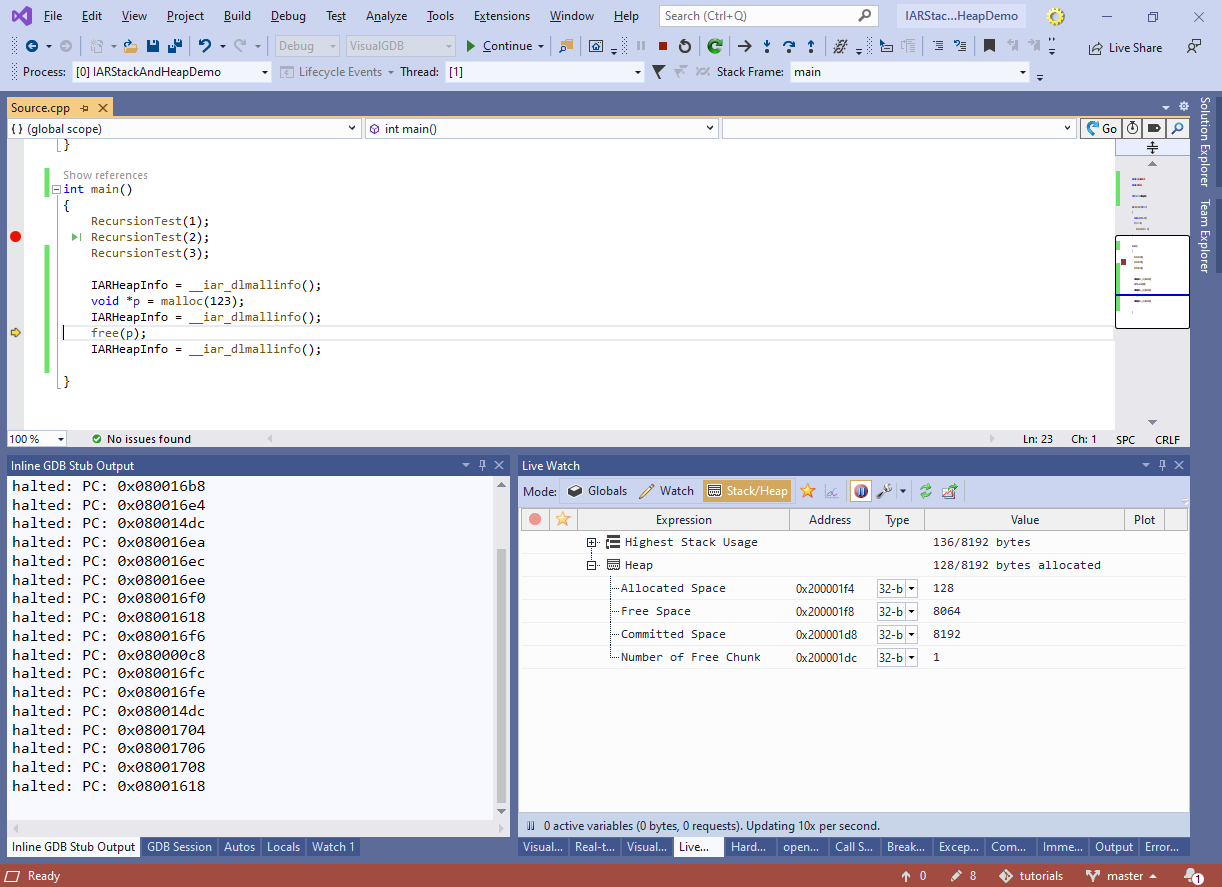
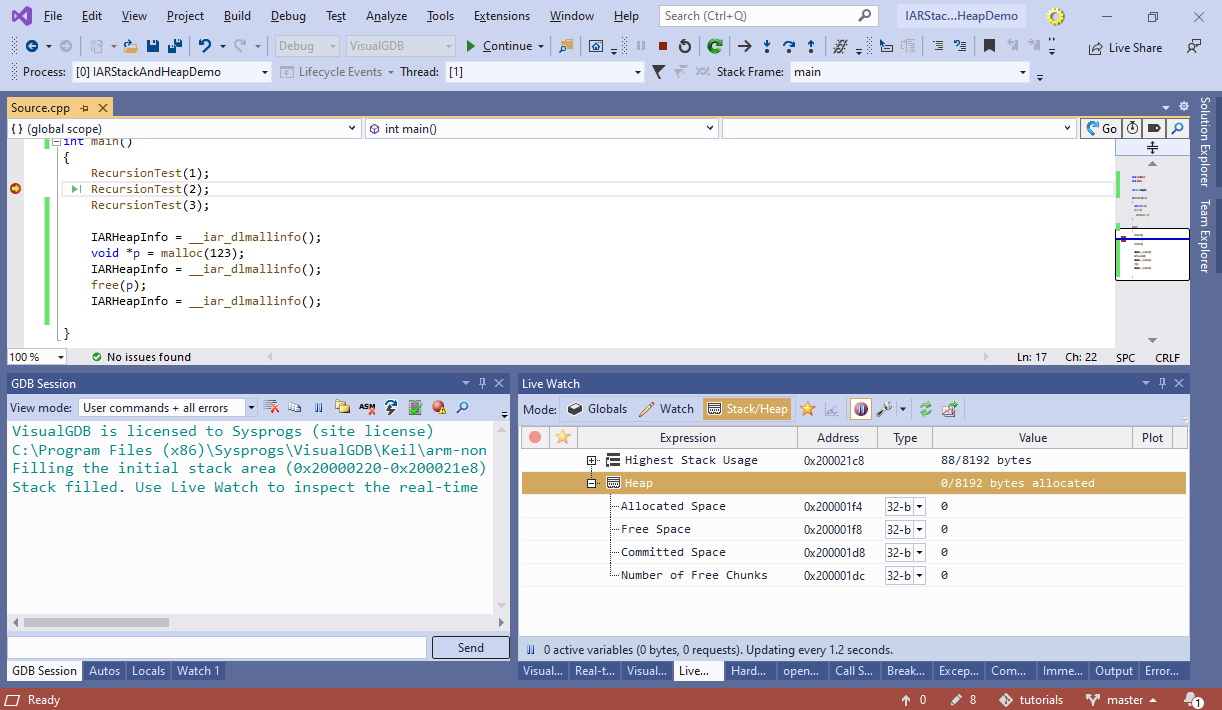
- Set a breakpoint on the second line of main() (due to the way breakpoints are handled internally, setting it at the beginning of main() may interfere with the logic that fills stack with the fixed pattern), then start debugging. Once the breakpoint hits, open Debug->Windows->Live Watch and switch to the Stack/Heap view. You will now see the worst-case stack use and the current heap state:
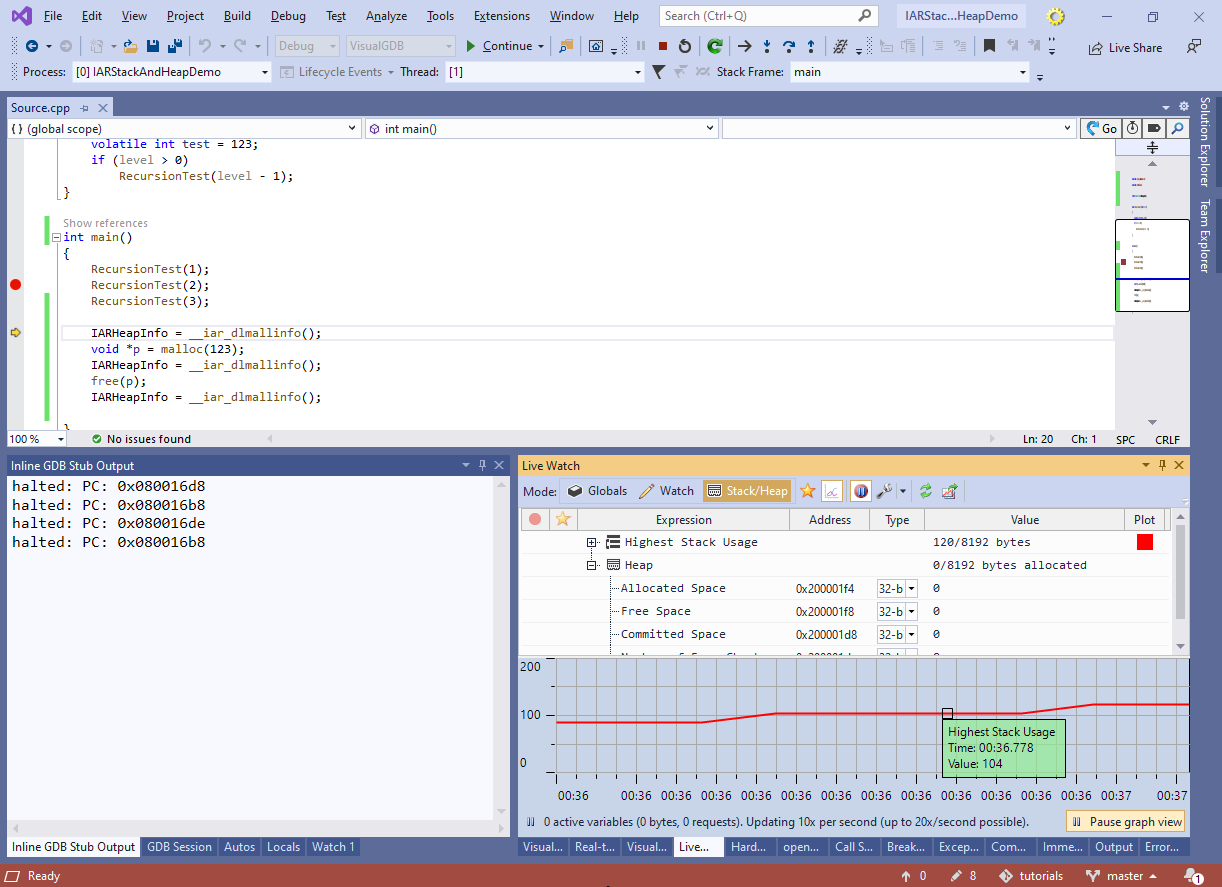
- The stack use is computed by repeatedly scanning the stack area and searching for the end of the initial stack pattern. It works in the background (even when the program is running) and produces accurate results based on the actual stack use. Try stepping over RecursionTest() and observe how the highest stack usage increases:
- The heap statistics is computed by analyzing the global IARHeapInfo variable that must be explicitly updated from the code. It also works while the program is running, but relies on the program to call __iar_dlmallinfo() periodically. Try stepping over different calls to __iar_dmallinfo() and observe how the heap statistics in the Live Watch window changes: