Creating NRFConnect-based Projects for NRF9160
This tutorial shows how to use the Advanced NRFConnect Project Subsystem to target the NRF9160 device with VisualGDB. We will show how to clone the basic “AT Commands” sample included in the NRFConnect SDK, and will use VisualGDB to build the project, debug it and change various properties.
Before you begin, install VisualGDB 5.5 Preview 6 or later.
- Start Visual Studio and locate the VisualGDB NRFConnect Project Wizard:

- Enter the name and location for your project:

- As we will clone the sample project shipped with the NRFConnect SDK, select “Create a new project” on the first page of the wizard:

- On the toolchain page, select the ARM toolchain. If you have not created NRFConnect-based projects before, you will need to specify the directory where VisualGDB will store the NRFConnect checkouts:
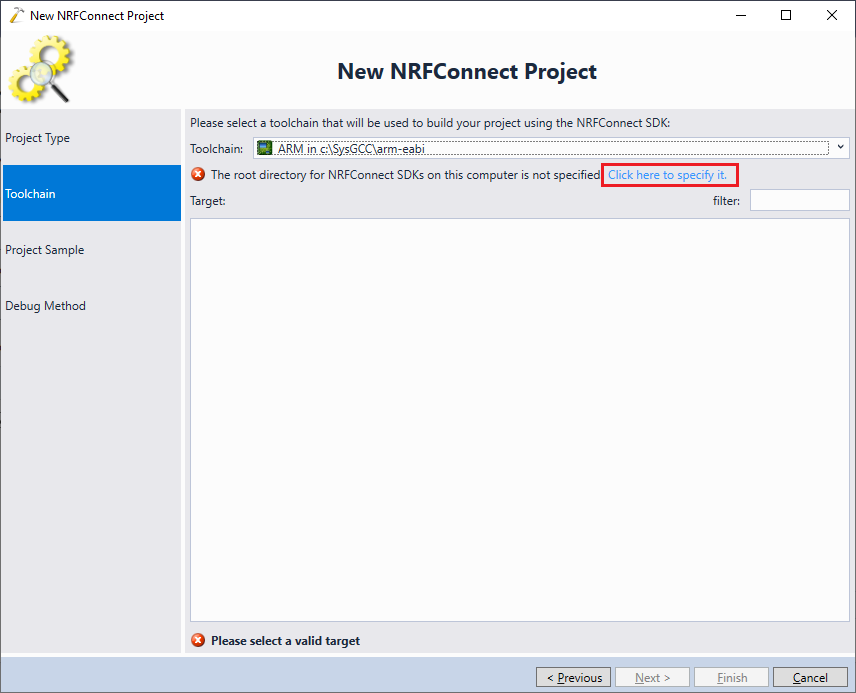 WARNING: Make sure the NRFConnect checkout directory is under the same drive letter as your NRFConnect-based projects. Otherwise the NRFConnect SDK will not be able to compute internal target names.
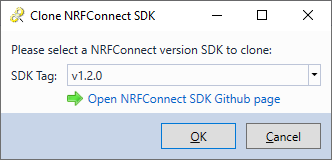
 - Open the “SDK Version” dropdown and click “Clone a new NRFConnect SDK”:

- Select the SDK version to clone. VisualGDB will allow cloning any NRFConnect version from the Github repository, however versions prior to v1.2.0 depend on additional tools and may not work out-of-the-box:
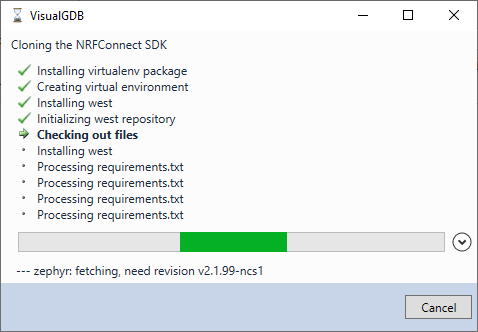
- VisualGDB will automatically create a virtual Python environment used by the SDK build tools, will clone the SDK into a separate directory, and will ensure that the Python environment contains all the necessary tools. If you get strange Python-related problems, please try resetting your Python installation as shown here:
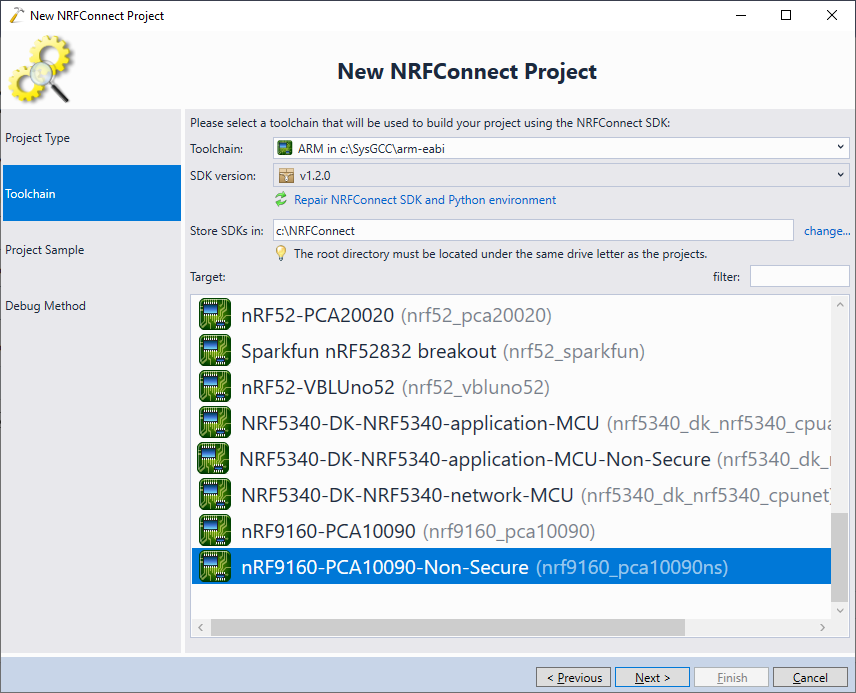
- Once the SDK is cloned, VisualGDB will show the targets supported by it. In this example we will pick the nRF9160-PCA10090-Non-Secure target, as the regular nrf9160_pca10090 target requires additional setup:
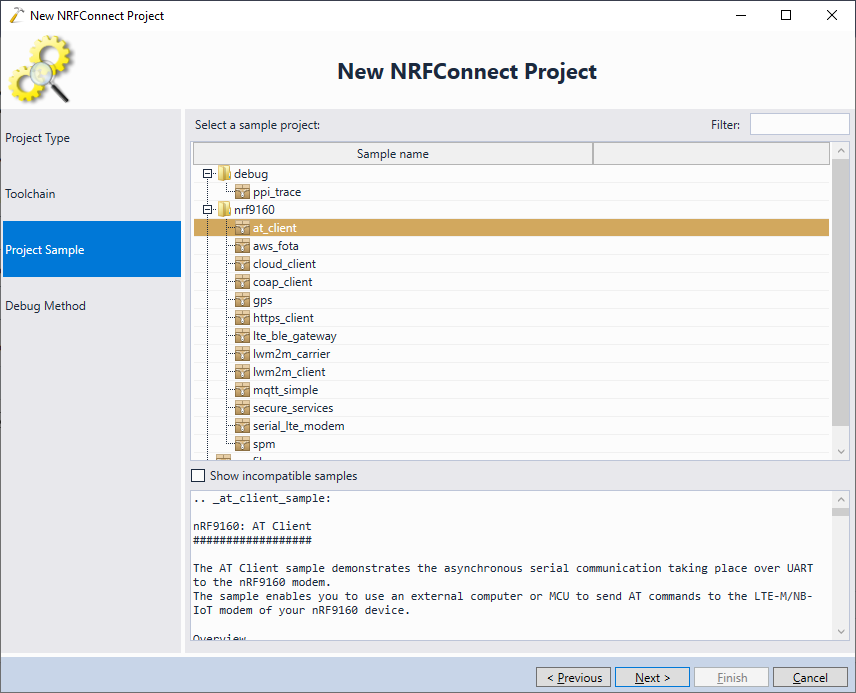
- The next page of the wizard allows selecting a sample project to clone. VisualGDB automatically filters out incompatible samples based on the platform_whitelist tag in sample definitions. If your platform does not contain any samples, try selecting “Show incompatible samples” and picking the most trivial sample that could be easily ported:
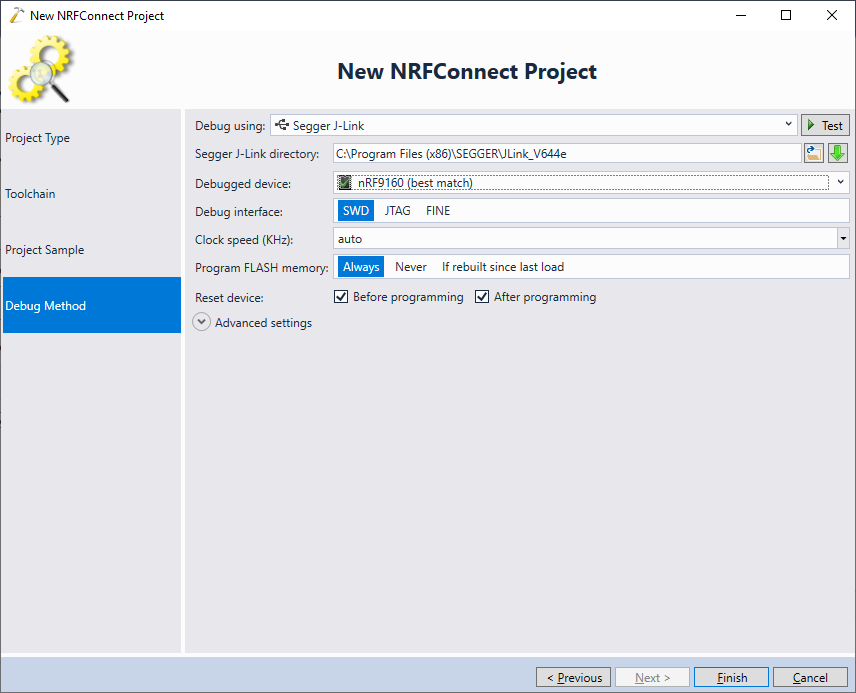
- The next page of the wizard allows selecting a JTAG/SWD probe to debug the device. Nordic development boards come with an on-board J-Link probe, so VisualGDB should be able to locate it automatically and configure the J-Link software to use it:
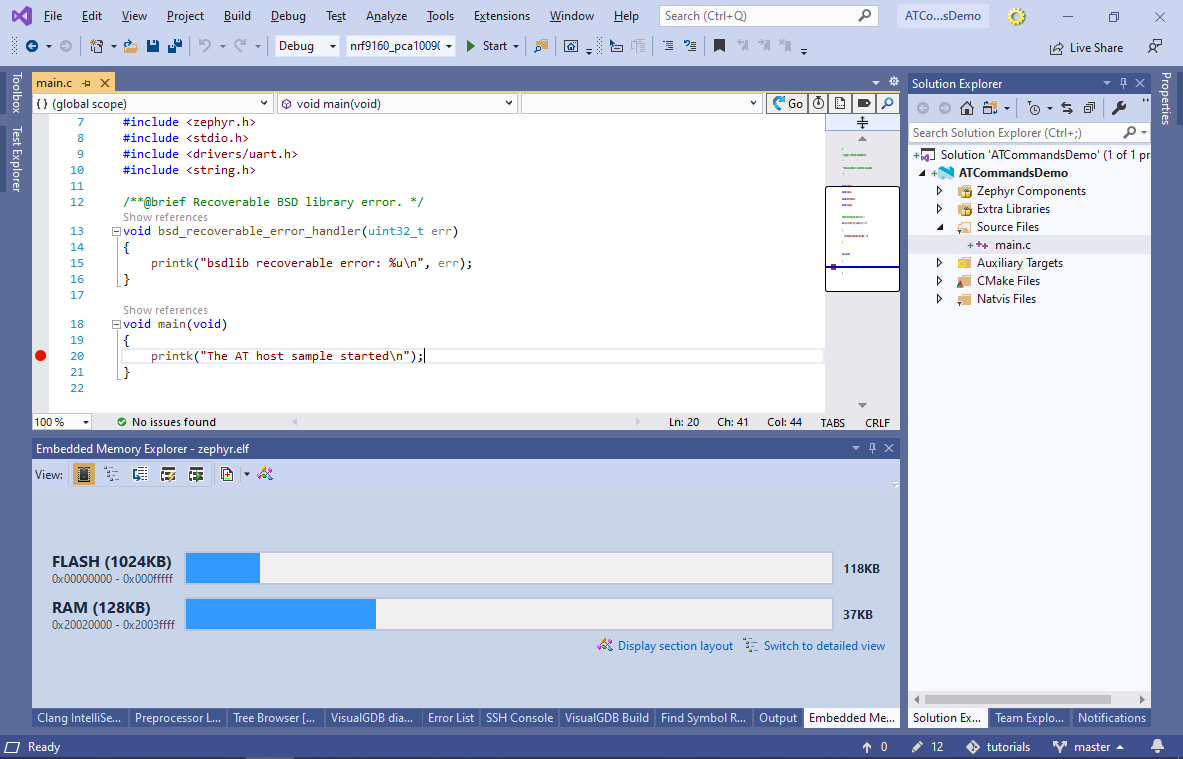
- Click “Finish” to create the project. VisualGDB will clone the sample and show its structure in Solution Explorer:

- Press Ctrl-Shift-B to build the project. VisualGDB will automatically pick up the memory layout from the Zephyr OS configuration and will show the FLASH/RAM utilization:
- If you are using the Custom Edition or higher, you can configure VisualGDB to connect to the on-board serial port and monitor the output from the NRF9160 chip. If not, try using SmarTTY to observe the output from the device. Note that the nRF91-DK board provides 3 virtual ports with different kinds of output. If you have not determined the primary one yet, select an arbitrary one now. You will be able to switch it later when the project is running:
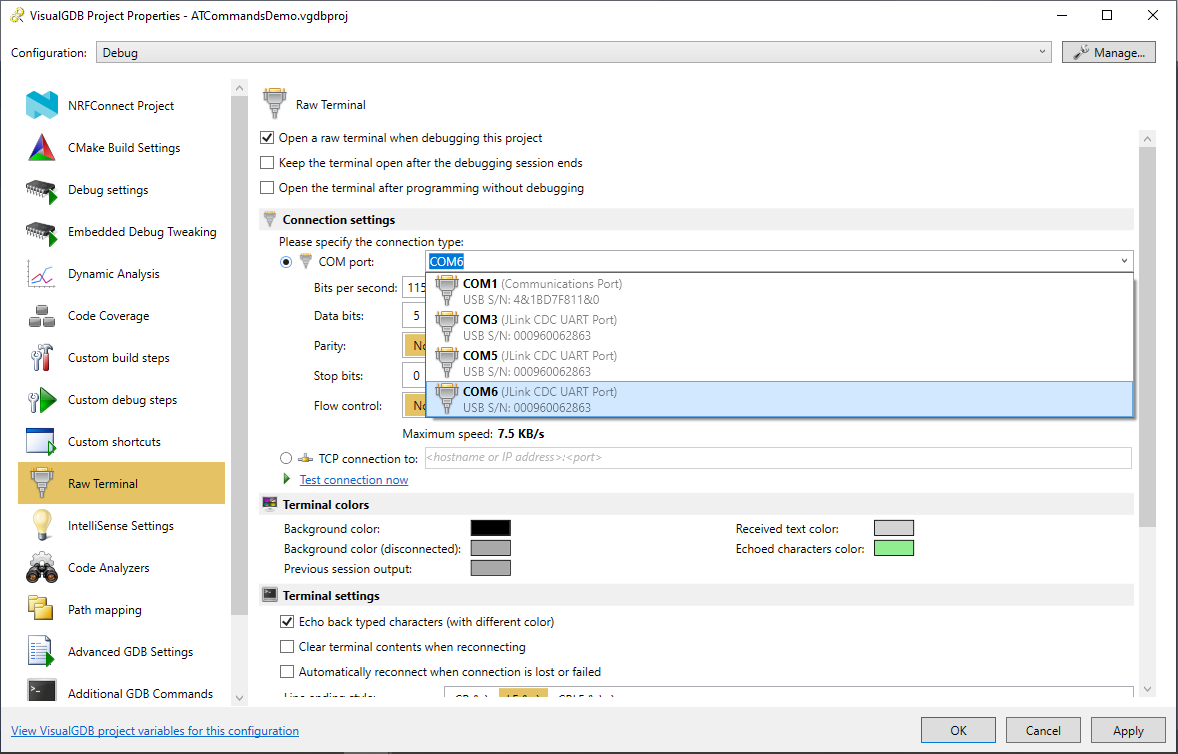 We also recommend setting the “Echo back typed characters” checkbox as the NRF91-DK board does not echo them automatically.
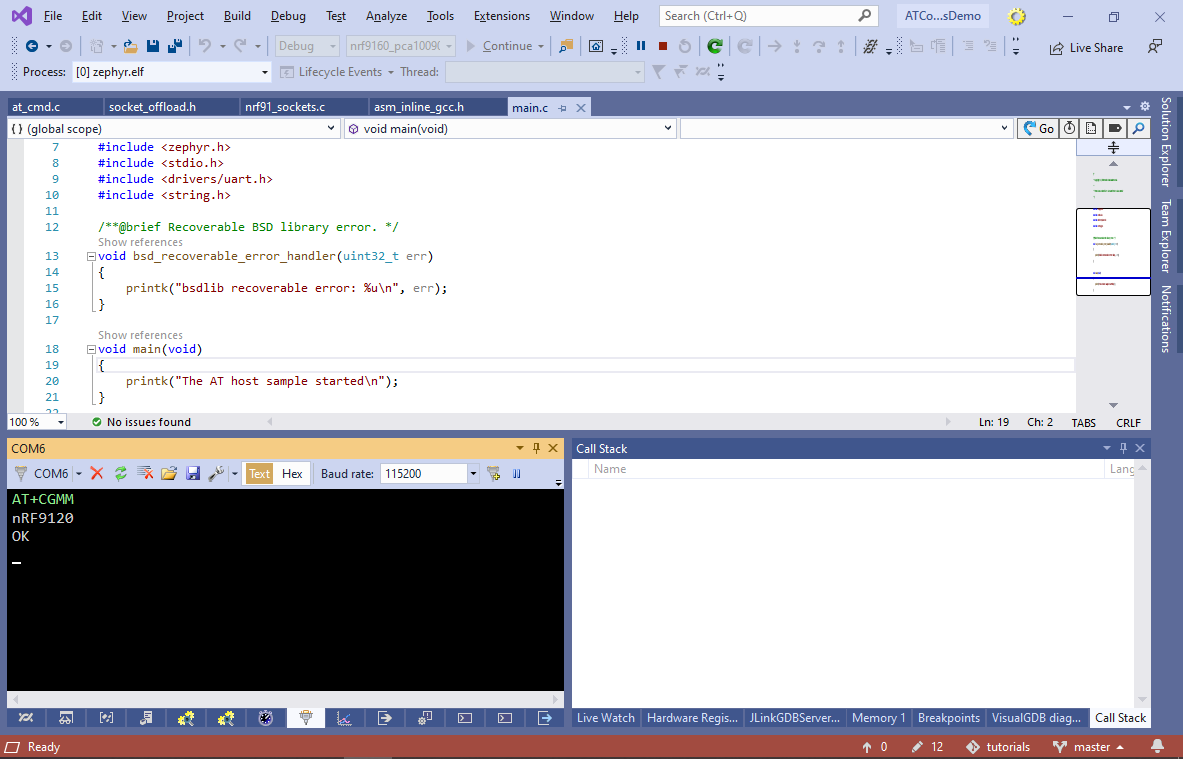
 - Try setting a breakpoint in main() and run the program. VisualGDB will automatically program the FLASH memory (including the softdevice) and will start the program, triggering the breakpoint:
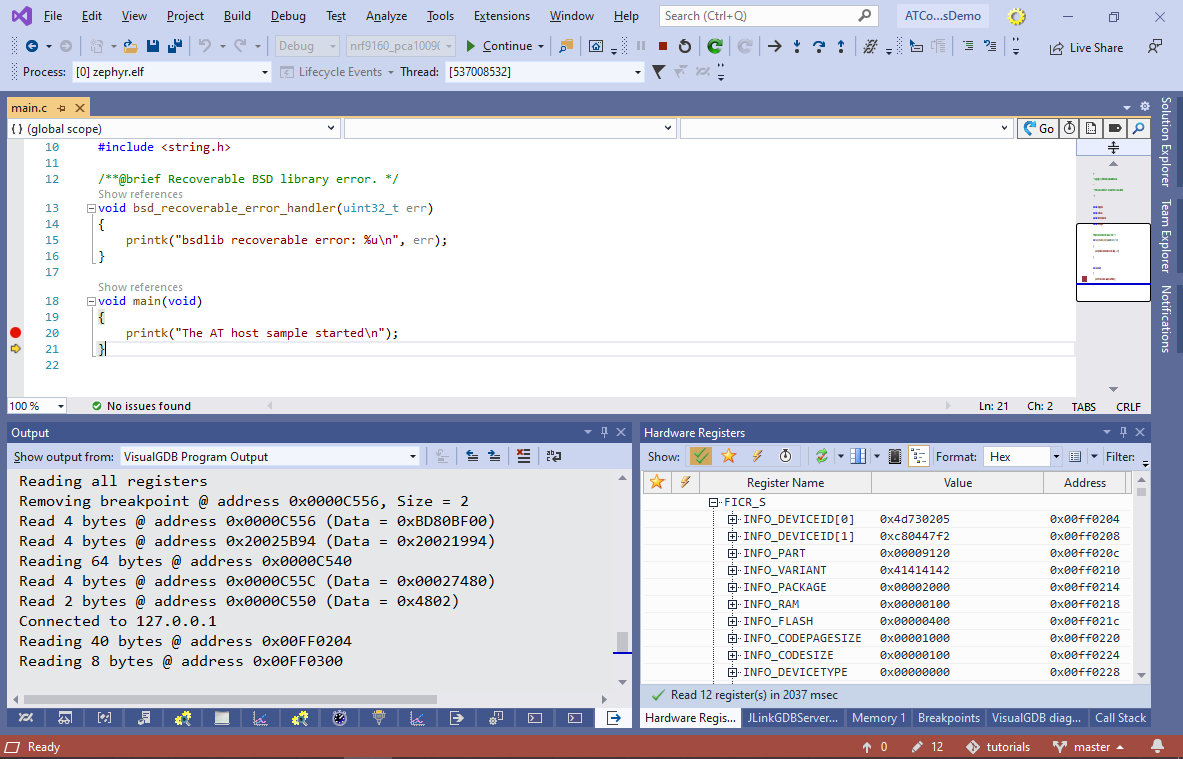 If you have not found out the primary COM port yet, use the “Set Next Statement” to command to run the printk() line several times until you find the COM port that shows the “AT host sample started” message.
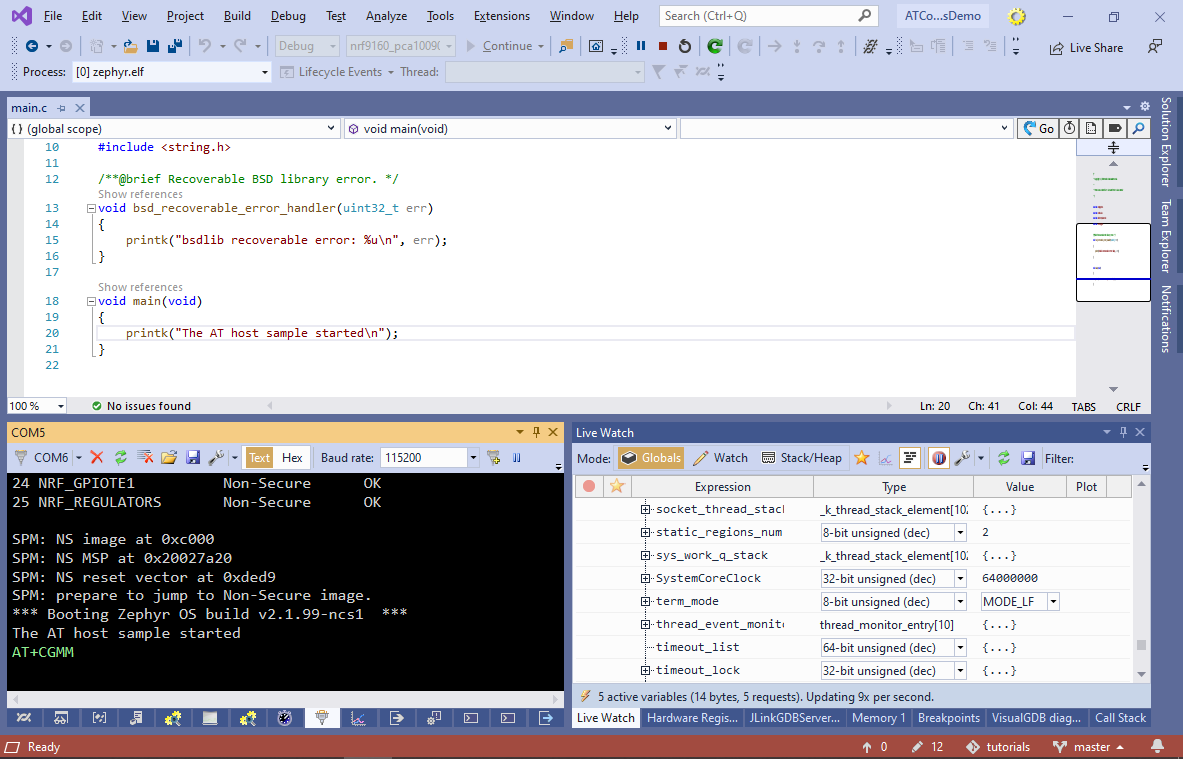
 - Resume the program and try running AT commands (e.g. AT+CGMM) in the terminal window:
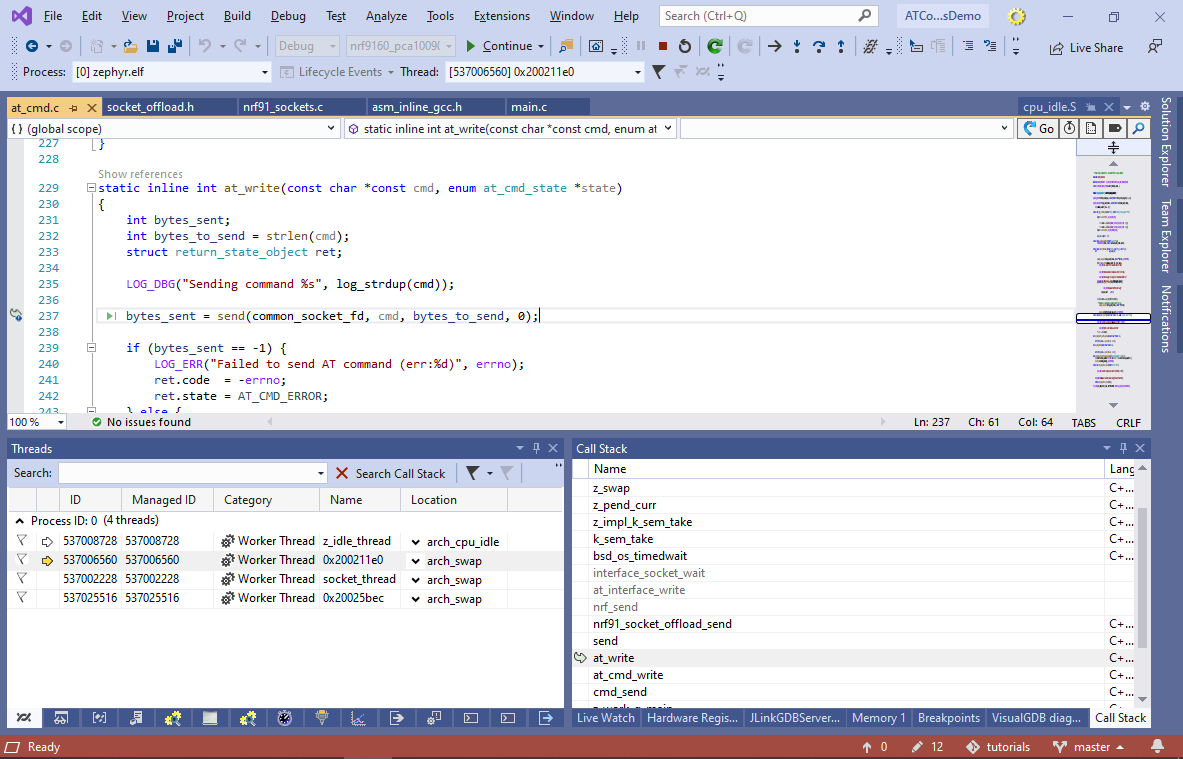
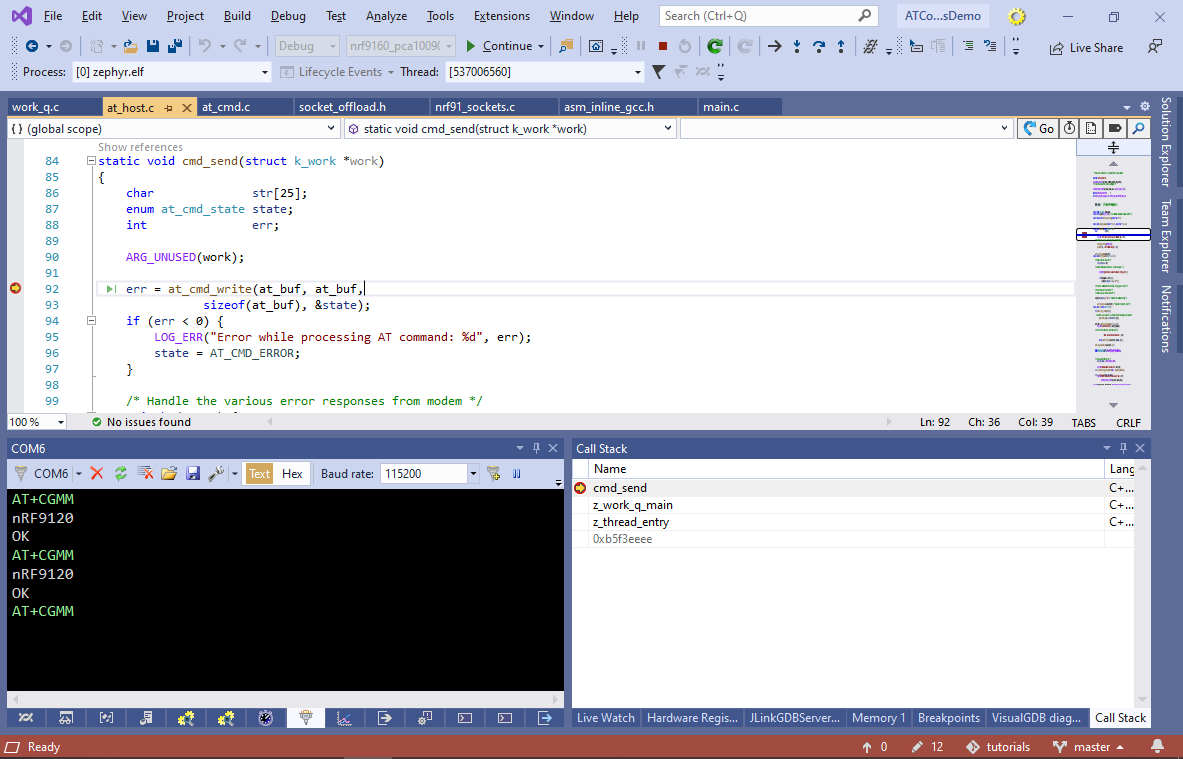
- If the device is not responding, it may happen because the radio modem core was not reset together with the main core. If you are using the Custom edition of VisualGDB that supports RTOS thread state decoding, you can find what each of the threads is doing via the Debug->Windows->Threads window. In this example one of the threads is waiting for the radio modem to accept the command:
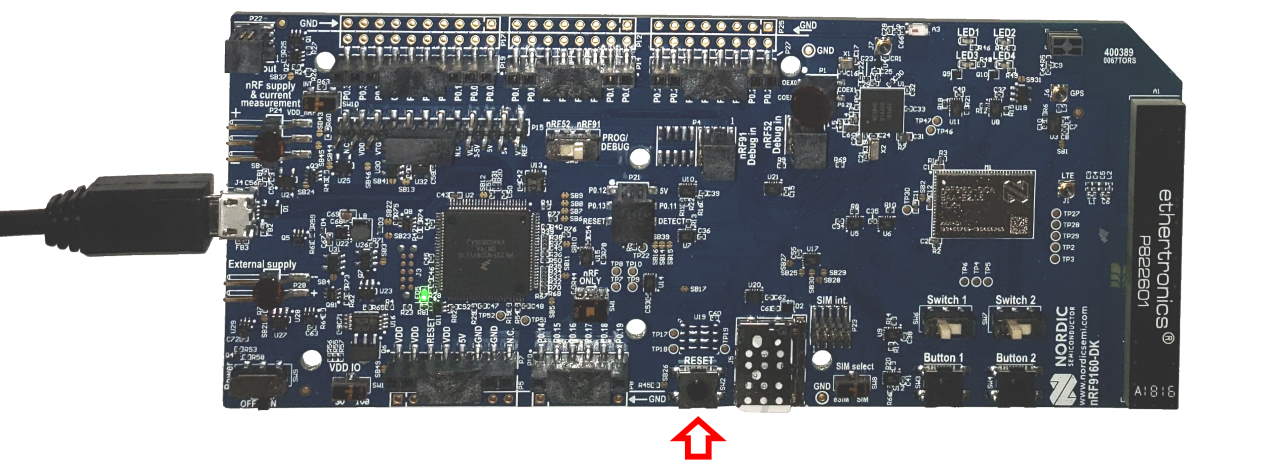
- If the device is not responding to AT commands properly, end the debug session with Shift-F5 and reset the board with the physical reset button:
- Now select “Debug->Attach to Running Embedded Firmware“:

- This will make sure that the radio modem and the main core are fully synchronized, so you will be able to run the AT commands successfully:
- The rest of the debugging functionality (e.g. breakpoints and stepping) will work as well:
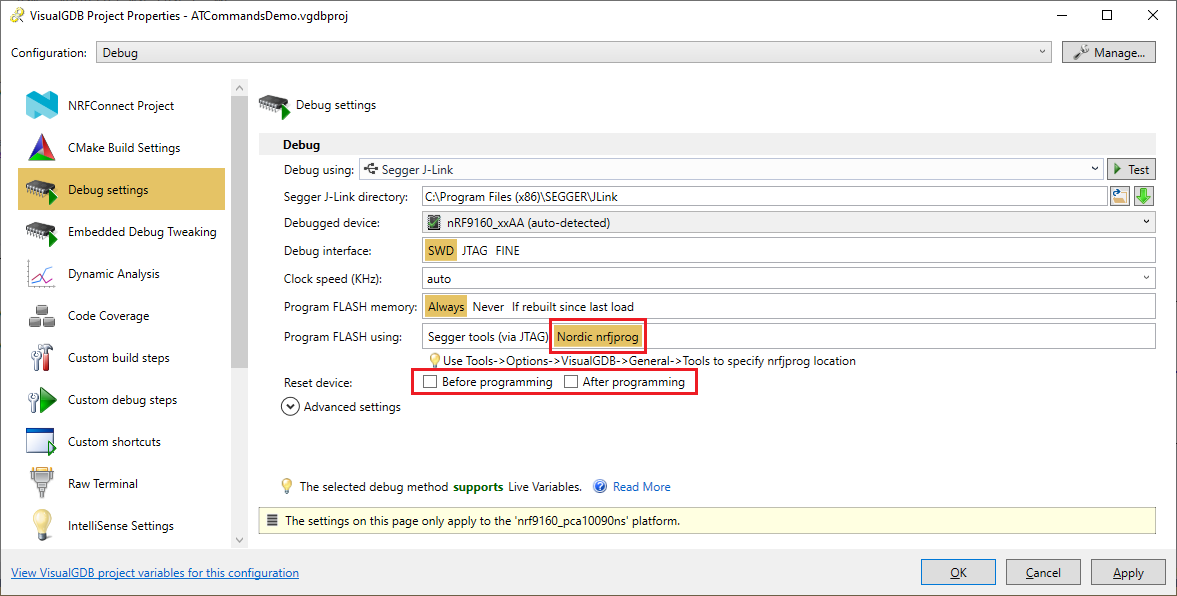
- You can avoid the need to reset the board manually by downloading the nRF command-line tools and configuring VisualGDB to program the FLASH memory using nrfjprog as shown below. Make sure you disable both “reset device” checkboxes:
- Now you will be able to debug the NRF9160 target without resetting it manually:

- Note that the breakpoint in main() won’t trigger as the chip will have to start up before attaching the debugger. You can work around it by adding the following function to your code and calling from main():
void __attribute__((noinline)) SysprogsWaitForDebugger()
{
    static volatile int SysprogsDebuggerAttached = 0;
    while (!SysprogsDebuggerAttached)
    {
    }
}
VisualGDB will automatically set SysprogsDebuggerAttached to 1 if the program is stopped inside SysprogsWaitForDebugger(), so the breakpoint in main() will successfully trigger:

- You can edit various properties of the project (and individual Zephyr libraries) via the VS Properties window. VisualGDB will automatically translate them to Zephyr-specific statements:

- Open VisualGDB Project Properties on the NRFConnect Project page. VisualGDB will parse the Zephyr KConfig menus letting you tweak various aspects of the project:
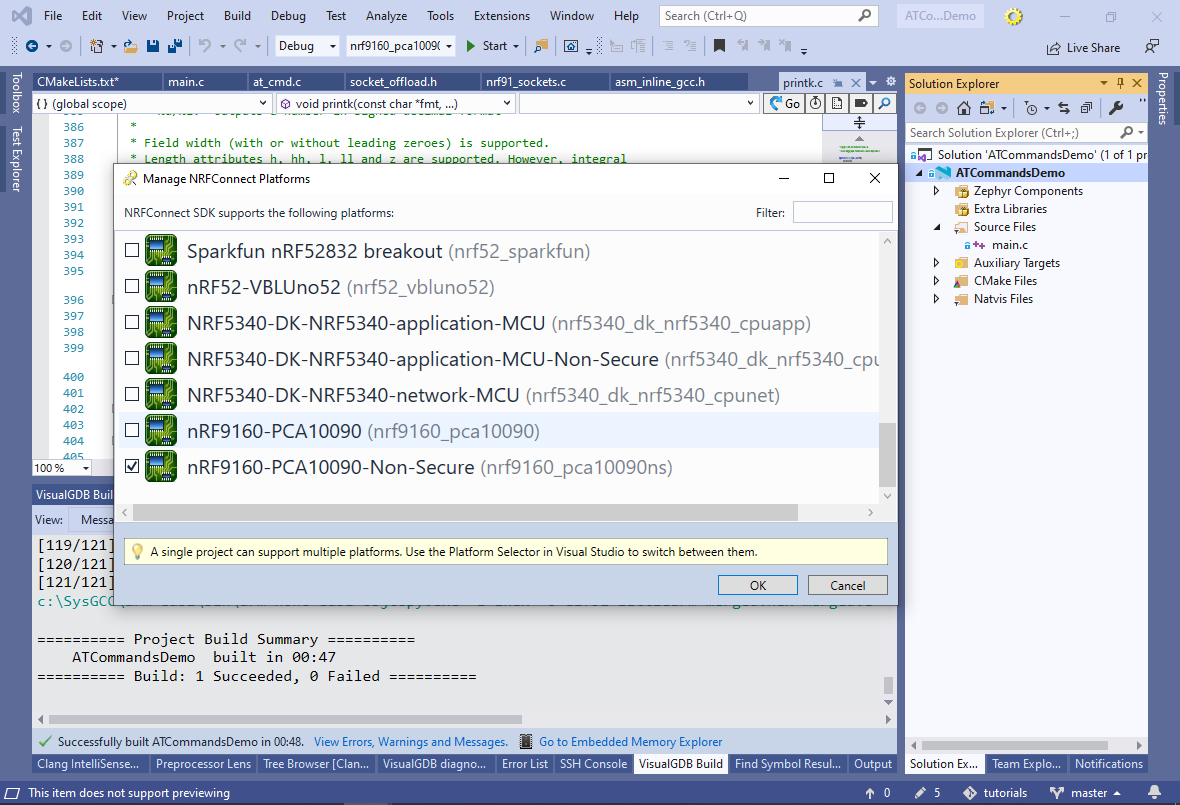
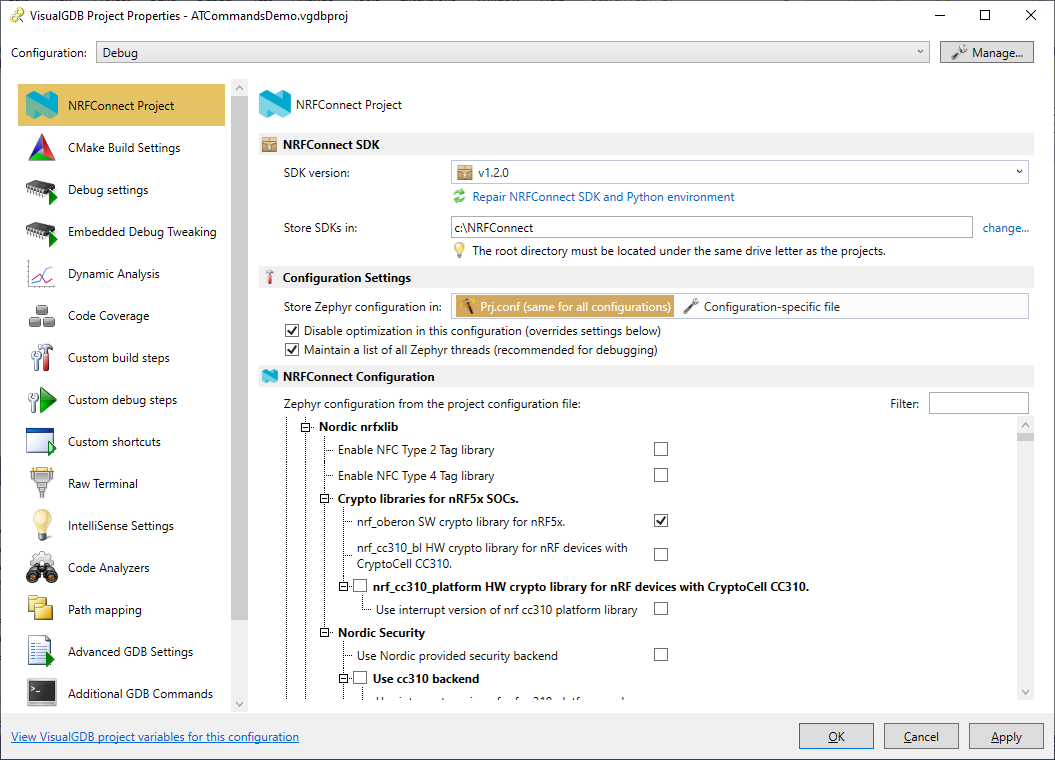 The KConfig options are normally stored in the prj.conf file that is shared between all configurations. On top of that, VisualGDB will automatically disable all optimization and enable Zephyr thread tracking for the Debug configuration (not for release). You can override this behavior, or choose to keep a separate configuration file for each configuration/platform via the “Configuration Settings” group.
 - A single NRFConnect project can target multiple different devices via separate Visual Studio platforms. You can edit the boards supported by a specific project by right-clicking on it in Solution Explorer and selecting Add->Manage NRFConnect Boards.
 If you have patched the NRFConnect SDK to support custom targets or properties, you can tweak the settings shown by VisualGDB by editing the rule files in the C:\Program Files (x86)\Sysprogs\VisualGDB\Rules\PropertyEngine\CMake\nrfconnect folder. You can also customize most of the NRFConnect-specific logic by editing the NRFConnect section in the C:\Program Files (x86)\Sysprogs\VisualGDB\Rules\RegularExpressions.xml file.