Debugging Multi-Core NXP Devices with LPC-Link and VisualGDB
This tutorial shows how to debug multi-core NXP devices, such as LPC55S69, using VisualGDB and the LPC-Link debug tools. Before you begin, make sure you can successfully build and debug a basic single-core project for the same device by following our MCUXpresso tutorial.
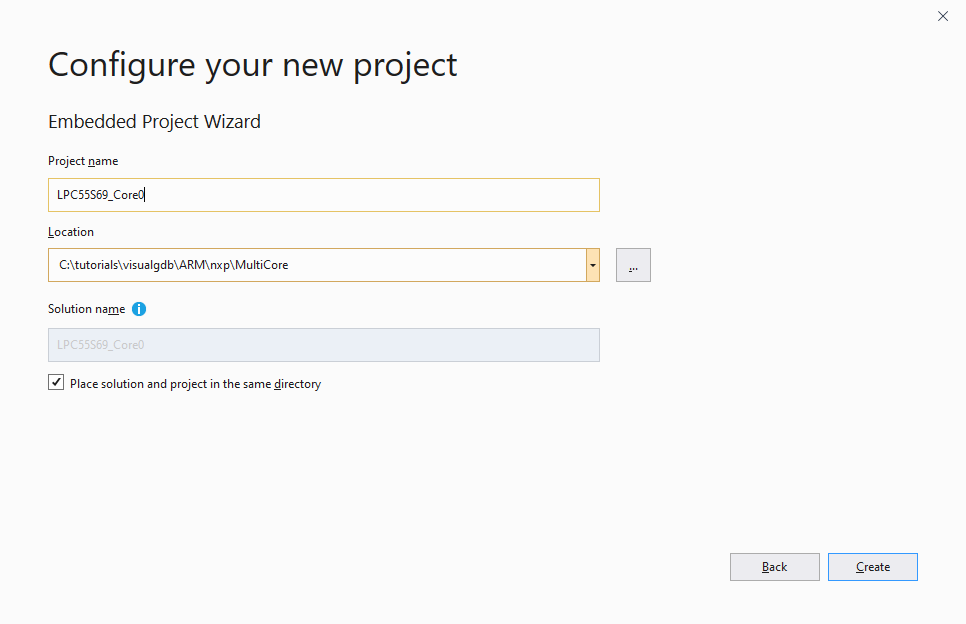
- In this tutorial, we will create a separate project for each core and will use 2 instances of Visual Studio to debug it. Start the first instance of Visual Studio and launch the VisualGDB Embedded Project Wizard. Pick the name and location for the first project:
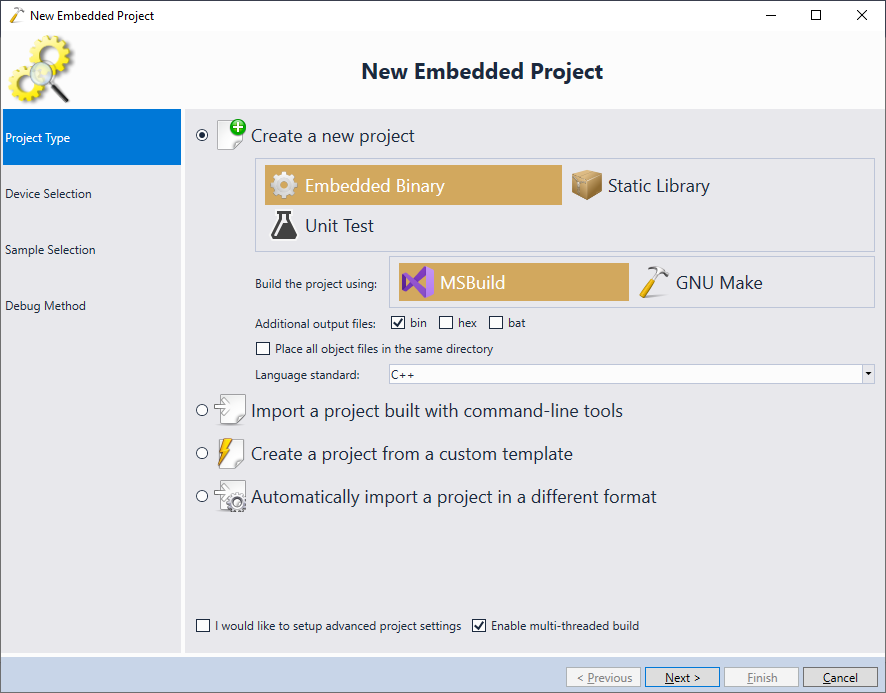
- Proceed with the default settings on the first page of the Embedded Project Wizard:
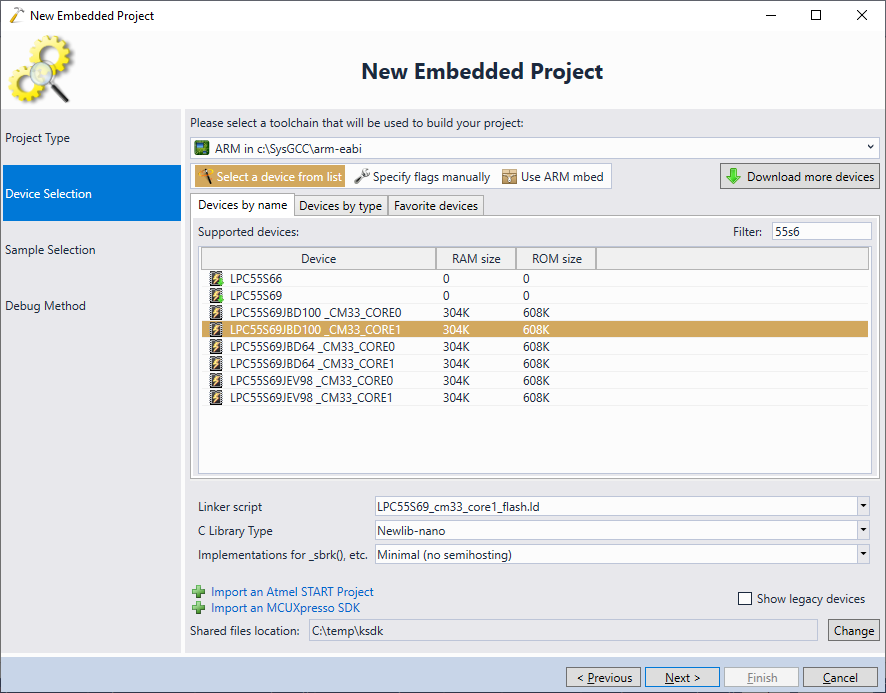
- Locate your device on the Device Selection page. Each core will be represented by a separate device entry. Select the CORE0 entry and click “Next”:

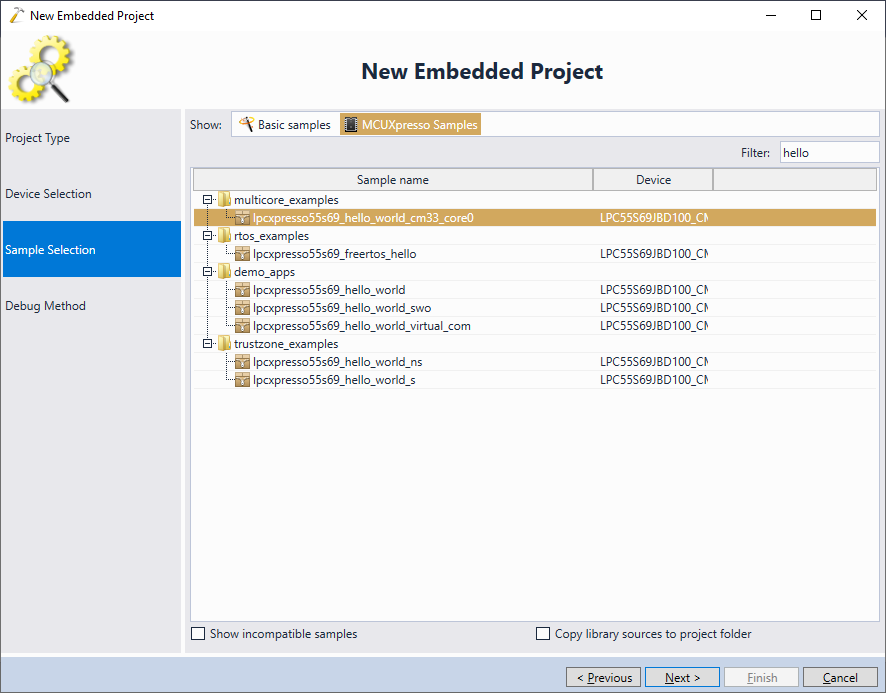
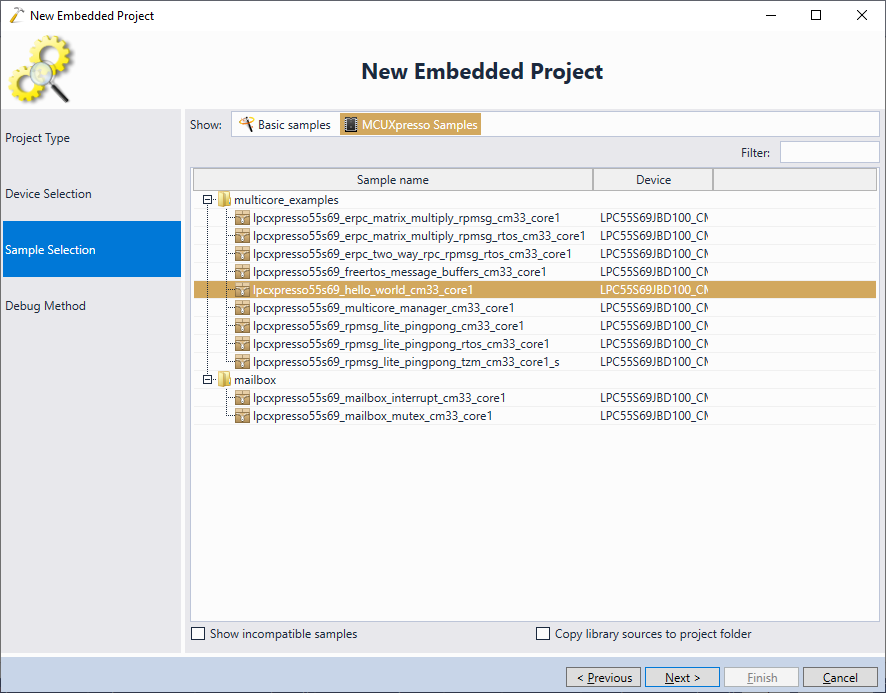
- On the next page, locate one of the multi-core examples. In this example, we will use the hello_world_cm33_core0 example:
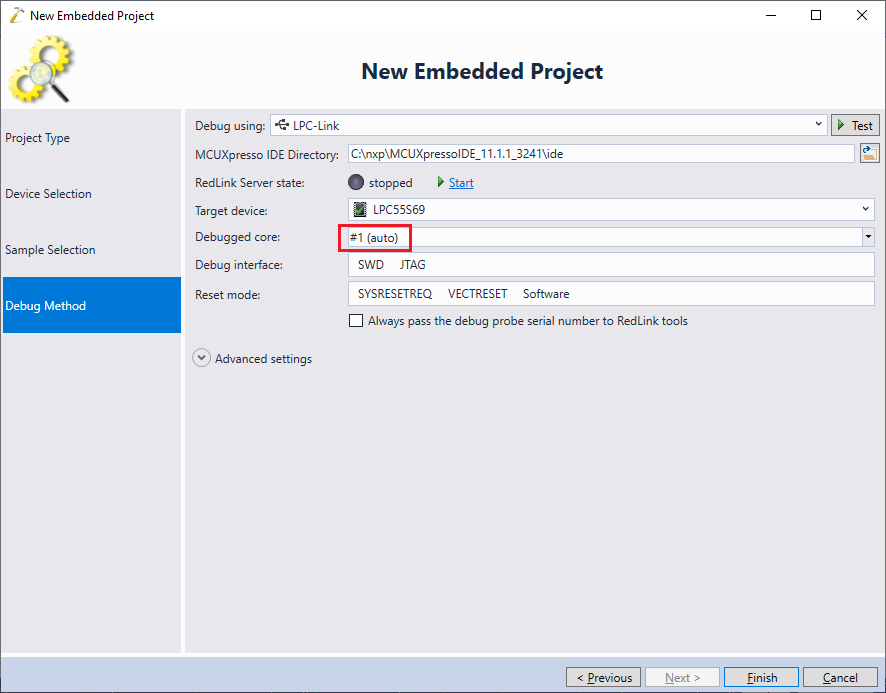
- Make sure the Debug Method page has the core #0 selected, then press “Finish” to generate a project:

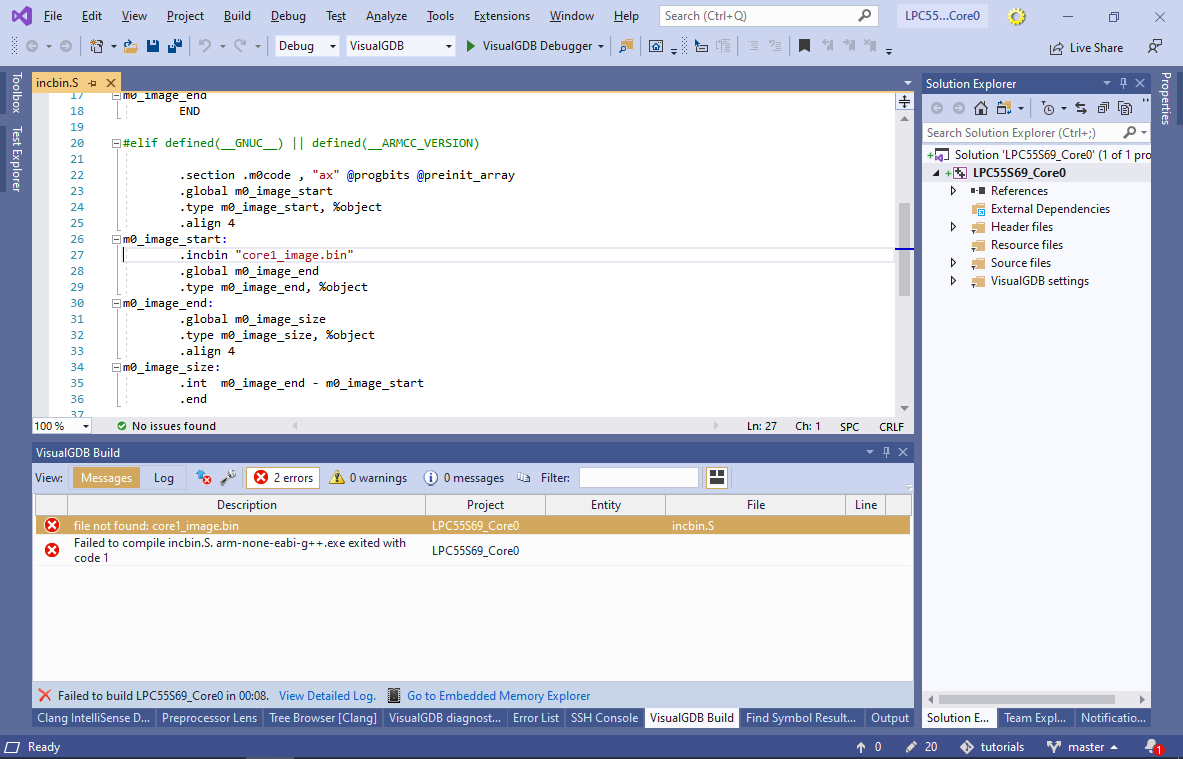
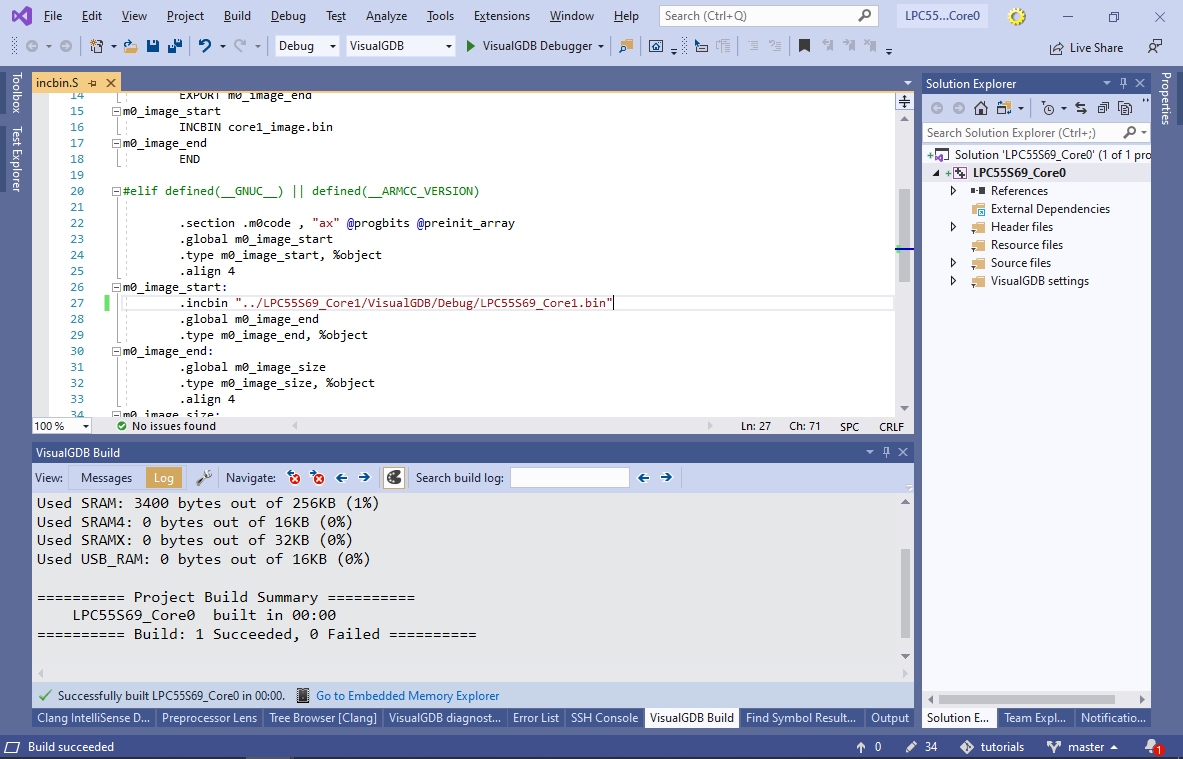
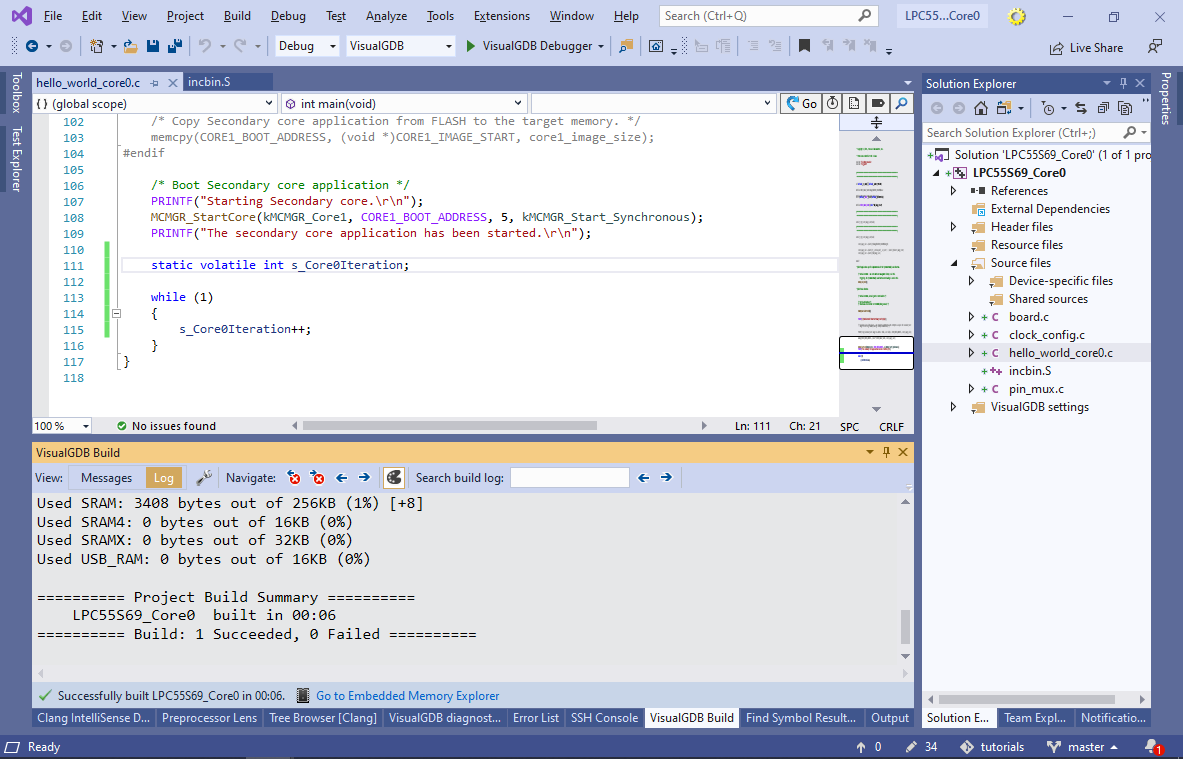
- Initially you won’t be able to build the project, as the firmware for core #0 includes a pre-built binary for the core #1:
- Start another instance of Visual Studio and create another project. This time, select CORE1:
- Make sure you select the core1 counterpart on the Sample Selection page:
- Also ensure that you have the core #1 selected on the Debug Method page:
- In order to observe what the firmware is doing without stopping it, we will add a static variable (s_Core1Iteration) to the main loop in main(). Build the project and ensure it succeeds:

- Update the project for the core #0 to include the correct binary for core #1:
- Add another static variable to monitor the state of core #0:
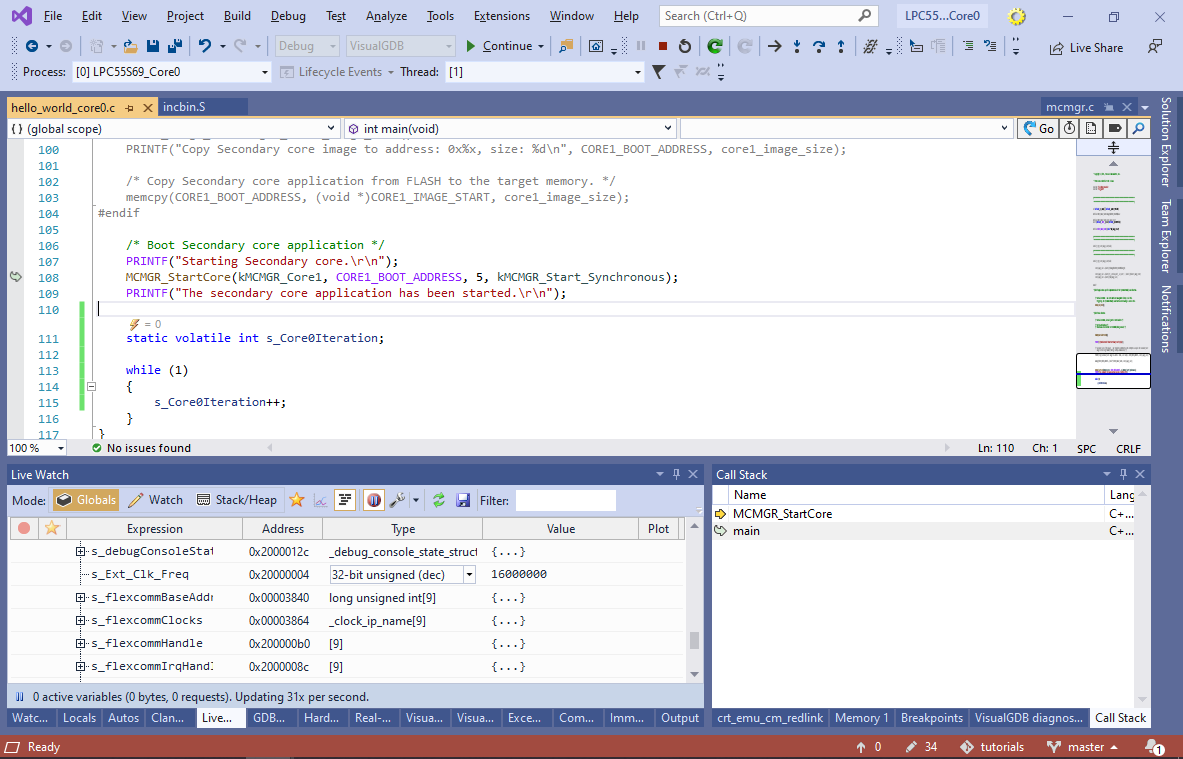
- Now you can start debugging core #0. Note that the main loop won’t start running until you attach a debugger to core #1:

- If you stop the core #0 now, you will see that it is waiting for core #1 to start in the MCMGR_StartCore() function:
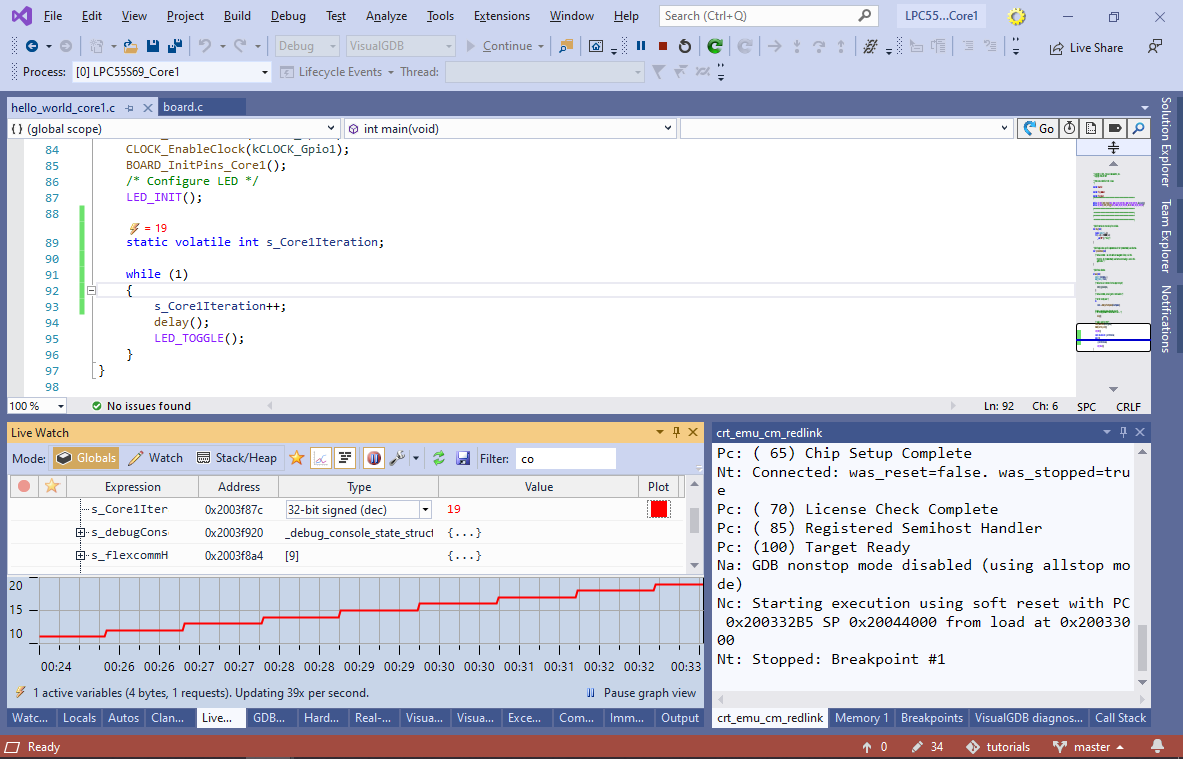
- Go to the second Visual Studio instance that has the project for core #1 and begin debugging. The s_Core1Iteration variable will start counting up:
- The first instance of Visual Studio will show that the main loop of core #0 has started as well:
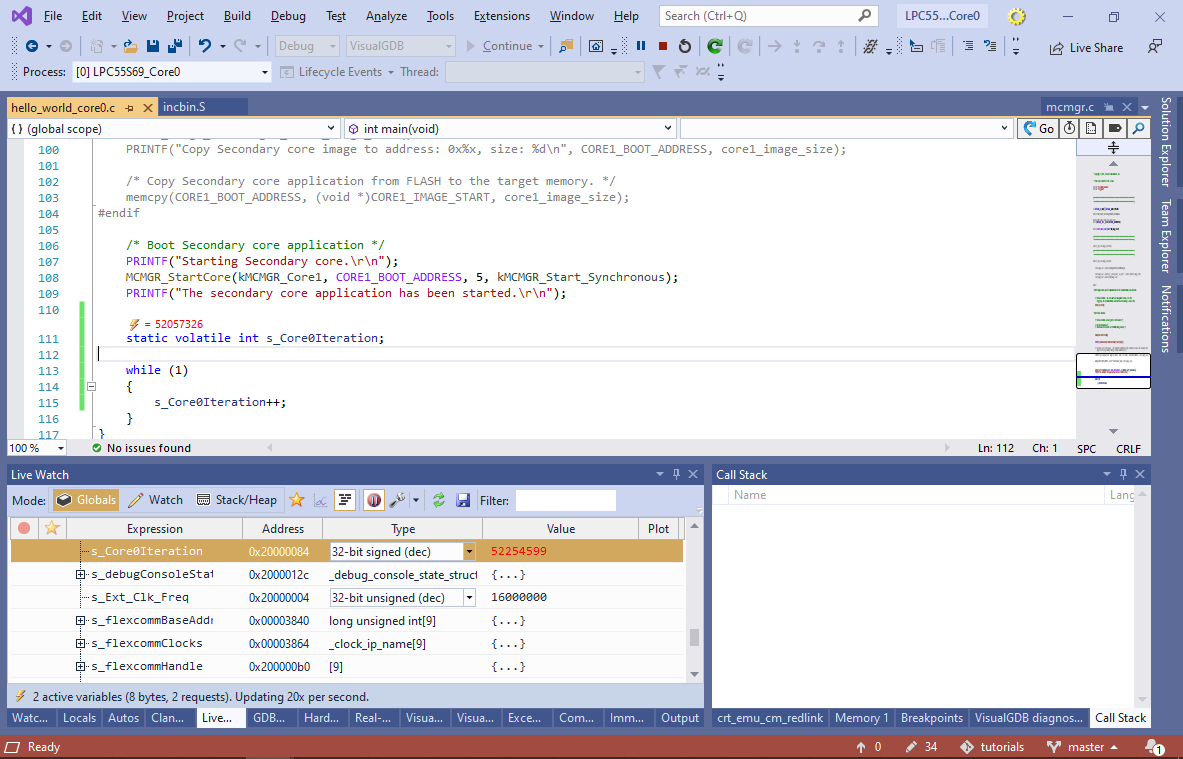 You can use the 2 instances of Visual Studio to debug each of the cores independently. Stopping one of the cores will not affect the state of the other core.
You can find the source code for the project shown in this tutorial in our GitHub repository.