Debugging External Projects with Embedded Quick Debug
This tutorial shows how to quickly debug embedded projects built outside VisualGDB using the Embedded Quick Debug feature introduced in VisualGDB 5.1.
In this tutorial we will show how to build the USB CDC sample for the MCUXpresso SDK for the i.MXRT1050 board using the CMake-based build system from MCUXpresso and will debug it from VisualGDB without converting it to a VisualGDB project.
Before you begin, install VisualGDB 5.1 or later, build the MCUXpresso SDK for your device, and make sure it includes support for the ARM GCC compiler. Install the Sysprogs ARM toolchain if you are missing one.
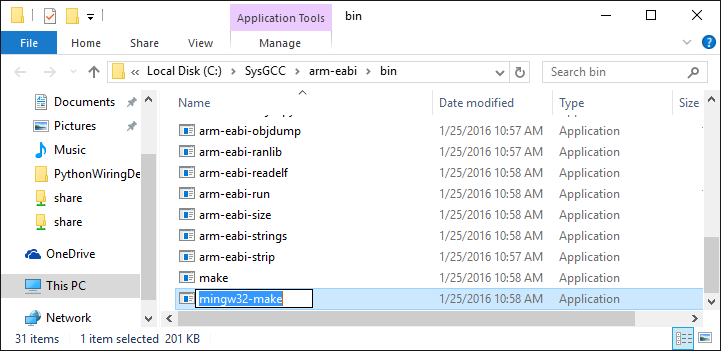
- Go to the toolchain binary directory and copy the make.exe file to mingw32-make.exe. This is necessary because the KSDK build scripts expect the Make tool to be named like that:
- Open a command prompt window and add both CMake and ARM toolchain directories to PATH. Also set the ARMGCC_DIR variable to the location of your ARM toolchain, e.g.:
set PATH=%PATH%;C:\Program Files (x86)\CMake\bin;C:\SysGCC\arm-eabi\bin
set ARMGCC_DIR=c:\sysgcc\arm-eabi
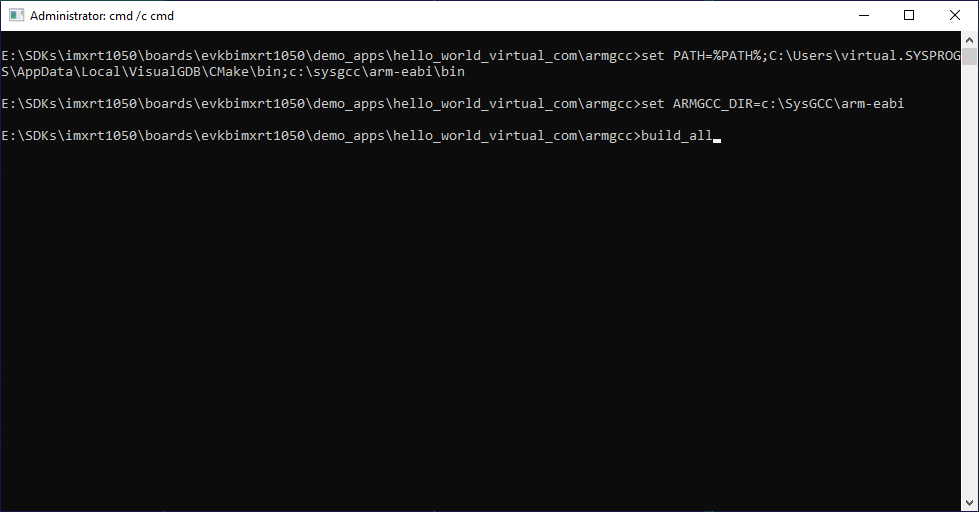
- Go to the build directory of the CDC device example (<SDK>\boards\evkbimxrt1050\demo_apps\hello_world_virtual_com\armgcc) and launch the build_debug.bat script:
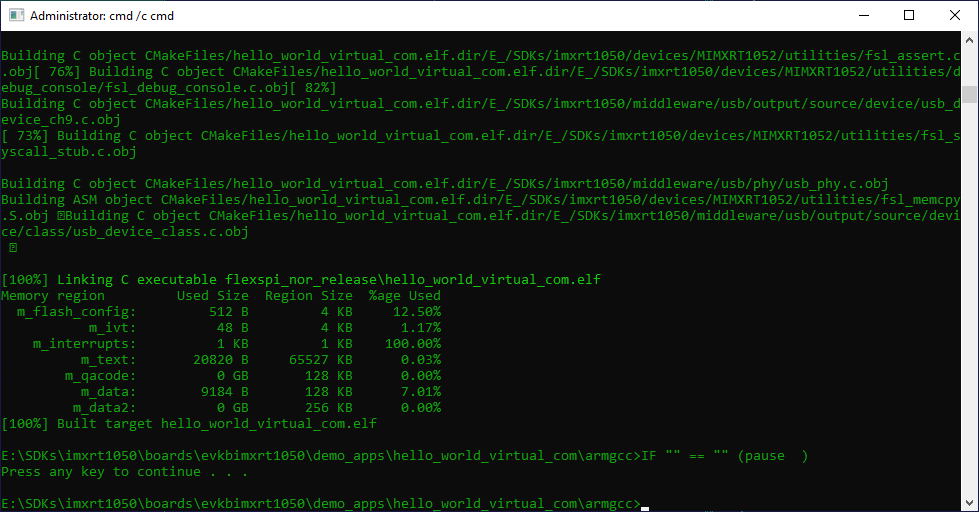 Make sure the build succeeds and take a note of the built executable name (hello_world_virtual_com.elf in this example)
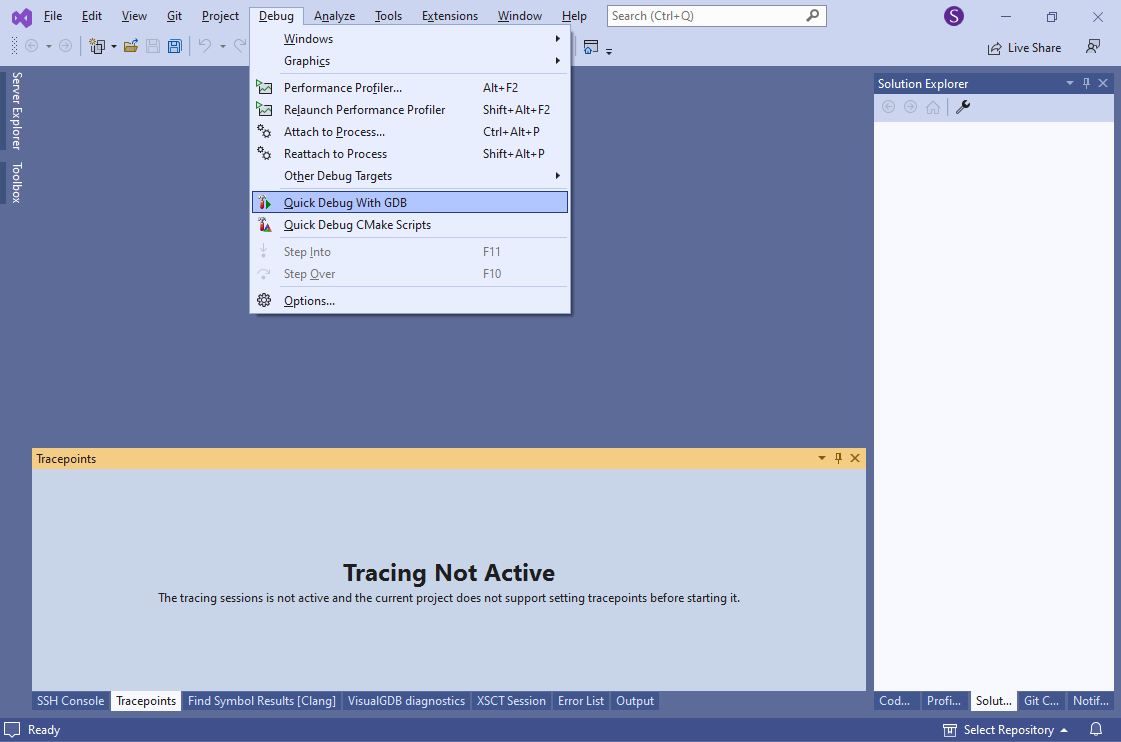
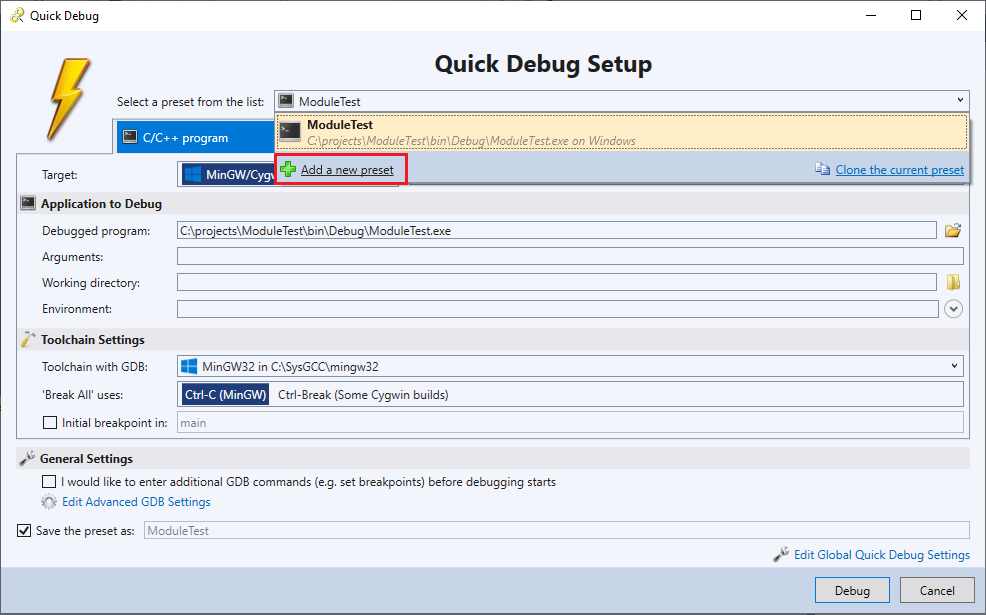
 - Now that the example was built successfully, you can debug it from Visual Studio using the VisualGDB Quick Debug feature. Start Visual Studio and select Debug->Quick Debug with GDB:
- If you already used Quick Debug for other project types, click “Add a new preset” to avoid changing the existing setups:
- Select “Embedded firmware”, locate the ELF file built by CMake (boards\evkbimxrt1050\demo_apps\hello_world_virtual_com\armgcc\debug\hello_world_virtual_com.elf) and provide the following settings:
Toolchain ARM Device (2) the debugged device is not listed Initial stop function: main Debug using Segger J-Link Debugged device (5) MIMXRT…. 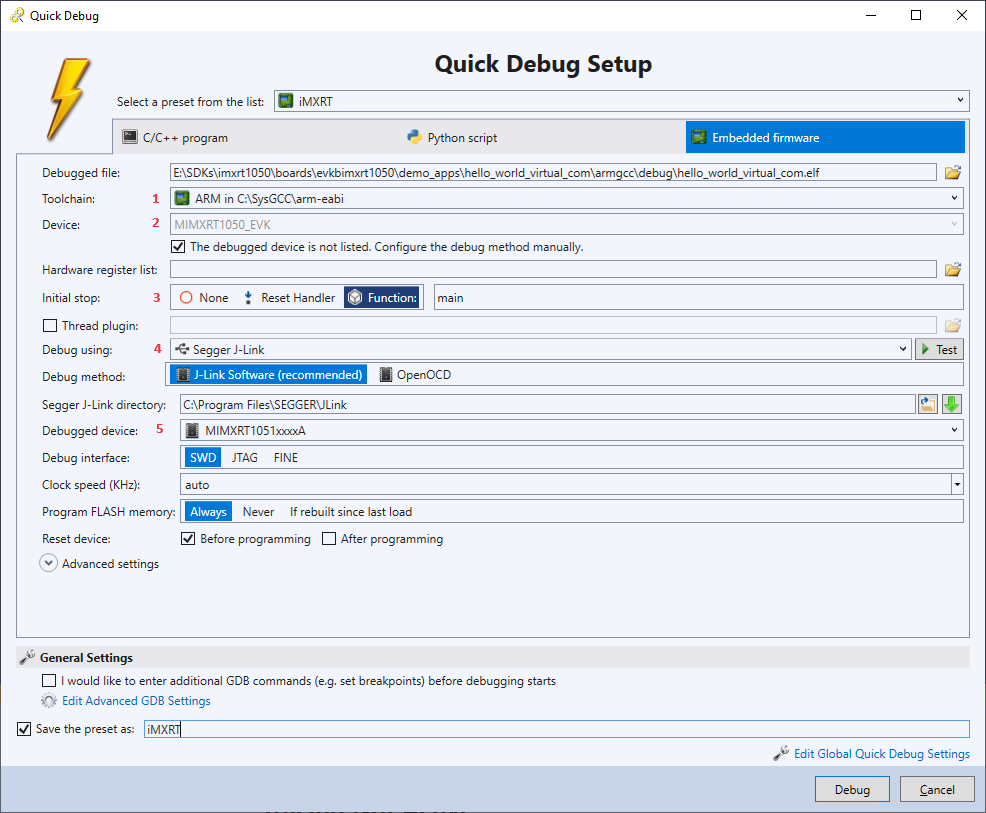 Ensure you set the “Save the preset as” checkbox so that the settings you enter are saved and you won’t need to enter them next time.
 - Note that the Quick Debug window has 2 different device selection fields. If you have installed a regular VisualGDB BSP for the device, you can select it in the first field (2). VisualGDB will load additional information for it (e.g. hardware register definition) and will automatically filter out incompatible debug methods (e.g. won’t suggest ESP32 OpenOCD for ARM devices). However, if the SDK is missing or does not contain a complete device definition, VisualGDB may report that there are no compatible debug methods:
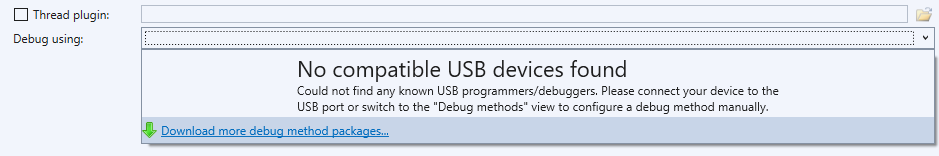 If this happens, check the “The debugged device is not listed” checkbox and manually select the debug method below. Most debug methods (e.g. Segger J-Link) have their own list of compatible devices that can be selected via the lower field (5) and does not require installing a VisualGDB BSP.
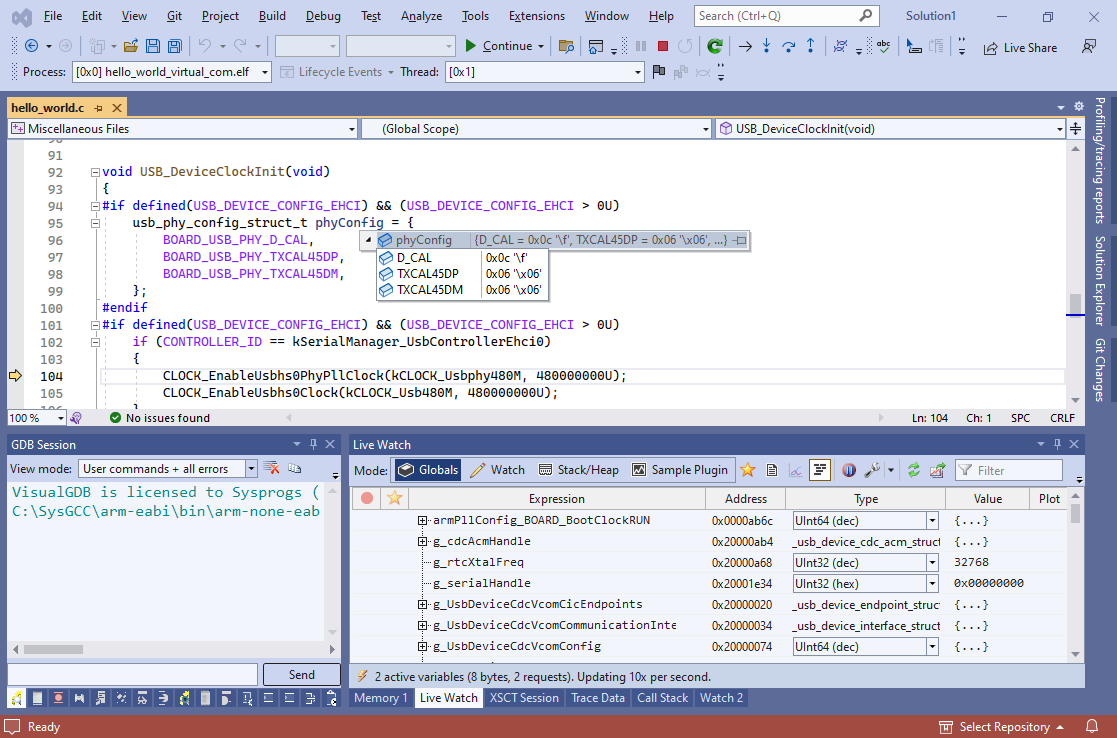
 - Connect your board to the USB port and connect the Segger J-Link to it. VisualGDB will program your ELF file into the board and stop at the main() function:
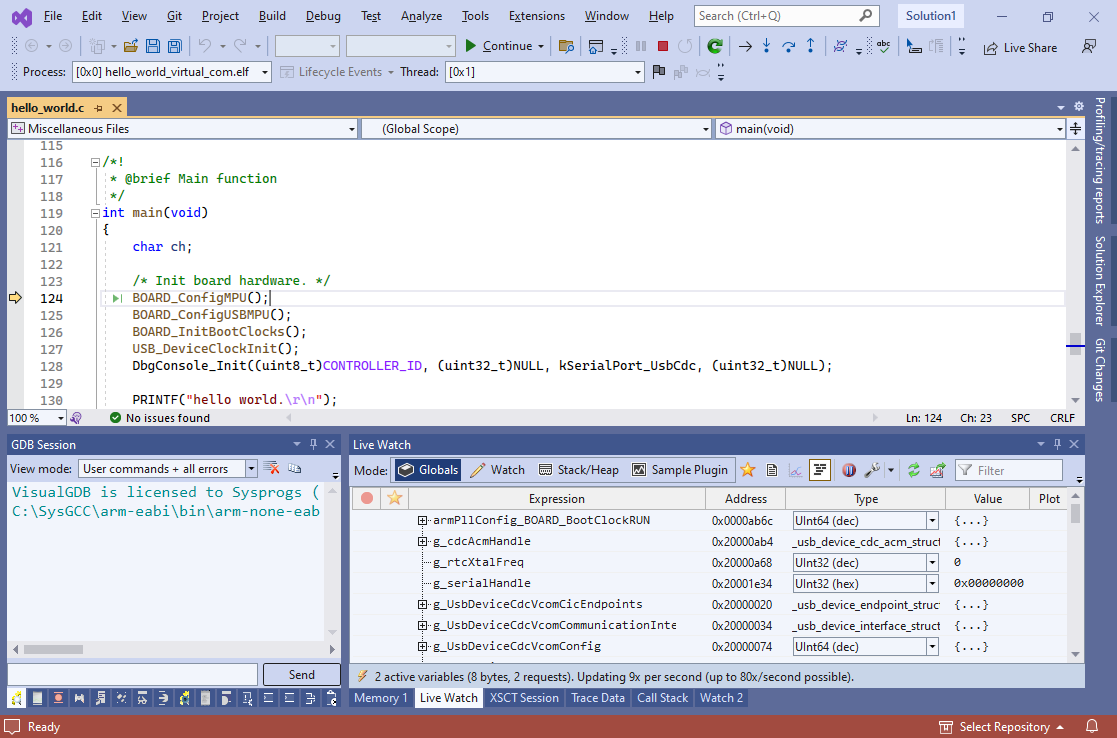 Note the because you did not create a VisualGDB project, the IntelliSense engine won’t be able to locate all files, so functionality like go-to-definition and automatic highlighting of inactive #ifdef blocks won’t work.
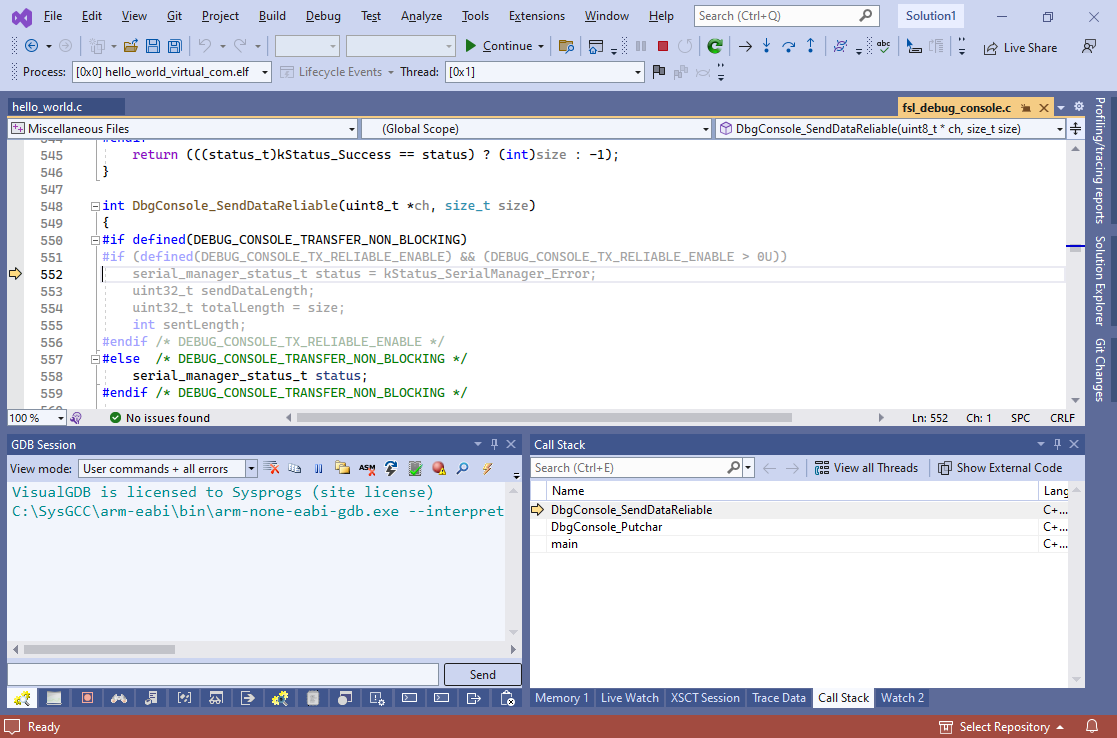
 - Step through the main() function to verify that the debugging is working:
- Now we will test out the USB functionality. Connect the second USB connector to the board and ensure that the device shows up in the Device Manager:
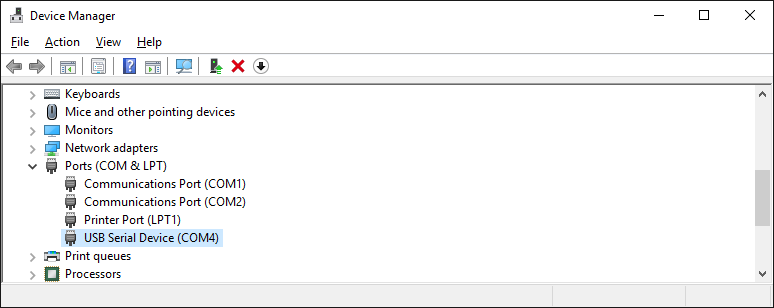 If Windows does not recognize it, try installing the driver from the <KSDK>\examples\frdmkl25z\demo_apps\usb\device\cdc\virtual_com\inf directory.
 - Set a breakpoint in the main() function on the line calling PUTCHAR() and connect to the COM port via SmarTTY:
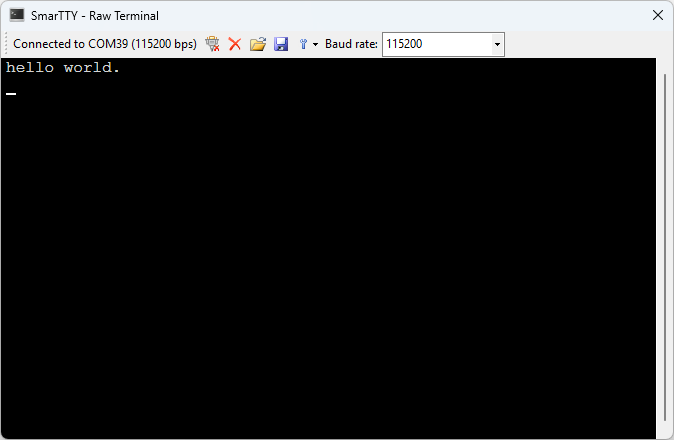 Observe the “hello world” output from the board.
 - Try typing something in SmarTTY. The breakpoint should trigger and you should see the character you typed:
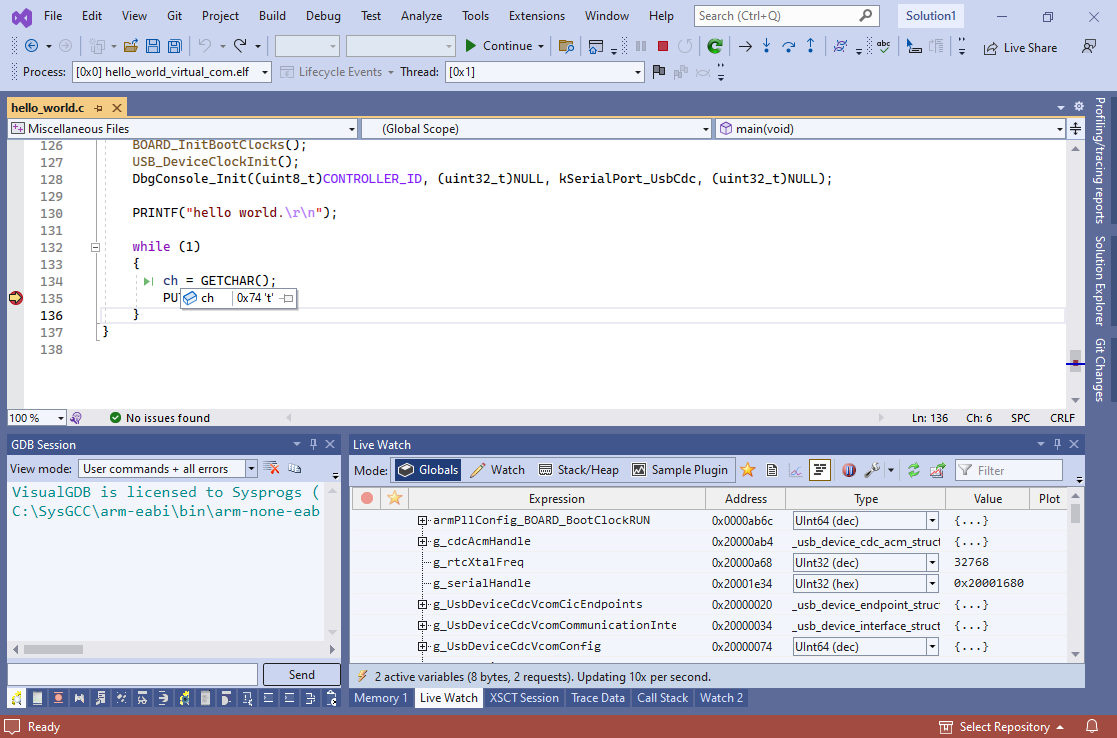
- You can step through the code as usual, set breakpoints, view variable values, use Live Watch, etc.:
 VisualGDB will automatically save your debugging settings in the Quick Debug setup, so next time you want to debug the same executable, you can simply click Debug->Quick Debug with GDB and get a debug session running without having to re-enter anything.


If you would like to preserve additional settings (e.g. breakpoints) or have better control over IntelliSense, consider importing the project as an externally built one. This way you won’t need to convert the project to the VisualGDB build system (it will just run an arbitrary command line for building it), but can still make use of better IntelliSense or have multiple debugging configurations.