Debugging Embedded Projects Remotely
This tutorial shows how to debug embedded VisualGDB projects remotely, i.e. with the JTAG/SWD debugger connected to a different physical machine.
We will create a basic STM32-based project debugged with OpenOCD, and will show how to change the settings to run OpenOCD on a remote machine and connect to it from VisualGDB.
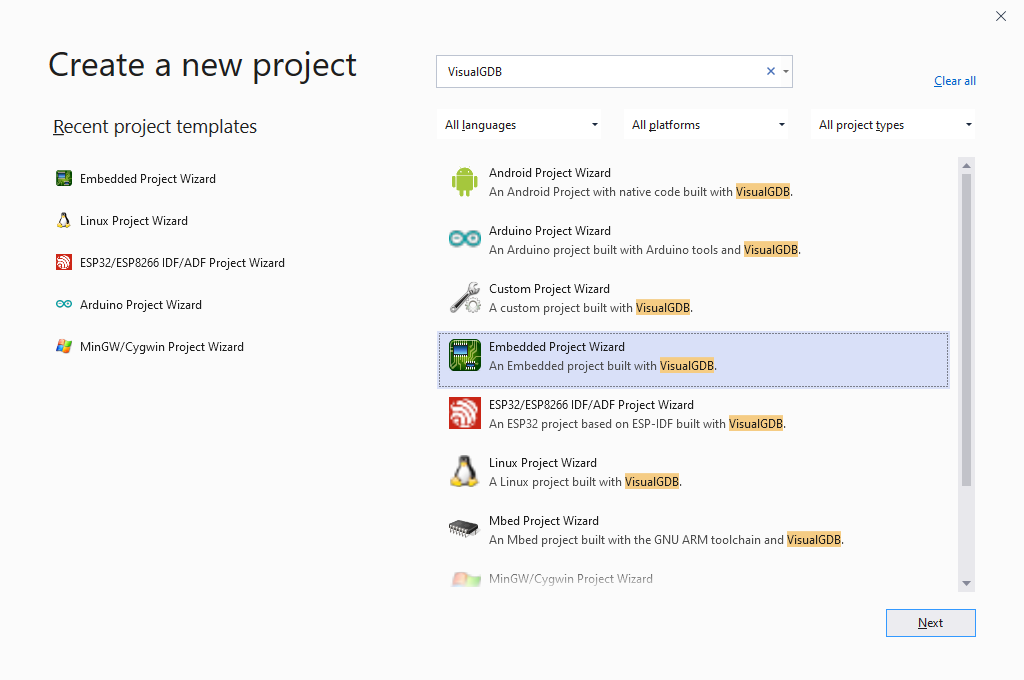
- Start Visual Studio and open the VisualGDB Embedded Project Wizard:
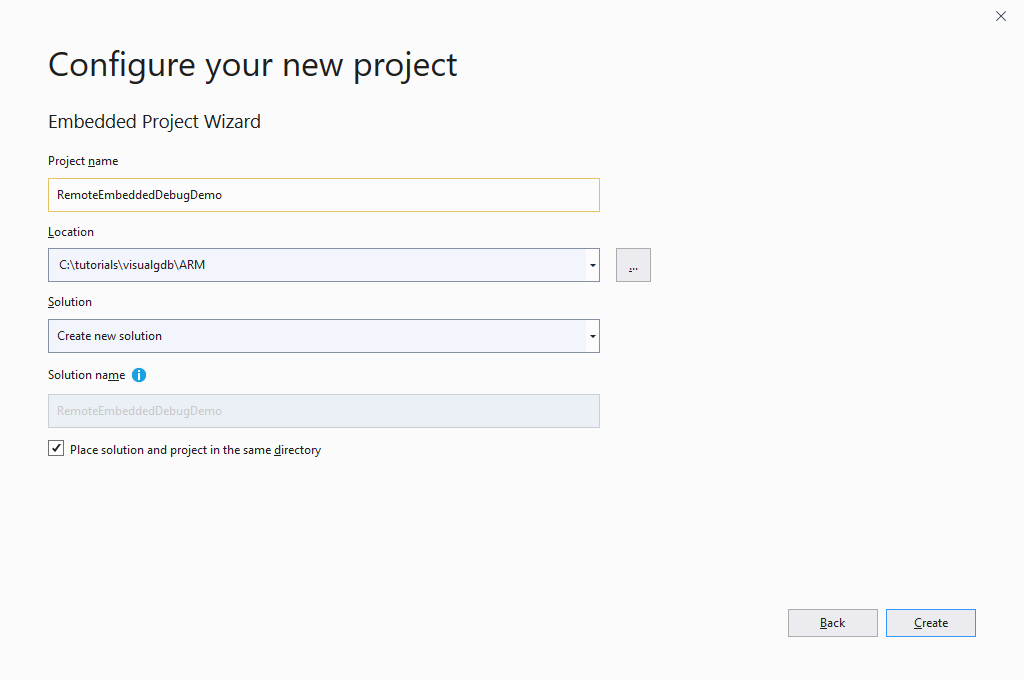
- Enter a name and location for the new project:
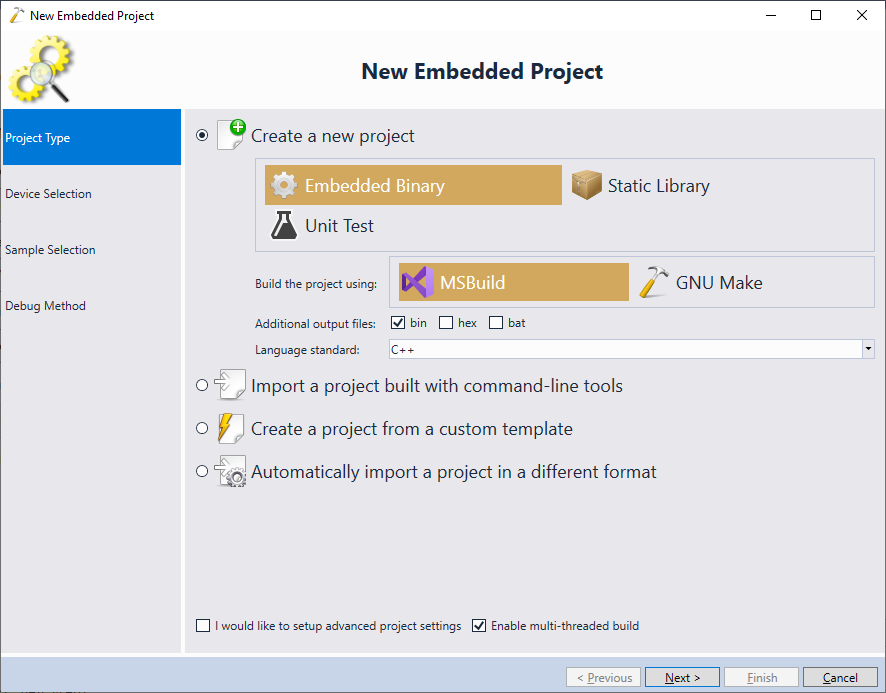
- Proceed with creating a new MSBuild-based embedded binary:
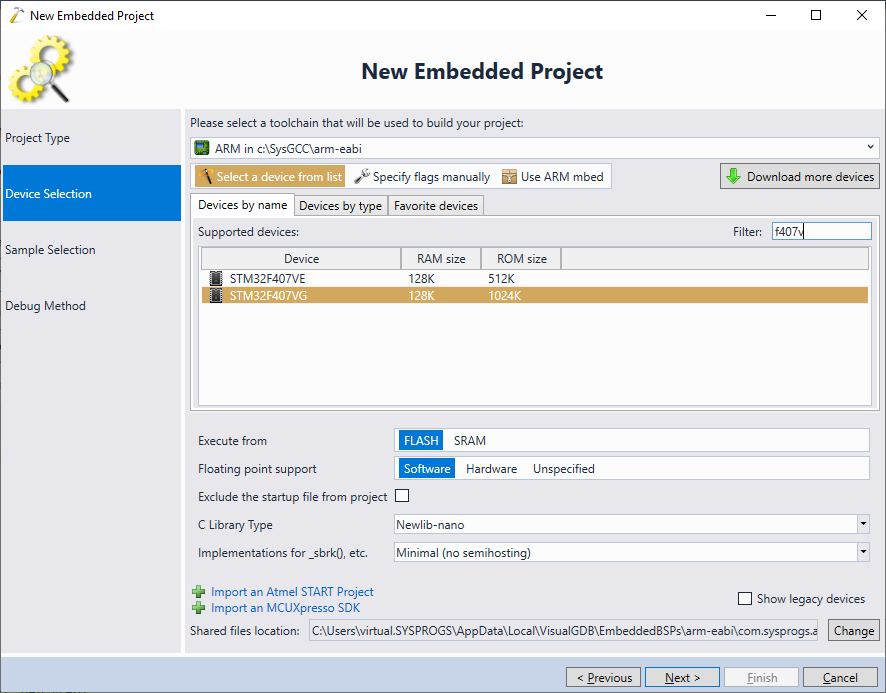
- On the next page of the wizard, select your toolchain and device. Then proceed with the default settings:
- In this tutorial we will be focusing on configuring the debugger, so pick the simplest “LEDBlink” sample:

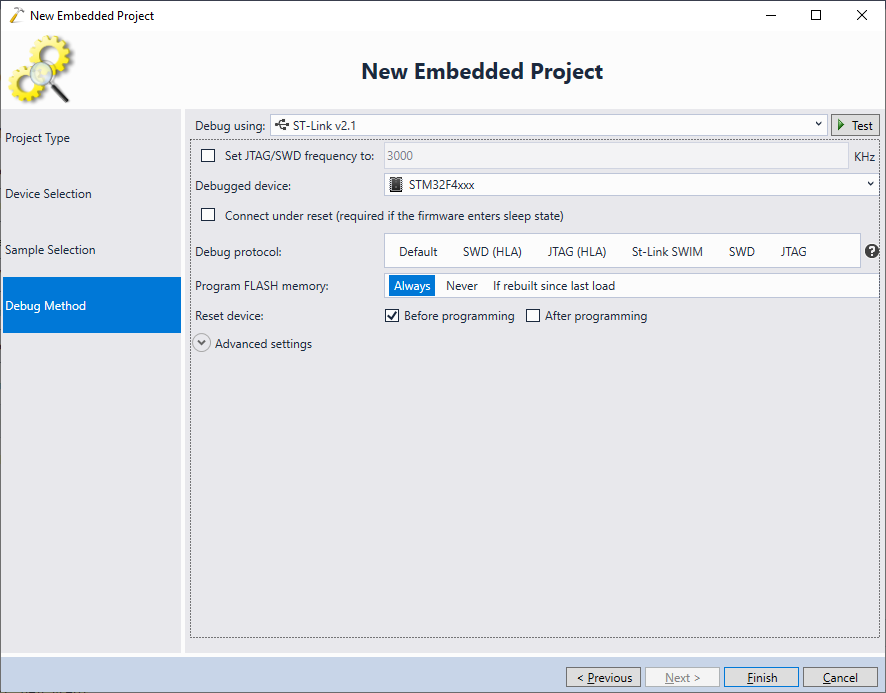
- Finally, choose the debug settings. We will begin with a regular OpenOCD-based setup where the ST-Link is connected to the main development machine. Later in the tutorial, we will update it to run OpenOCD remotely:
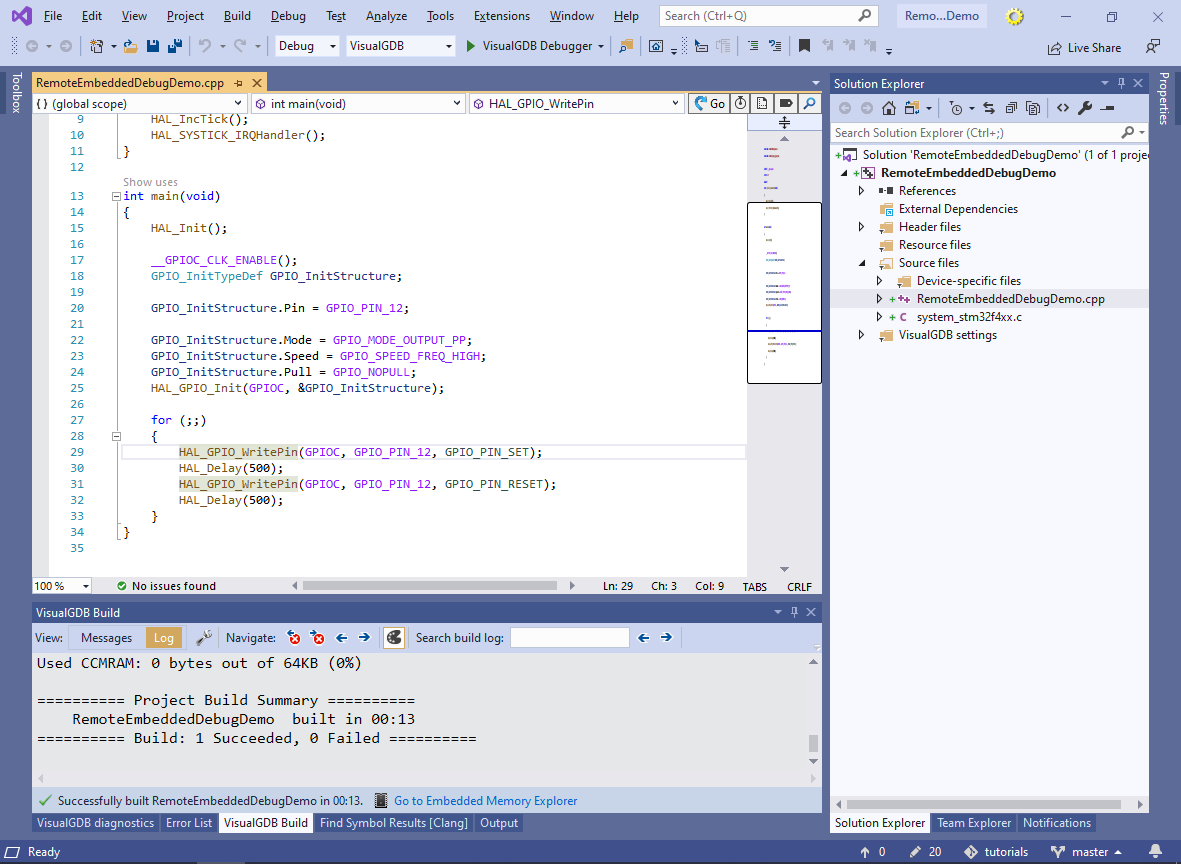
- Click “Finish” to generate the project. Once it is created, build it by pressing Ctrl-Shift-B:
- Debugging embedded projects generally involves 3 components:
-
- VisualGDB integrated in Visual Studio that controls other tools
- GDB debugger that translates names (e.g. main()) to addresses, evaluates variables, etc
- GDB stub, such as OpenOCD, that interacts with the hardware and handles low-level requests from GDB. Since the debugging symbols are handled by gdb, OpenOCD (or another gdb stub) does not need to access the built project, and can generally run on any computer accessible via network.
The diagram below summarizes the setup:

Before we can switch to running OpenOCD on another machine, we would need to make note of all command lines and GDB commands involved in running it manually.
-
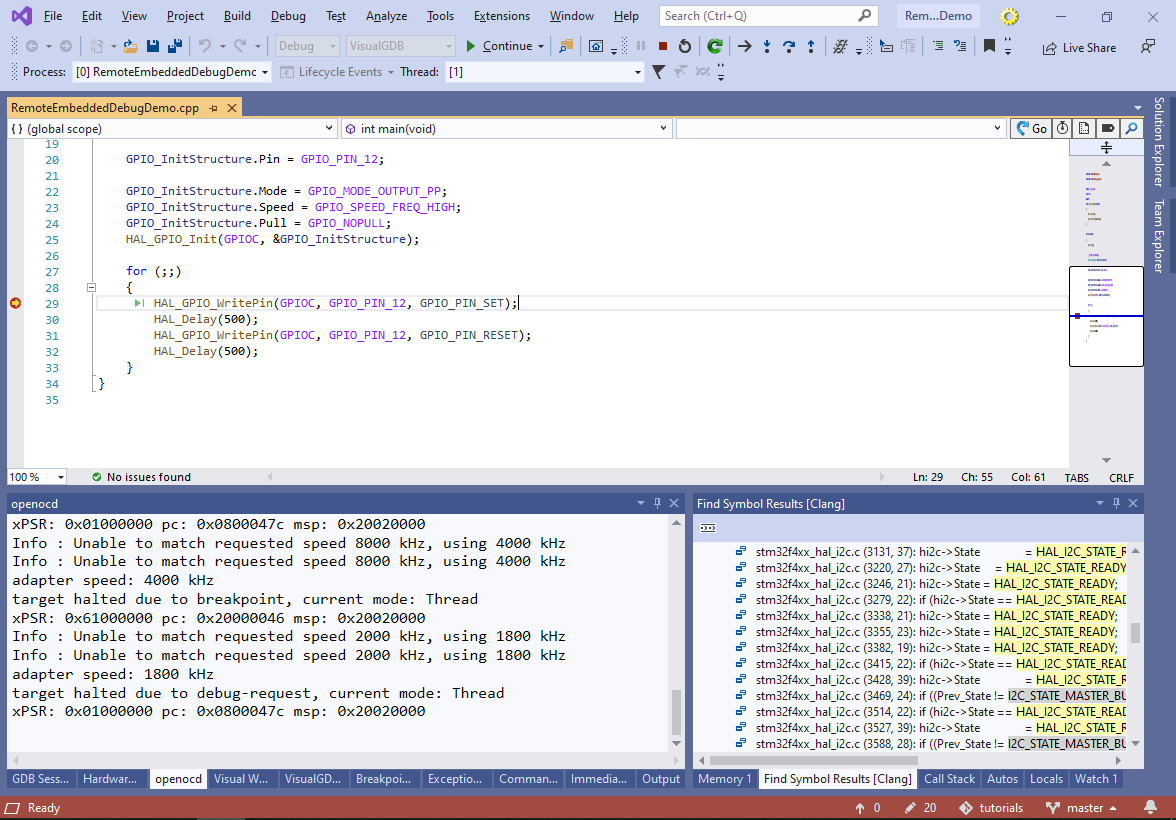
- Set a breakpoint somewhere in the main() function and start debugging. Once the breakpoint triggers, open the Debug->Windows->GDBServer Console window and make a note of the command line:
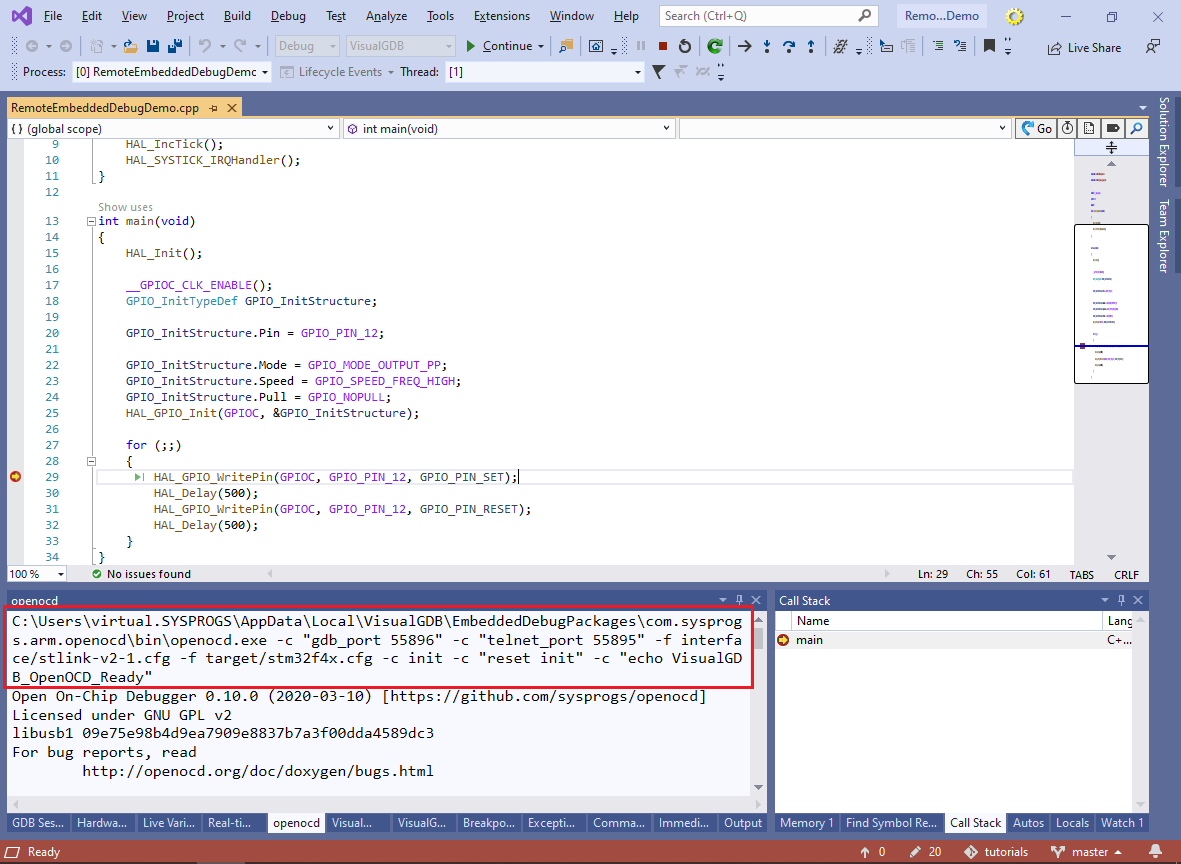 A typical OpenOCD command line is shown below:
C:\Users\virtual.SYSPROGS\AppData\Local\VisualGDB\EmbeddedDebugPackages\com.sysprogs.arm.openocd\bin\openocd.exe -c "gdb_port 55896" -c "telnet_port 55895" -f interface/stlink-v2-1.cfg -f target/stm32f4x.cfg -c init -c "reset init" -c "echo VisualGDB_OpenOCD_Ready"
- Now open the GDB Session window and switch it to the “All GDB Interaction” mode. Locate the “target remote command”:
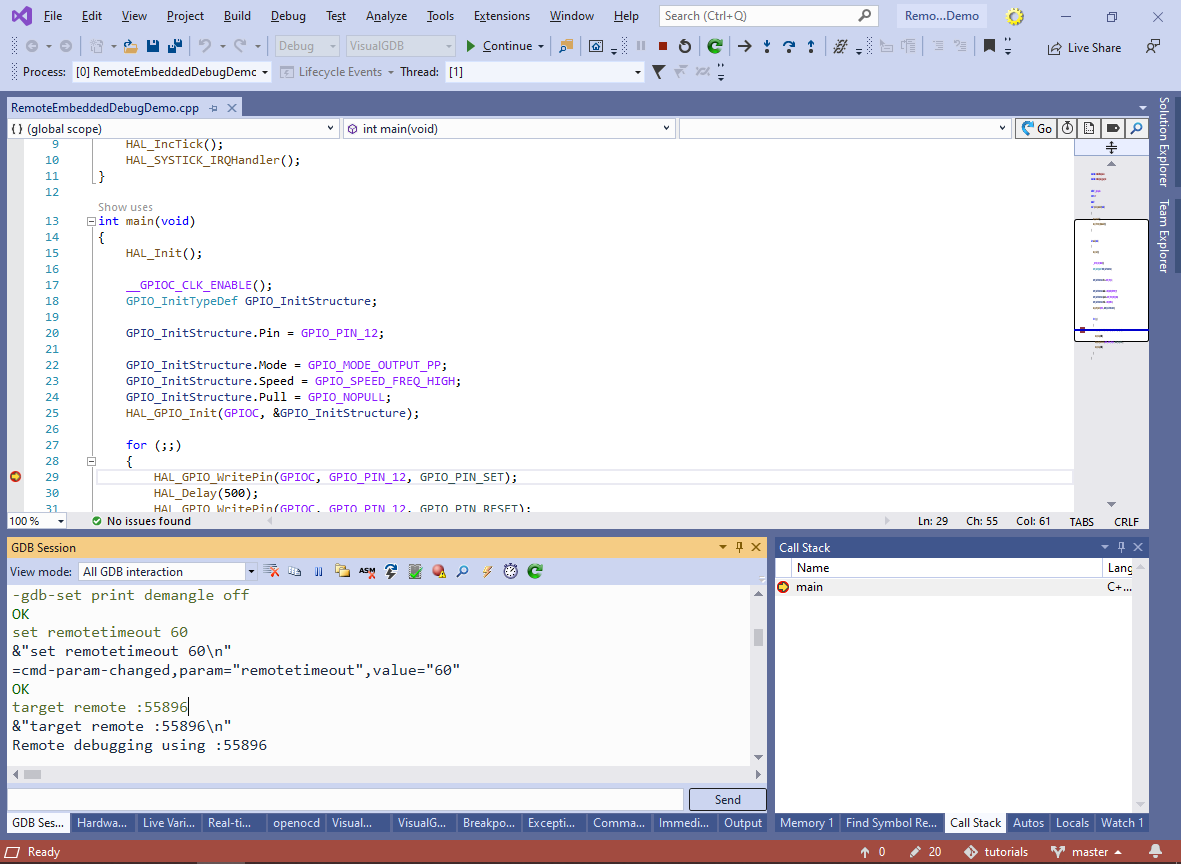 The “target remote” command tells GDB to connect to the port where OpenOCD is listening (see the gdb_port command). Once it is connected, GDB will drive the high-level aspects of the debug session, while OpenOCD will drive the low-level parts.
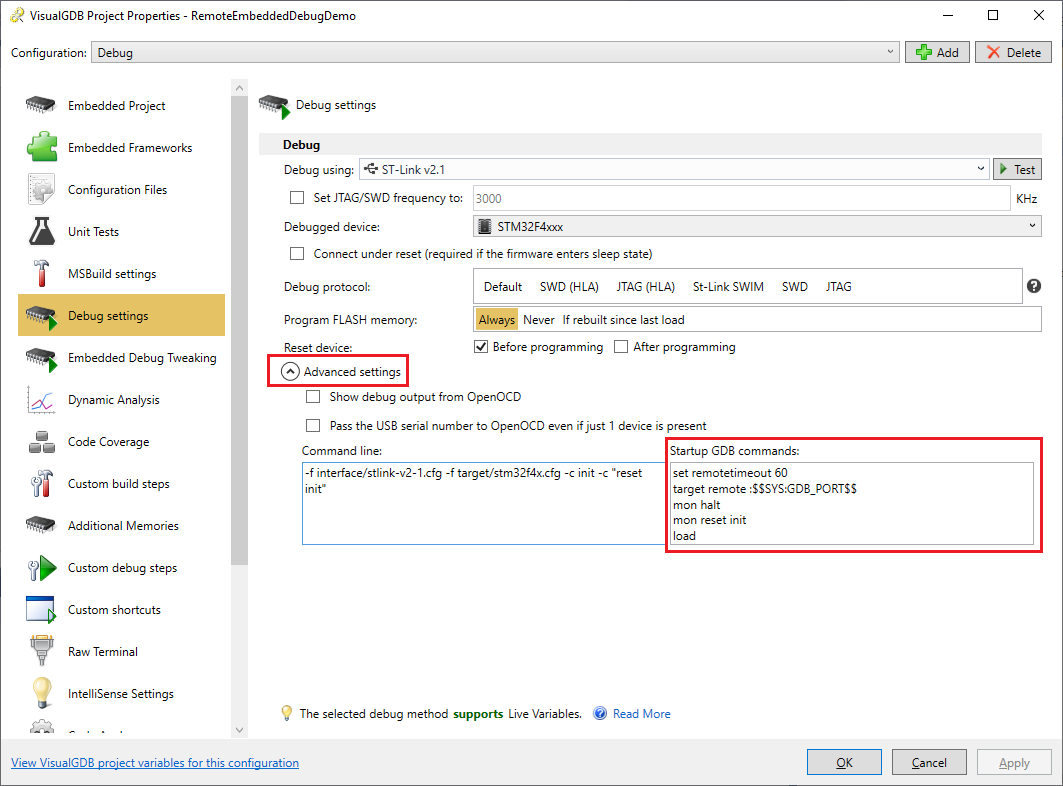
 - In addition to the “target remote” command, VisualGDB issues a few special commands to reset the device and program its FLASH memory. If you are using OpenOCD, you can find them in the “Startup GDB Commands” field inside Advanced Settings:
- Now that we know the OpenOCD command line, we can run it on a different machine. In this tutorial, we will run a Linux port of OpenOCD on a Linux machine, however you can also run it on Windows by copying the OpenOCD package to another computer. Add the following argument to the beginning of the captured gdb command line and run it on the second machine:
-c "bindto 0.0.0.0"
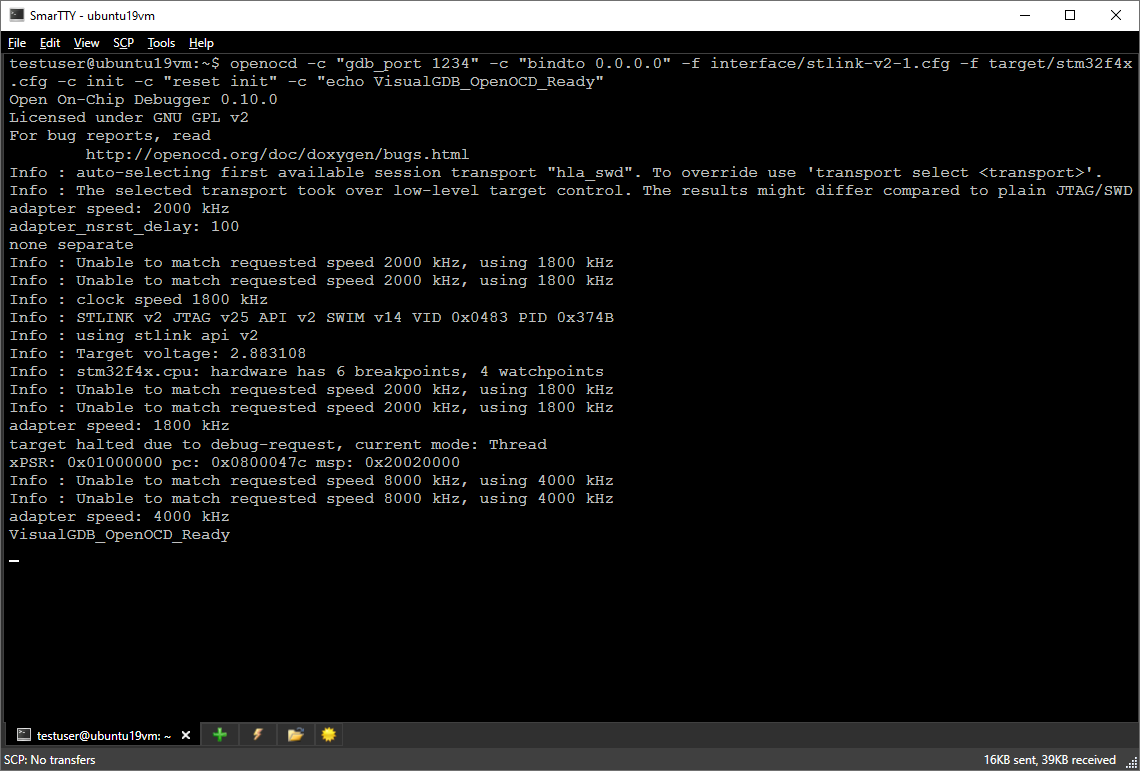 The “bindto 0.0.0.0” command tells OpenOCD to accept connections from all remote machines, not just localhost. If you are using J-Link or another tool instead of OpenOCD, refer to its documentation for the name of the equivalent command.
 - Go to the Debug Settings page of VisualGDB Project Properties and switch the Debug Method to “Full-Custom Mode” (you will need to switch the view from USB Devices to Debug Methods). Then, enter the following parameters:
Parameter Value Command <path to gdb.exe> Arguments –interpreter mi $(TargetPath) Target selection command target remote <name of machine running OpenOCD>:<port> After selecting target Use the “continue” command 
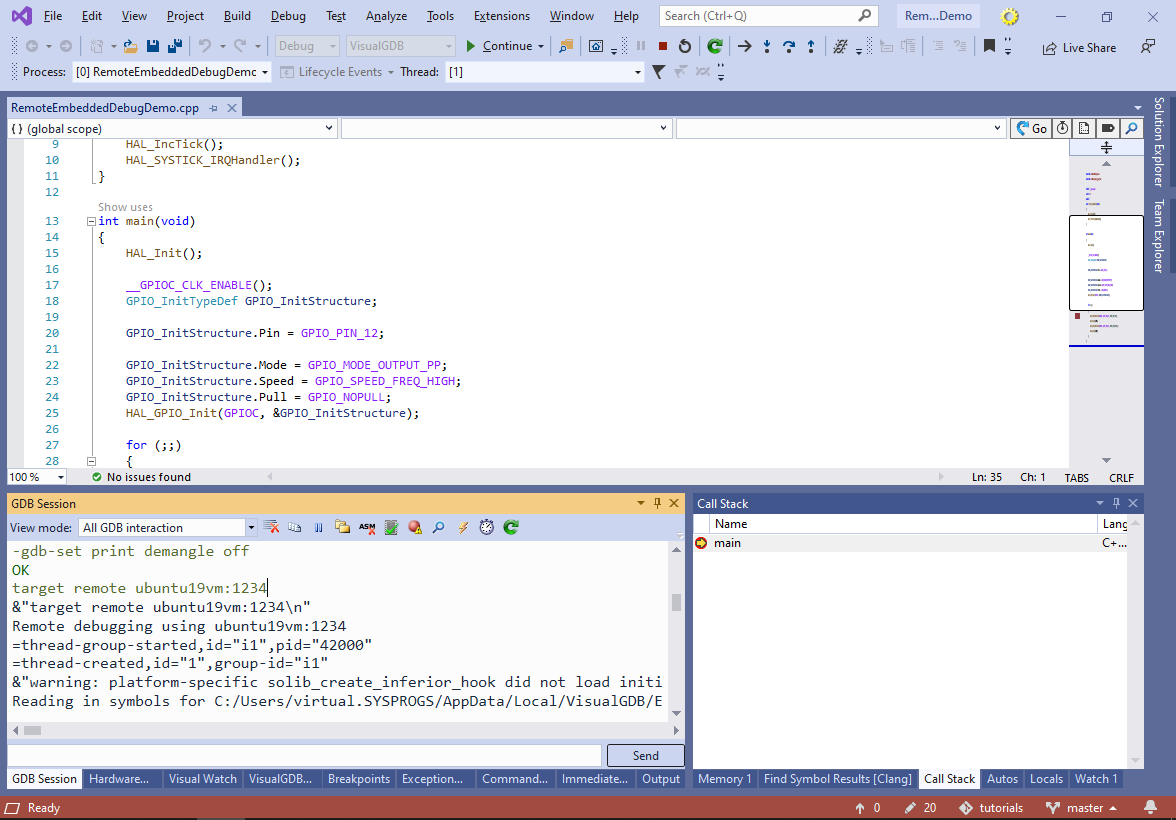
- Start debugging. VisualGDB will now connect to the remote OpenOCD instance and debug session will work as expected:
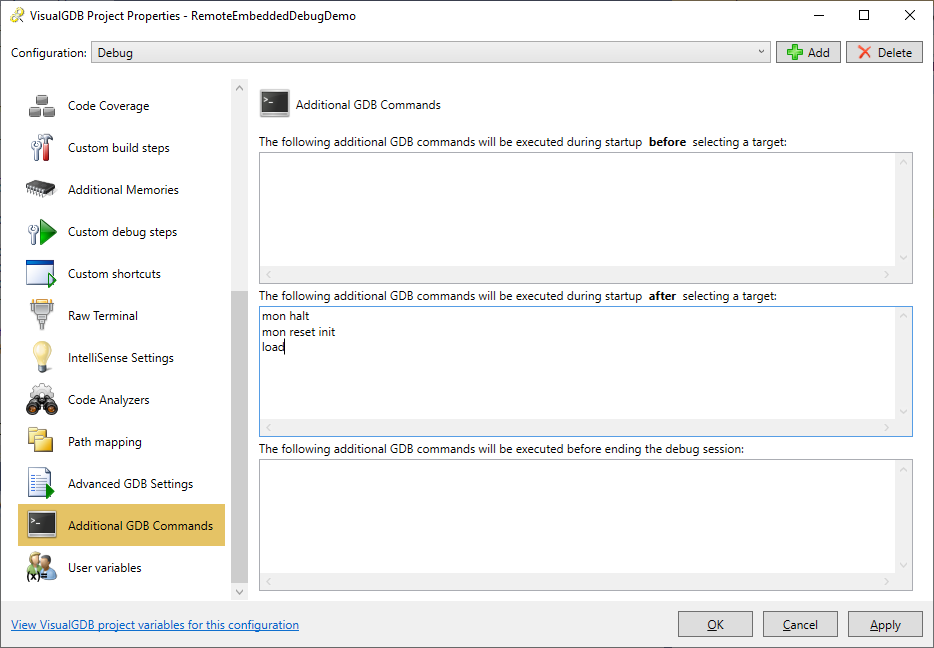
- Note that the previous setup did not include the resetting and FLASH loading commands, so it will only work as long as you haven’t modified your program. In order to program the FLASH memory remotely, add the startup commands from the original OpenOCD settings to VisualGDB Project Properties -> Additional GDB Commands -> After selecting a target:
mon halt
mon reset init
load
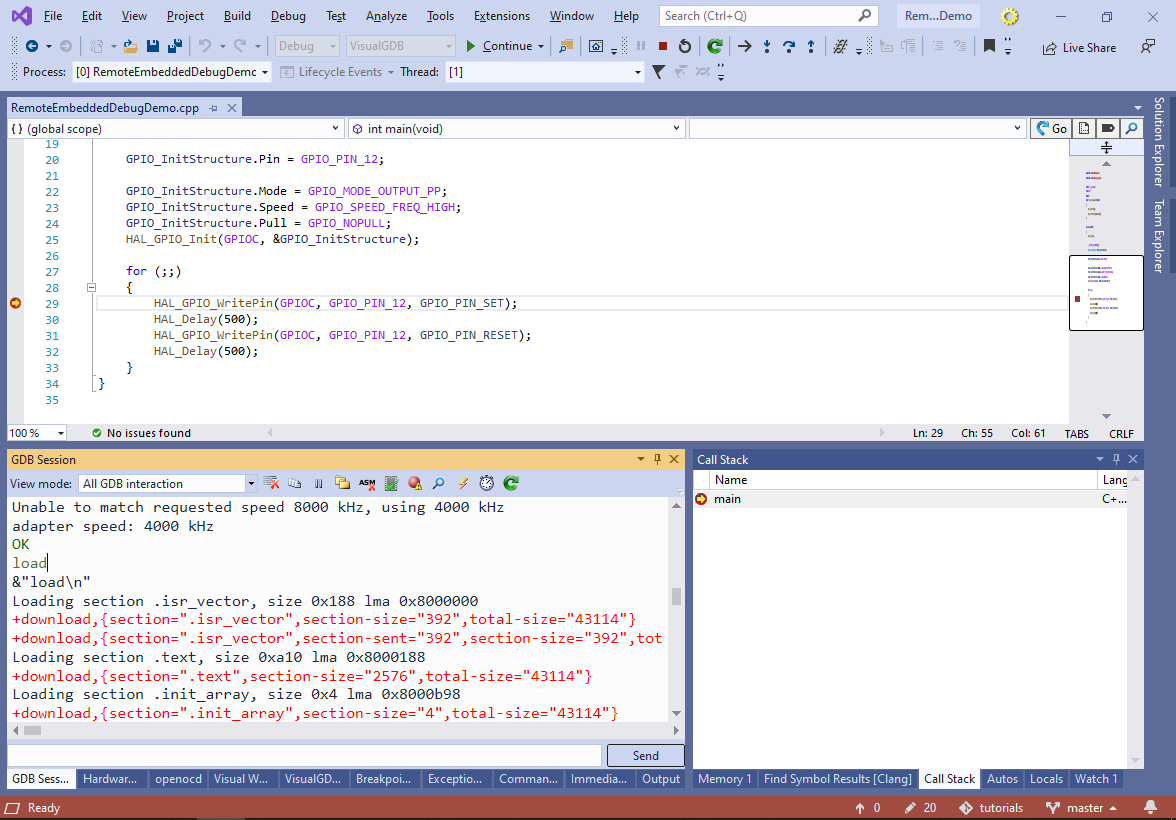
- Now both debugging and FLASH memory programming will work:
 Make sure you keep running the remote OpenOCD instance after the end of the debug session, so you can connect to it again when you debug next time.
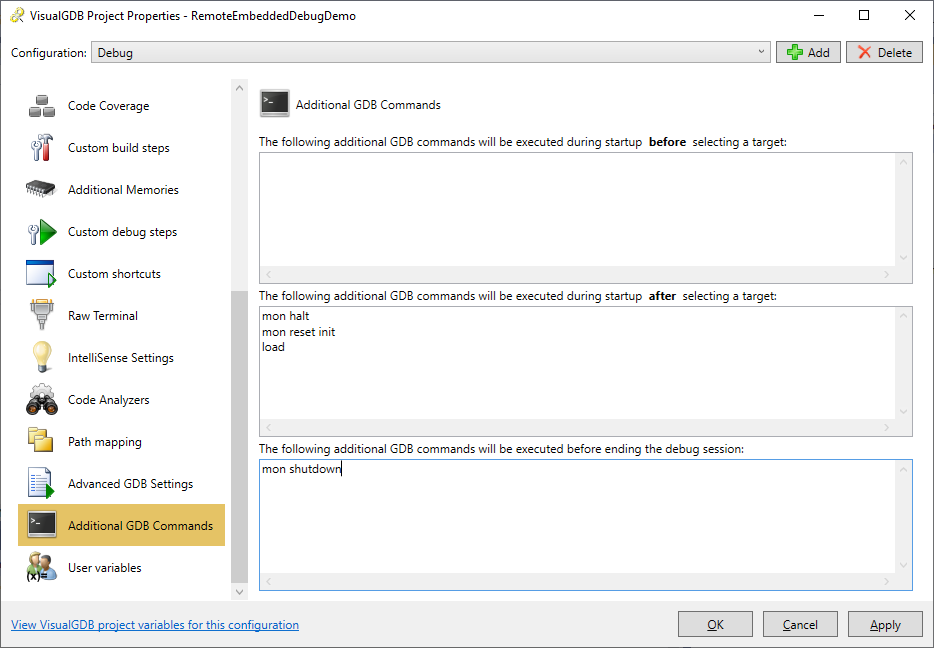
 - If you are using the Custom edition of VisualGDB or higher, you can configure it to automatically launch OpenOCD for you (Linux machines only). First of all, add “mon shutdown” to the session termination commands, as otherwise OpenOCD will keep running after gdb exits:
 Then, go to the Custom Debug Steps page of VisualGDB Project Properties and switch the Remote Console to “Run a specified command“. Select the machine where you have OpenOCD installed and enter the OpenOCD command line there:
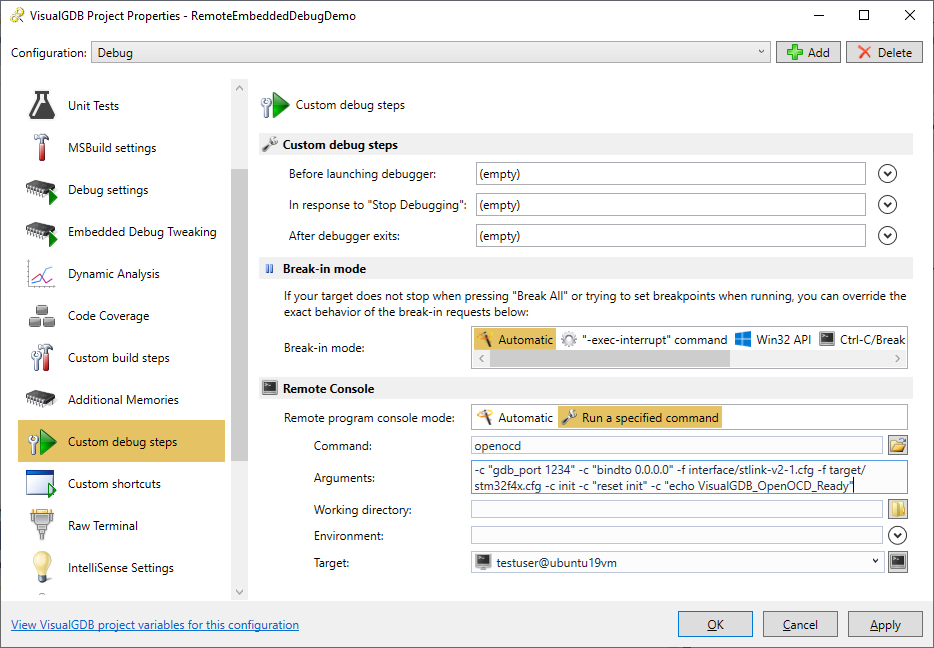
- Now VisualGDB will start and stop remote OpenOCD completely automatically, as if it was running on the same machine as Visual Studio: