Debugging Memory Corruption Errors with Dynamic Stack Checking
This tutorial shows how to use the dynamic stack checking feature of VisualGDB 5.2 to quickly locate code stack overflows before they create hard-to-trace memory corruption errors.
Before you begin, install VisualGDB 5.2 or later.
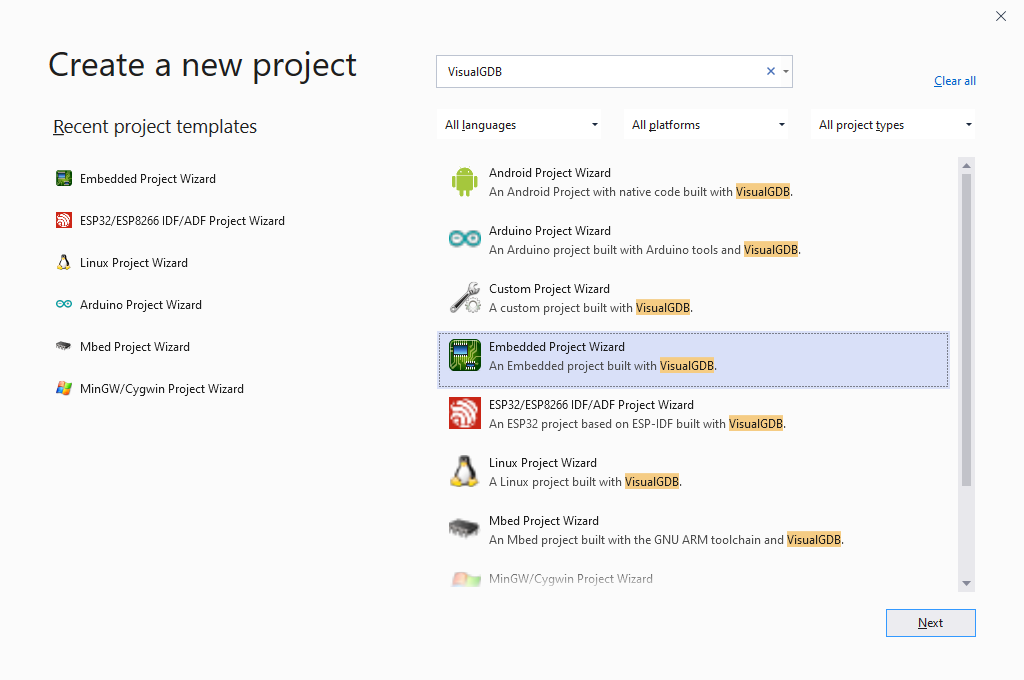
- Start Visual Studio and select the VisualGDB Embedded Project Wizard:
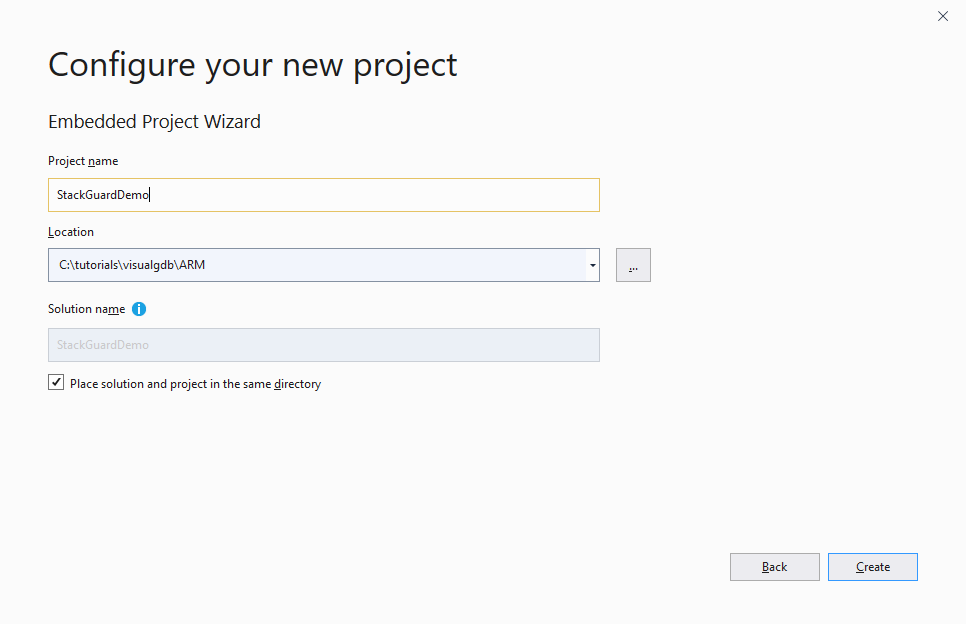
- Choose the name and location for your project:
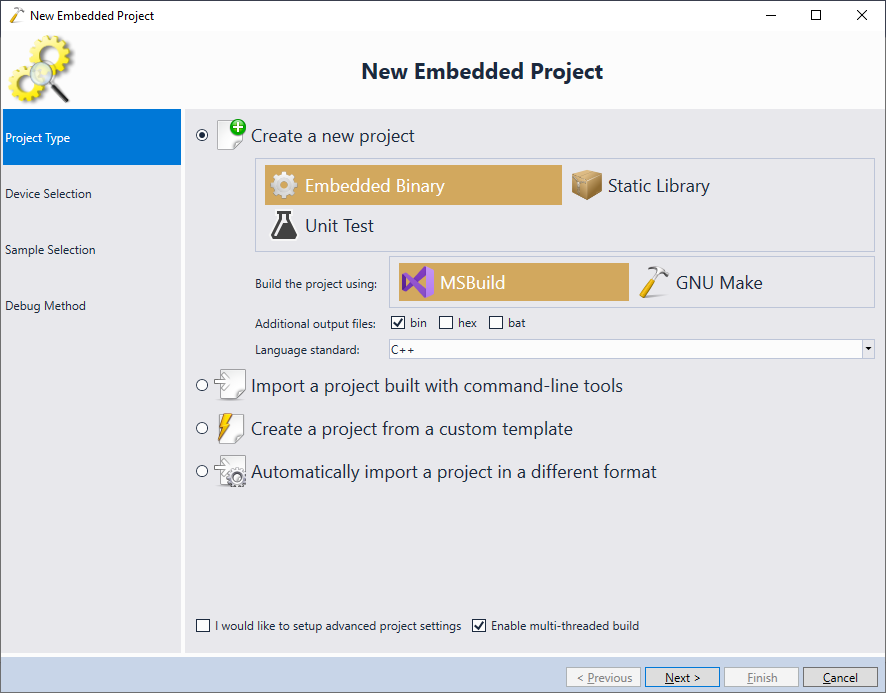
- We will create a normal embedded project, so proceed with the default settings on the first page:
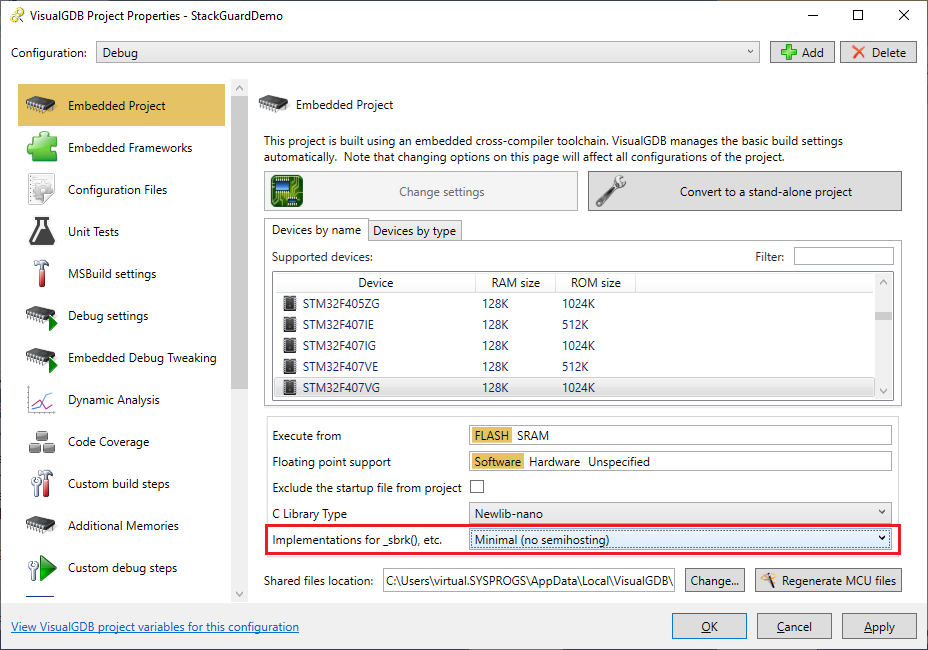
- On the next page select your device. In this tutorial we will use the STM32F4-Discovery board that has the STM32F407VG chip. We will use the newlib’s semihosting functionality to output debug messages to Visual Studio, so set the “implementations for _sbrk(), etc” option to “Support Semihosting“:
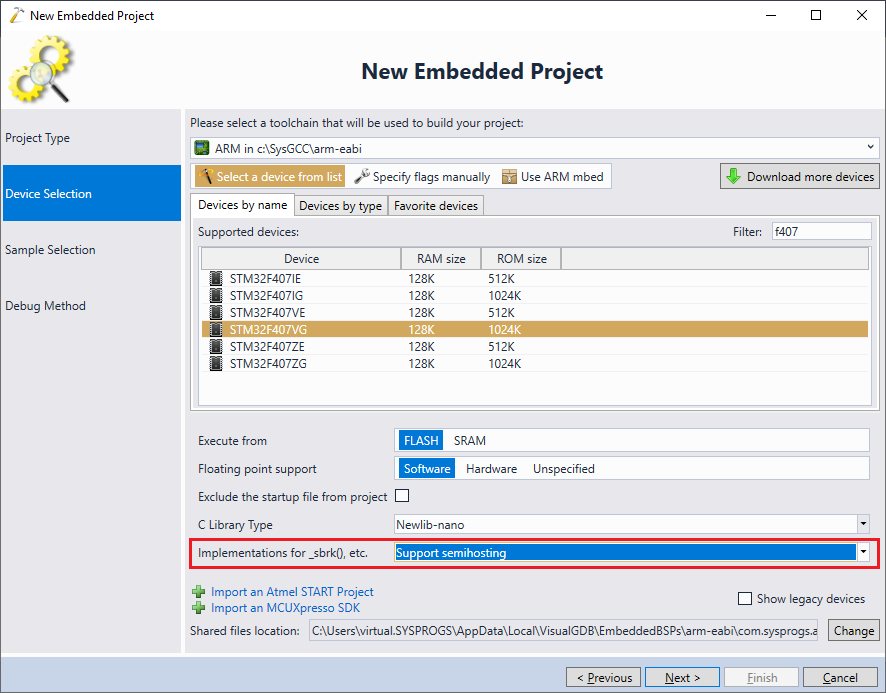 Note that the dynamic stack checking is not specific to STM32 devices and will work with all modern ARM Cortex devices.
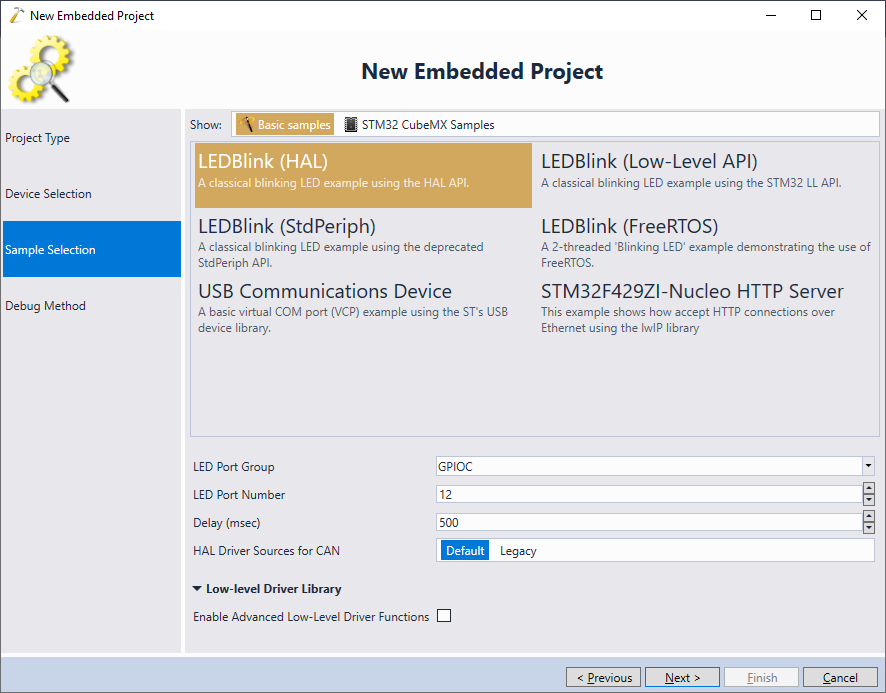
 - On the next page select the basic “LEDBlink” sample and click “Next”:
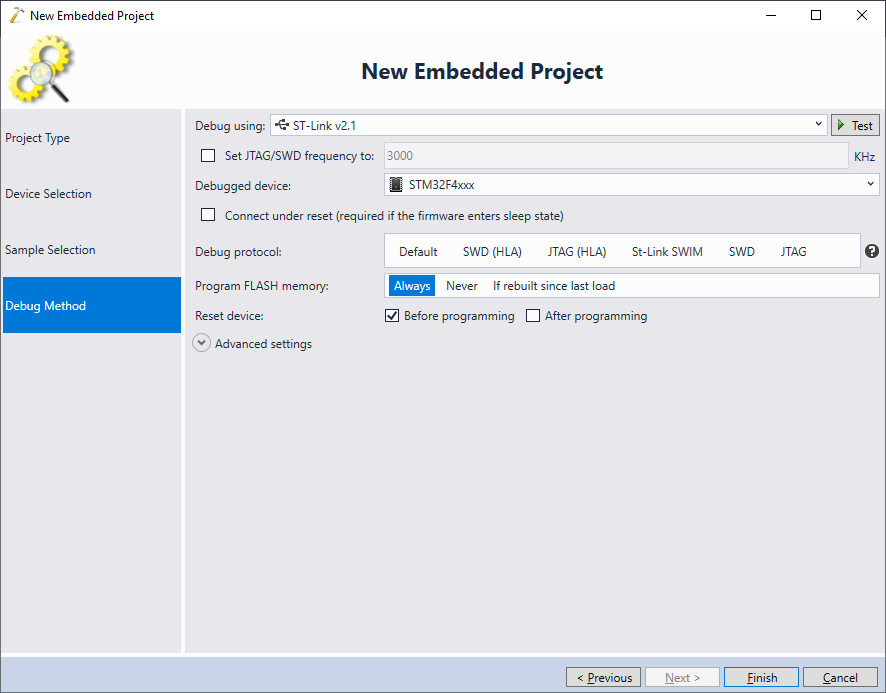
- Finally select your debug method. In most of the cases, VisualGDB will automatically detect the debug parameters, as long as you connect your board to the USB port:
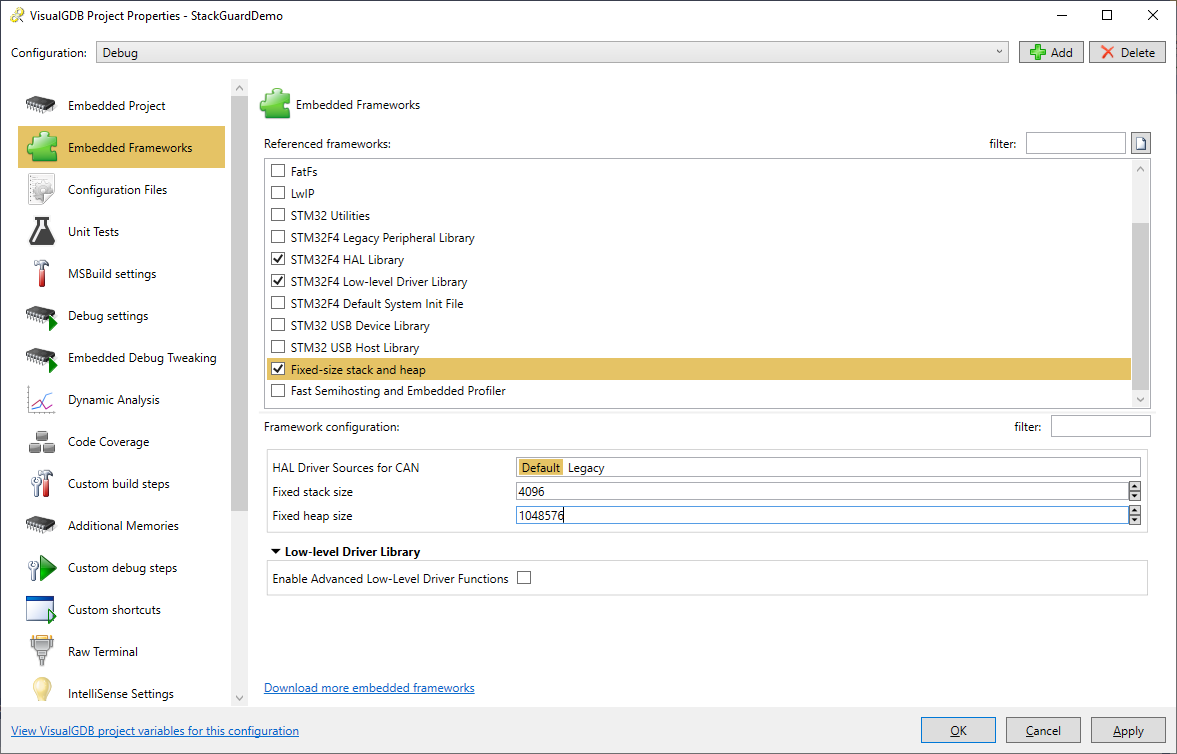
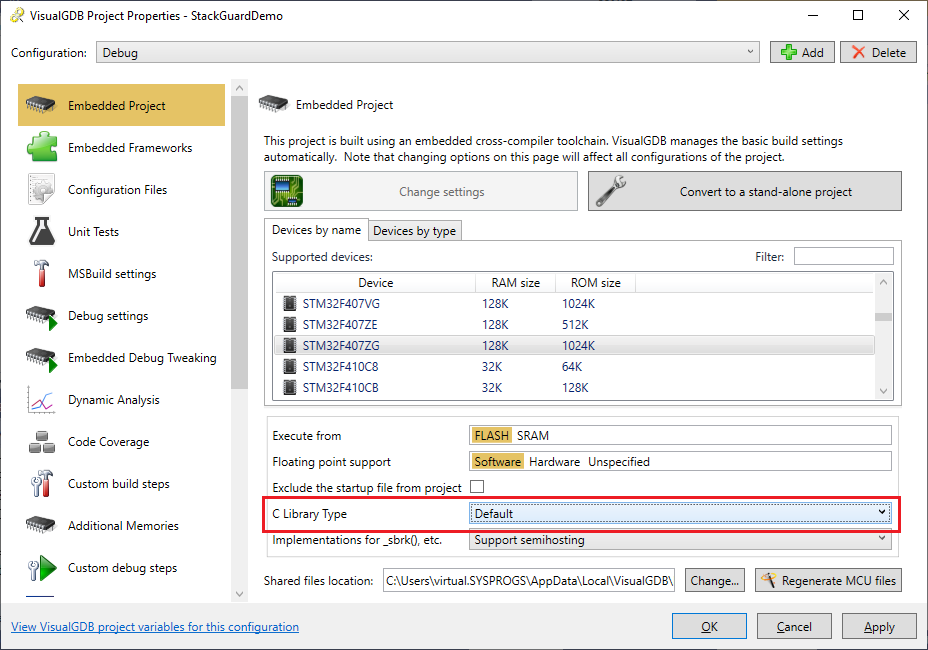
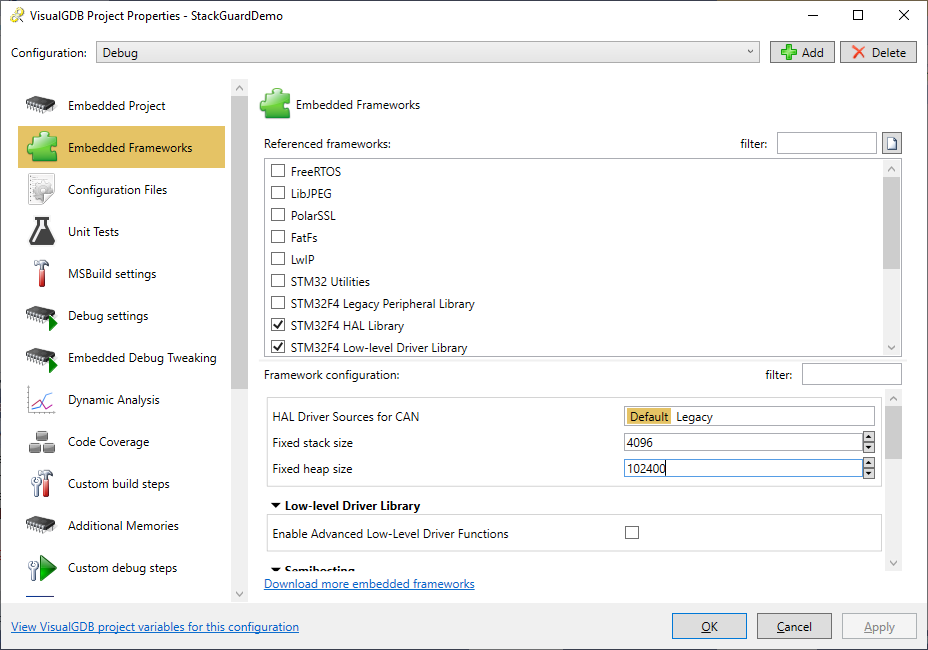
- Press “Finish” to create the project. Then open VisualGDB Project Properties, go to the Embedded Frameworks page and reference the “Fixed stack and heap” framework. Then enter the stack and heap sizes to fill the device RAM almost completely. Pick a large value for the heap that is larger than the device RAM (we will decrease it later):
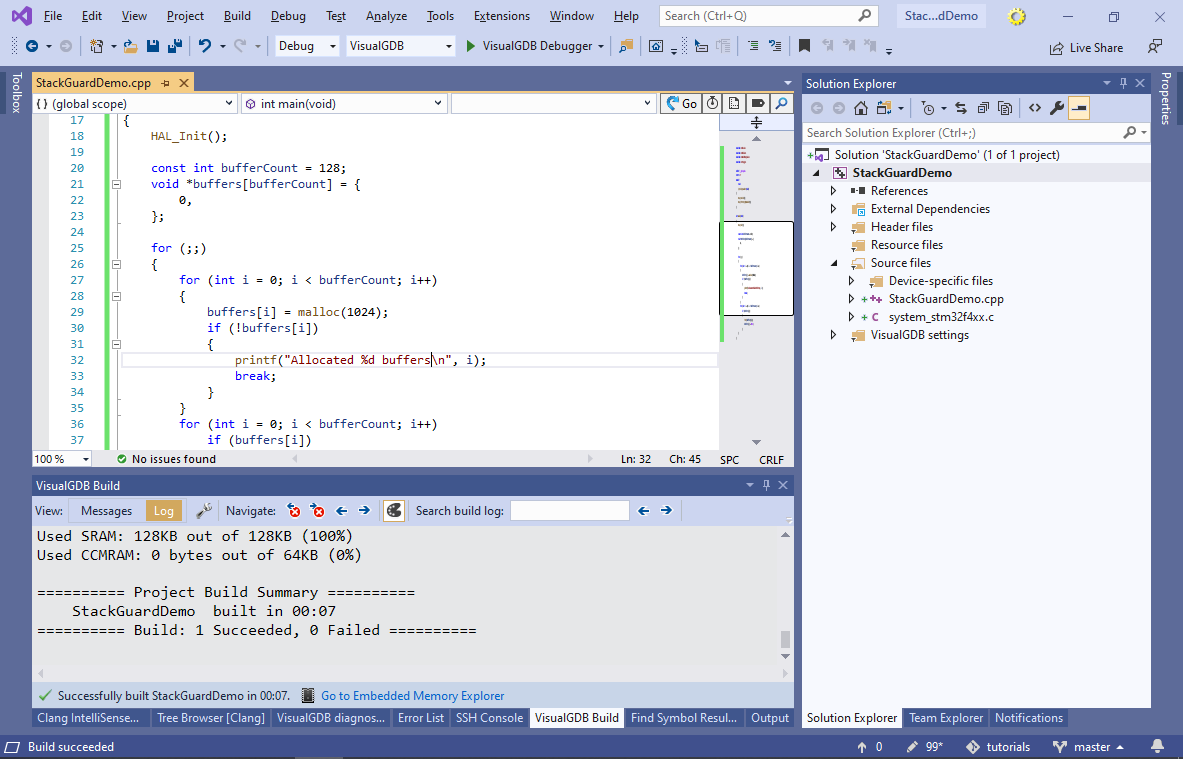
- Replace the contents of the main file with the following code:
#include <stm32f4xx_hal.h>
#include <stdio.h>
#include <stdlib.h>
#include <string.h>

volatile int g_Tick;

extern "C" void SysTick_Handler(void)
{
    HAL_IncTick();
    HAL_SYSTICK_IRQHandler();
    g_Tick++;
}

int main(void)
{
    HAL_Init();

    const int bufferCount = 128;
    void *buffers[bufferCount] = { 0, };
    printf("Starting...\n");
    for (;;)
    {
        for (int i = 0; i < bufferCount; i++)
        {
            buffers[i] = malloc(1024);
            if (!buffers[i])
            {
                printf("Allocated %d buffers\n", i);
                break;
            }
        }
        for (int i = 0; i < bufferCount; i++)
            if (buffers[i])
            {
                free(buffers[i]);
                buffers[i] = NULL;
            }
    }
}
It will repeatedly try to allocate all of the available memory using malloc(), display the amount allocated and then free it.
- Try building the project. The linker will report a memory overflow showing how many extra bytes did not fit:
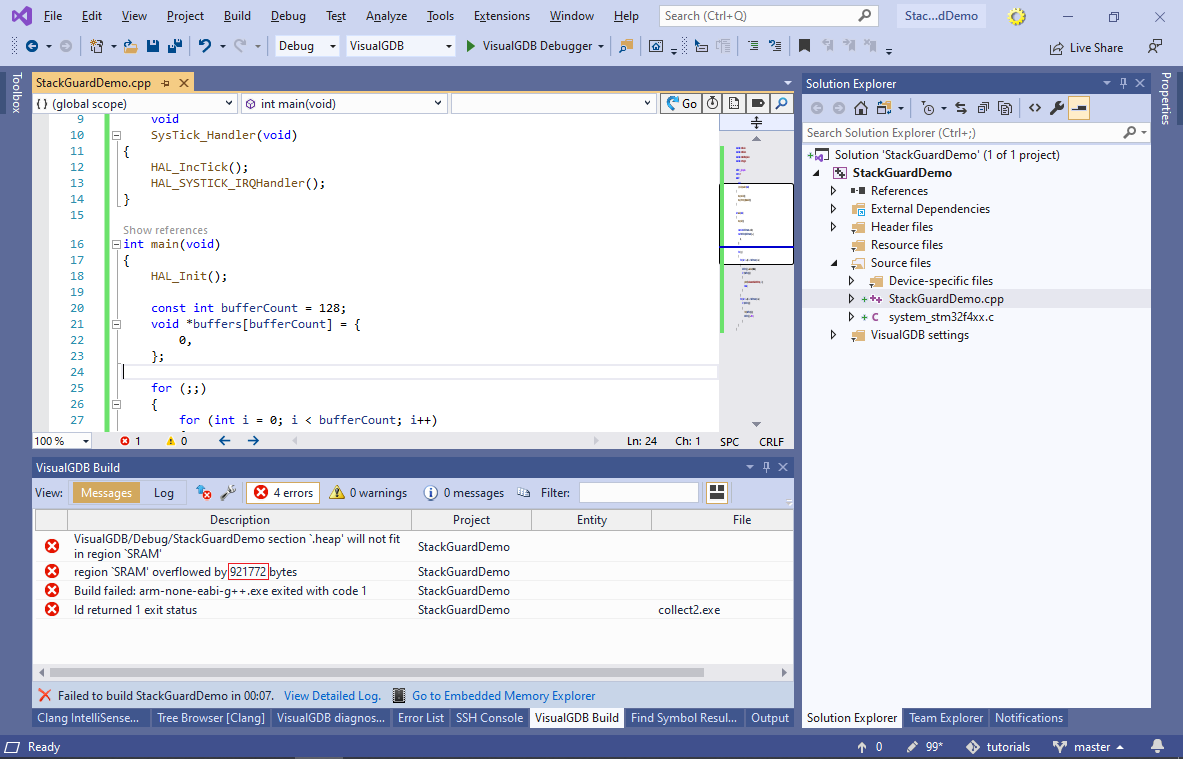
- Reduce the heap size on the Embedded Frameworks page by the value shown in the link error (e.g. 20000-75536=124464) and build the project again:
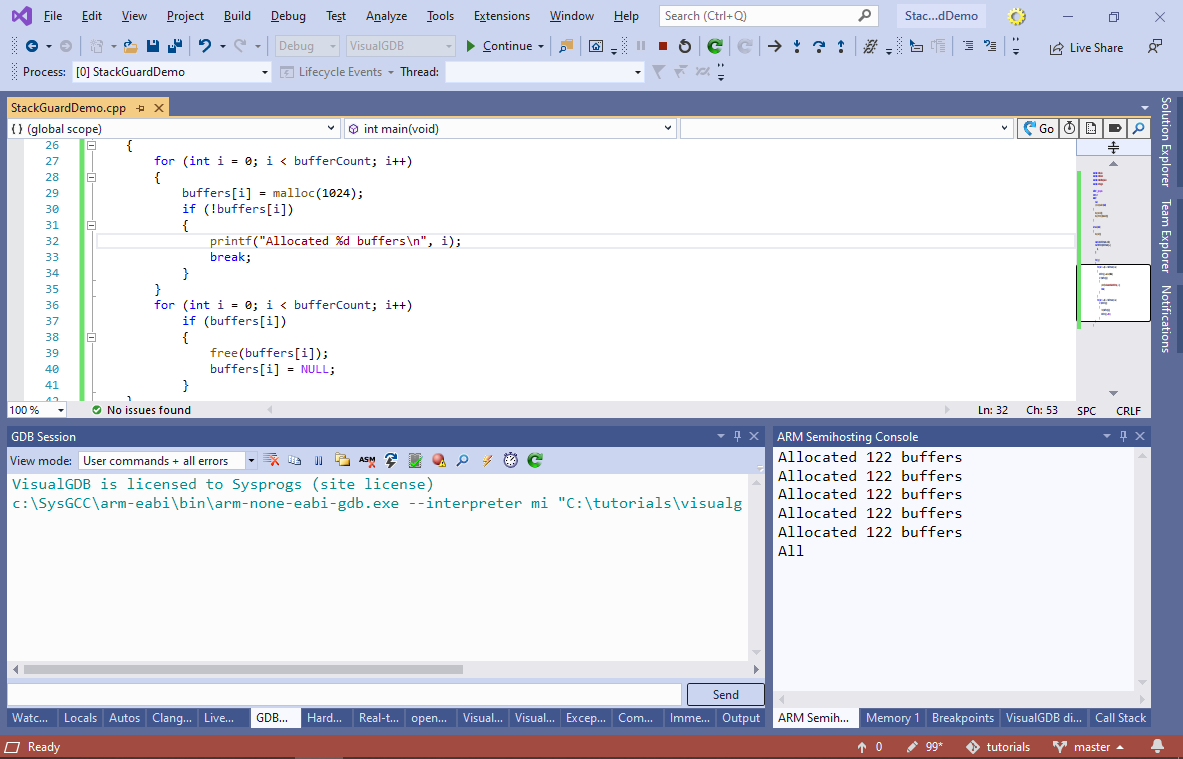
- Now you can run the program and check that the memory is repeatedly allocated without any problems:
- Now we will add code that will corrupt the memory by overrunning the stack. Add 3 functions shown below and call func1() from theSysTick_Handler() on 10-th timer interrupt:
void func3()
{
    char data[2048];
    memset(data, 0xA5, sizeof(data));
}

void func2()
{
    char data[2048];
    memset(data, 0xAA, sizeof(data));
    func3();
}

void func1()
{
    char data[2048];
    memset(data, 0x55, sizeof(data));
    func2();
}

volatile int g_Tick;
extern "C" void SysTick_Handler(void)
{
    HAL_IncTick();
    HAL_SYSTICK_IRQHandler();
    if (!(g_Tick++ % 10))
        func1();
}
Each of the 3 functions will try to use 2KB of memory, quickly adding up to more than the 4KB stack size selected in VisualGDB Project Properties.
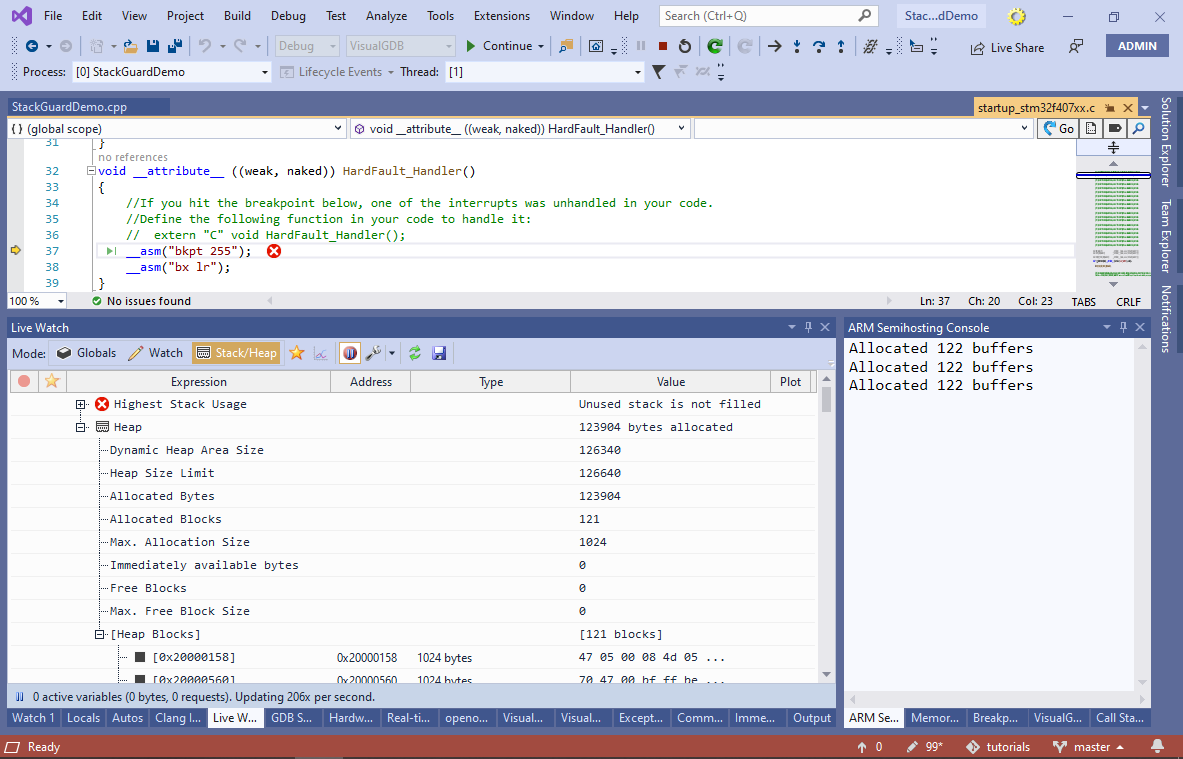
- Run the project now. You will see how the output quickly stops and if you press the ‘break all’ button, you will see that the program is stuck at the hard fault handler caused by the free() function. If you are using VisualGDB 5.5 or later, open the Debug->Live Watch window to observe the state of the heap in real time (only works with newlib-nano):
- If the error does not trigger for a long time, try switching to the regular libc instead of newlib-nano:
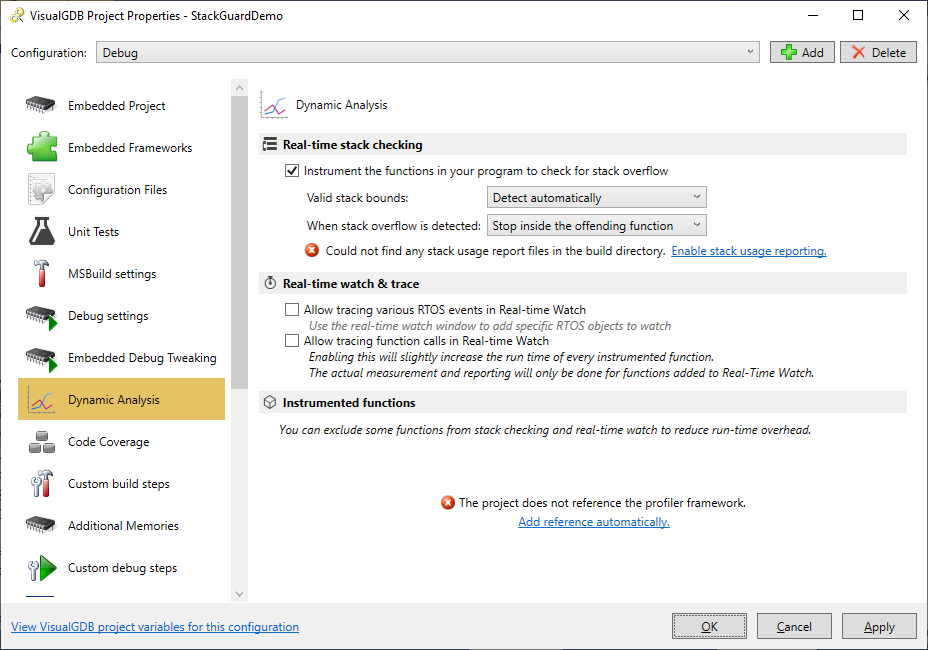
- If this was a real project and we did not know what is corrupting the stack, it could take several hours to pinpoint it using the regular means. The new Dynamic Stack Analysis introduced in VisualGDB 5.2 makes it much easier by inserting stack bounds checking code in each of your functions. Open VisualGDB Project Properties and go to the Dynamic Analysis page (requires Custom edition or higher). Enable the “Instrument the functions in your program to check for stack overflow” checkbox:
- Then click “Enable stack usage reporting” and “Add reference automatically” to adjust the necessary project properties and build your project. Most likely you would need to reduce the heap size again to fit the fast semihosting buffer used by the profiler framework:
- Disable the regular semihosting to avoid conflicts between it and the Fast Semihosting:
- If you run your project now, VisualGDB will immediately detect the stack overflow and will show a detailed report:
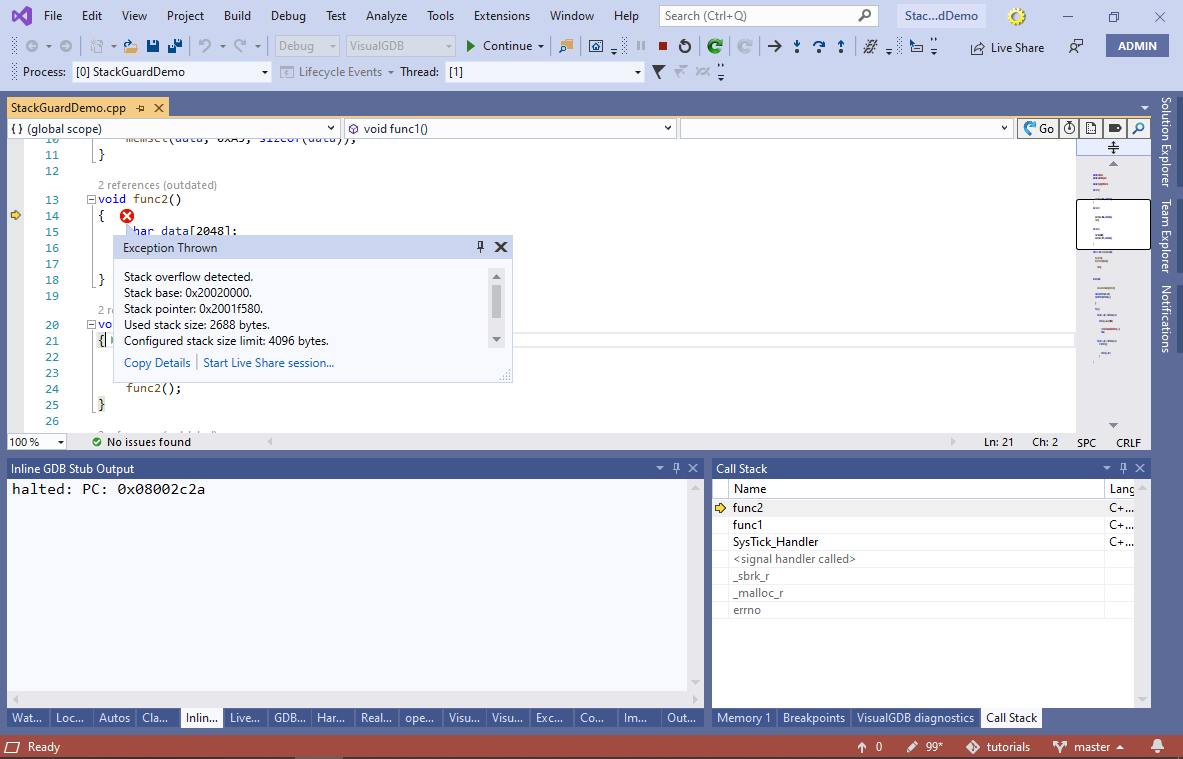 Examine the call stack window to see when the overflow happened. In this example it happens when a timer interrupt happens while the malloc() function is running.
 - Dynamic checking has a side effect of slowing down your program. If you open the Disassembly view, you will notice that all function calls were replaced with calls to special profiler stubs:

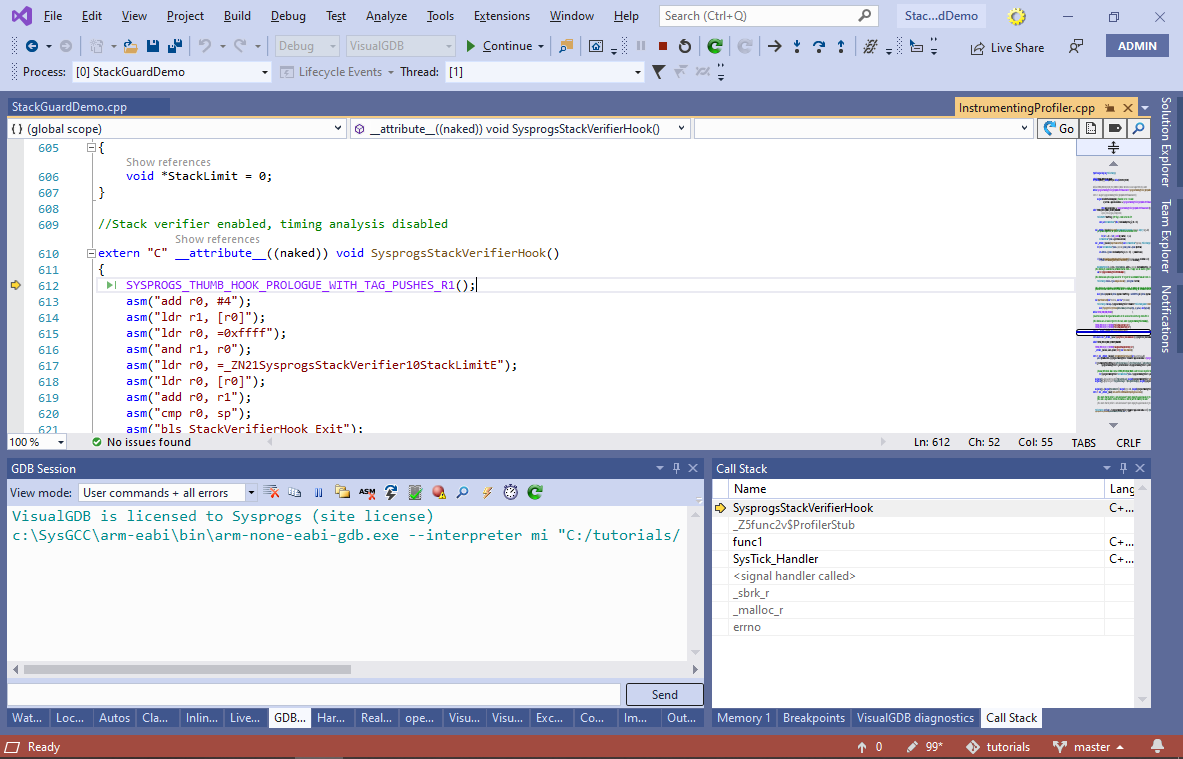
- Each stub invokes the SysprogsStackVerifierHook() function that does the actual stack checking:
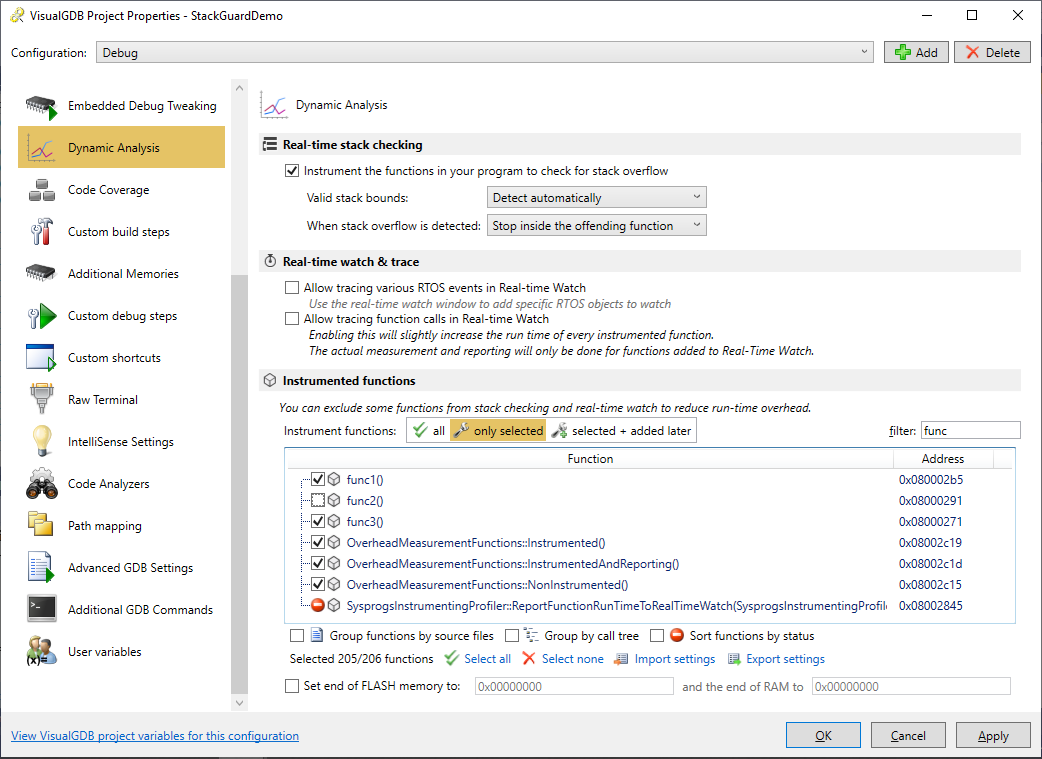
- You can exclude some of the functions from stack checks via the Dynamic Analysis page of VisualGDB Project Properties. E.g. we can exclude the offending func2() function to see how this affects the analysis:
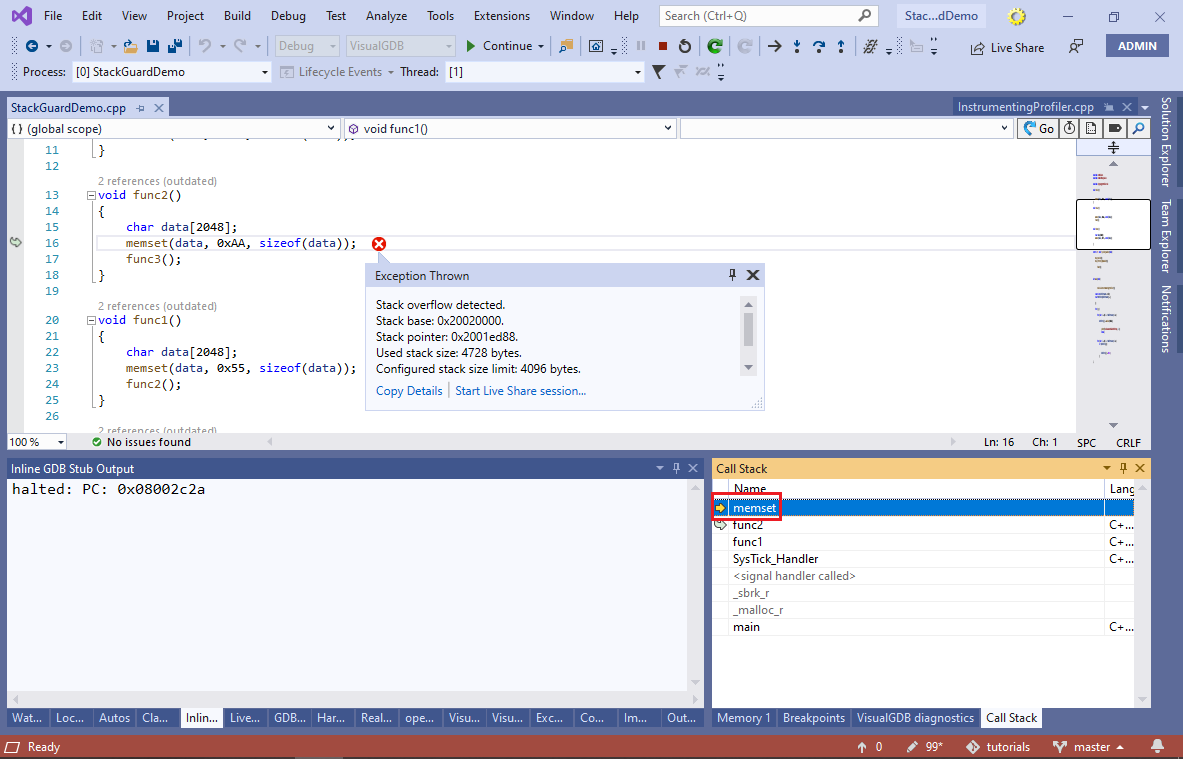
- If you run your program now, the overflow won’t be detected upon entry to func2(), but will still be caught when memset() is called:
 When you are done analyzing your project, you don’t need to rebuild it again. Simply disable the stack checking on the Dynamic Analysis page of VisualGDB Project Properties and VisualGDB will not instrument your functions until you enable this feature again. The profiler framework will be compiled in, but won’t be activated unless you explicitly start profiling or enable analysis again.
You can find the source code shown in this tutorial in our GitHub repository.