Developing TMS570 Projects with Visual Studio
This tutorial shows how to create, build and debug a basic project for the TMS570LS1224 microcontroller using Visual Studio and VisualGDB. Before you begin, follow this tutorial to generate an SDK using TI HALCoGen and convert it into VisualGDB and install the latest ARM toolchain and the OpenOCD package.
WARNING: The TMS570LS1224 device shown in this tutorial is a Big-Endian device and requires an ARM toolchain with prebuilt Big Endian libraries. As of July 2020, the only toolchain build compatible with TMS570LS1224 is gcc-9.3.1-r2.
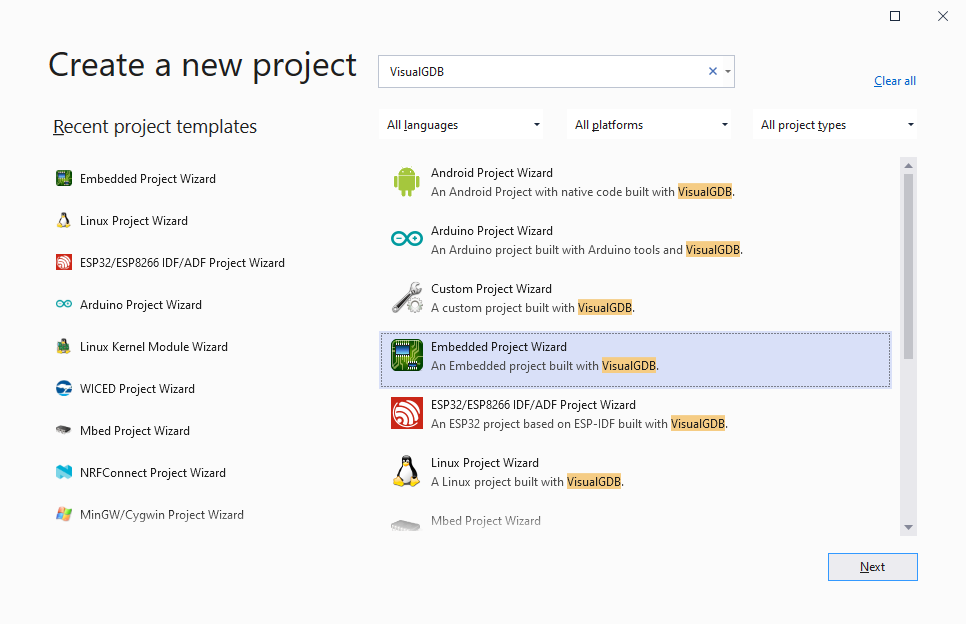
- Start Visual Studio and locate the VisualGDB Embedded Project Wizard:
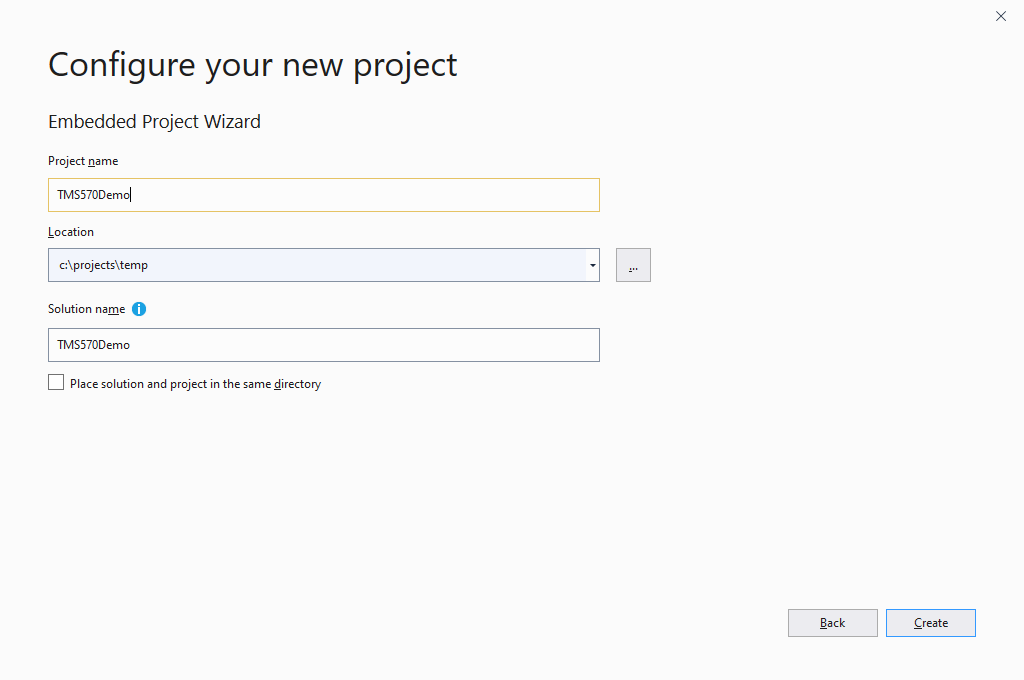
- Pick the name and location of your project:
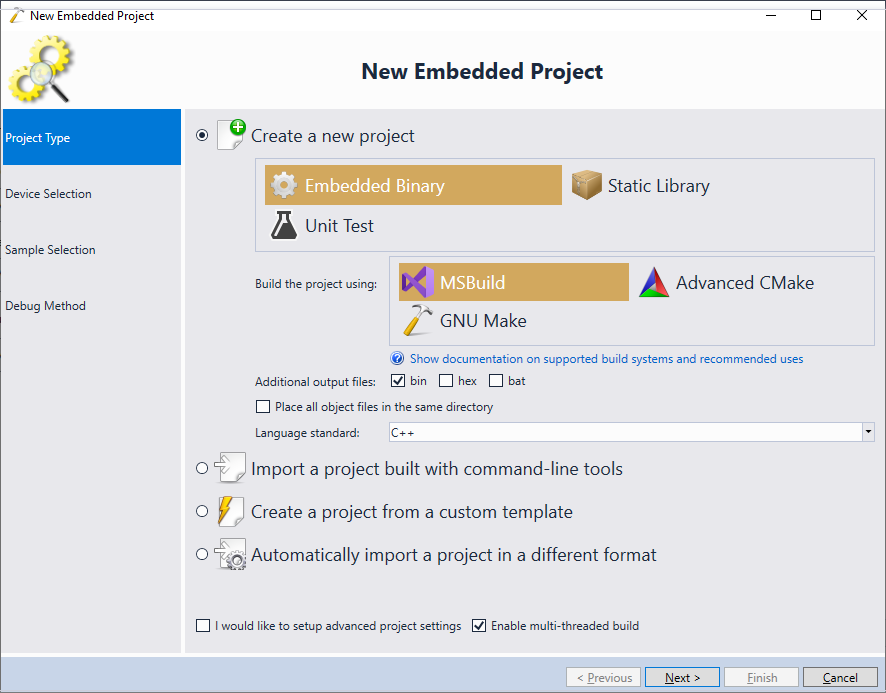
- Press “Create” to launch the VisualGDB-specific part of the wizard. Proceed with the default “New -> Embedded Binary -> MSBuild” settings:
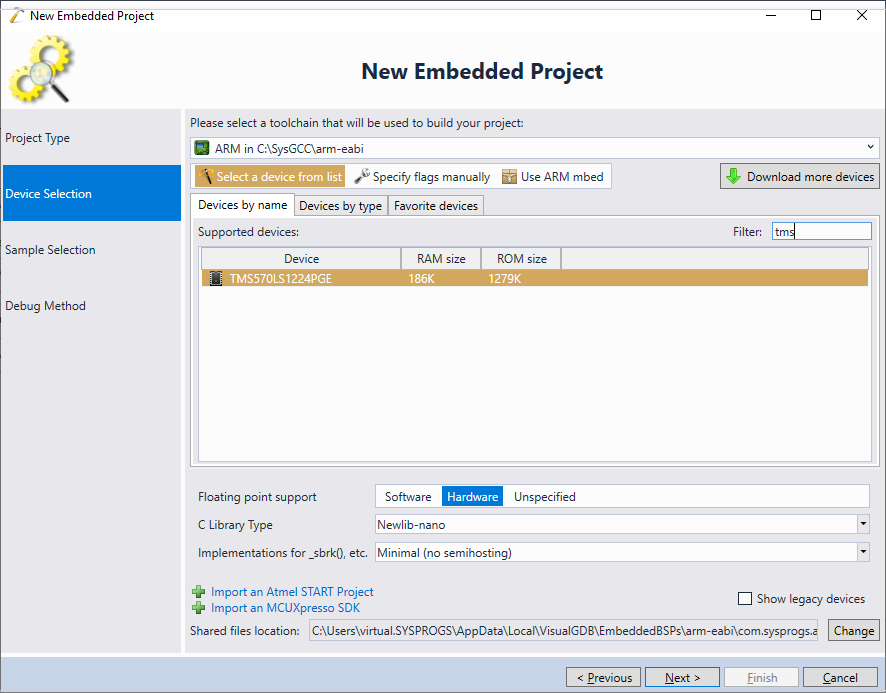
- On the next page select the TMS570LS1224PGE device. If it doesn’t appear, make sure you have generated an SDK with HALCoGen and imported it into VisualGDB per this tutorial:
- On the next page select a sample project you would like to use. In this tutorial we will demonstrate the FreeRTOS-based sample, so select it from the list. You can specify the port/pin of any on-board LED at the bottom of the page, or simply proceed with the default settings:

- Connect your board to the USB port. VisualGDB will automatically detect the XDS110 interface on the LAUNCHXL2-TMS57012 board and will locate the OpenOCD device script. Make sure you explicitly select the JTAG interface:

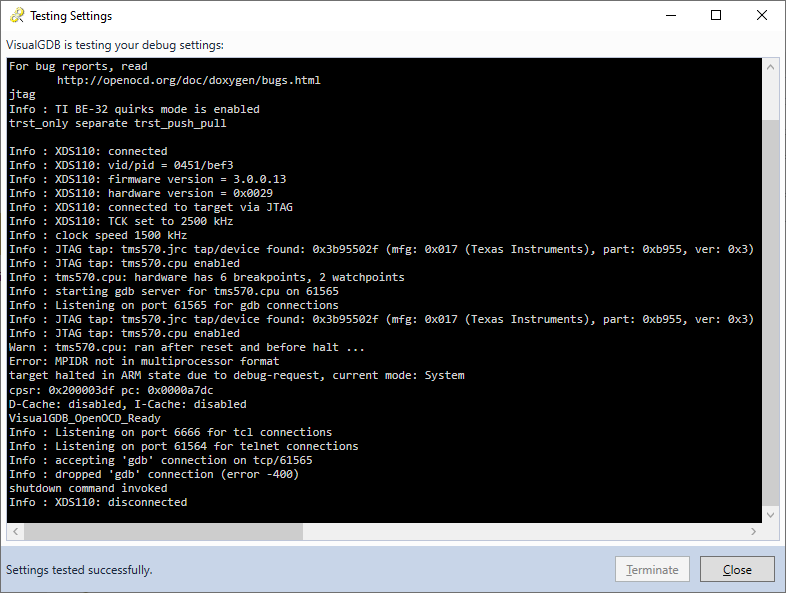
- Press the Test button to verify the debugger connection:
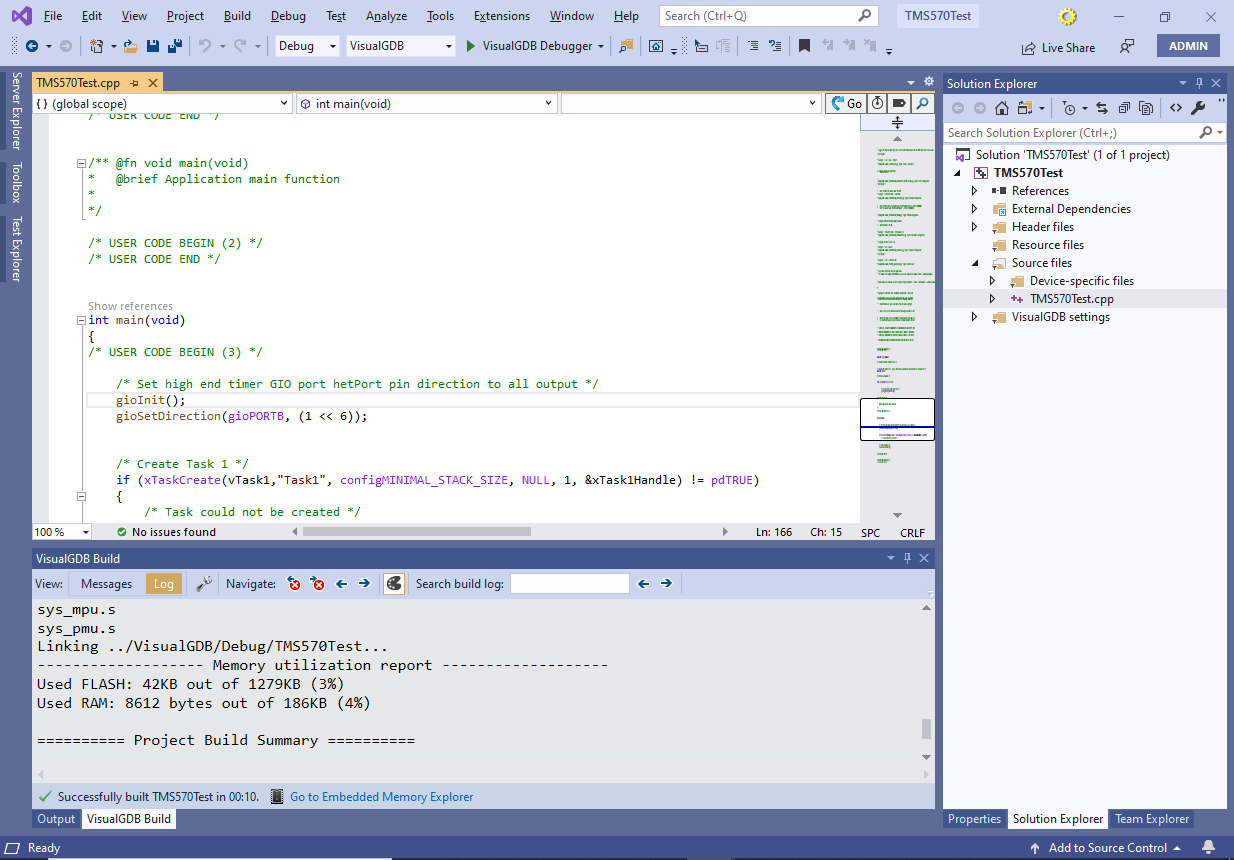
- Press “Finish” to generate the project. Build it by pressing Ctrl-Shift-B:
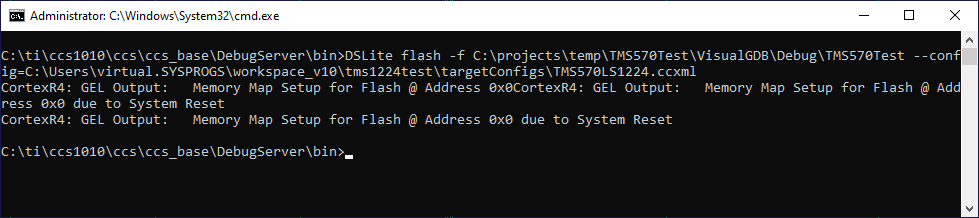
- OpenOCD does not support programming the TMS570 FLASH memory, so we will need to use the TI FLASH memory programming tool instead. Locate the DSLite executable in the CodeComposer directory and run it with the following arguments:
DSLite flash -f <full path to the ELF file> --config=<full path to the config file>
A config file is automatically created by CodeComposer together with a new project. See the last steps of this tutorial for details.
- Once the memory is programmed, the on-board LED will begin blinking:

- Now we will show how to debug the board. Go to Visual Studio and press F5 to begin debugging. VisualGDB may warn that the stack location is not writable:
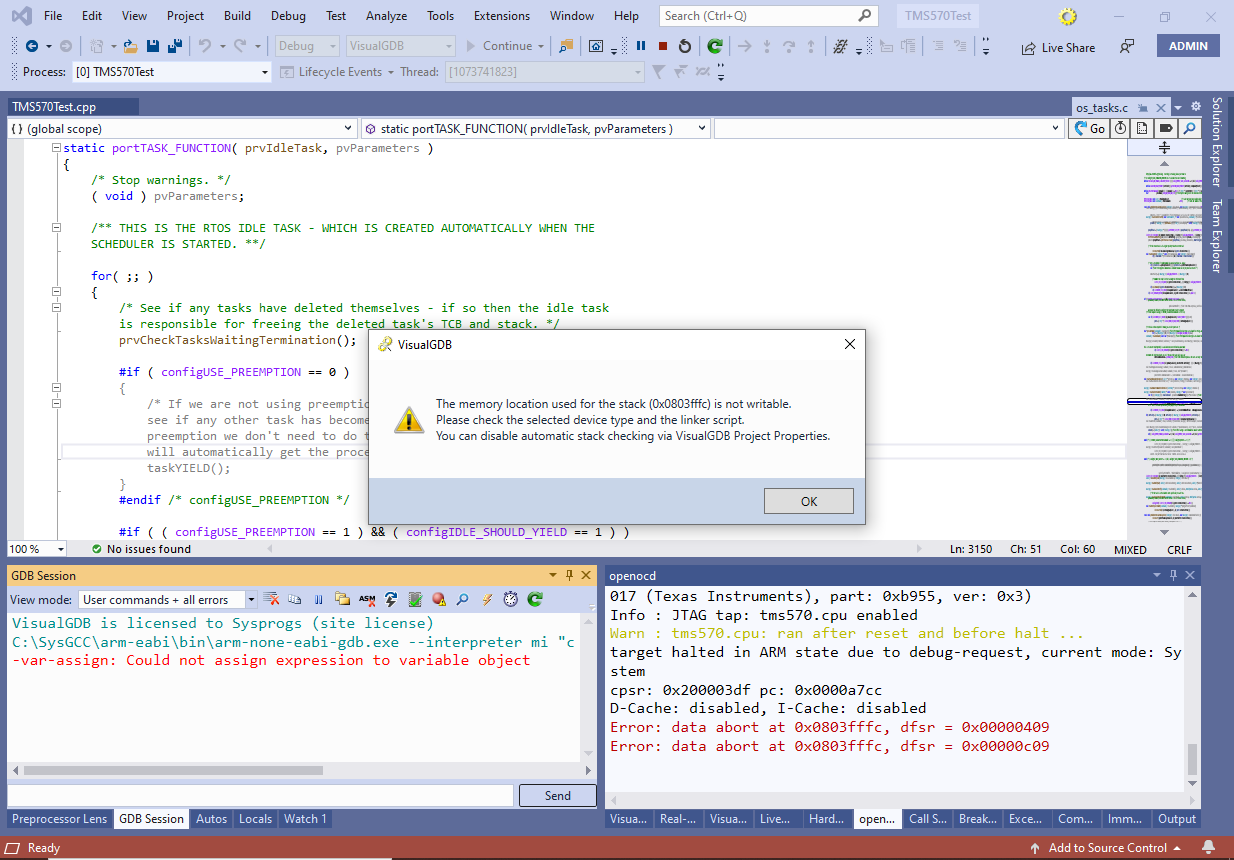
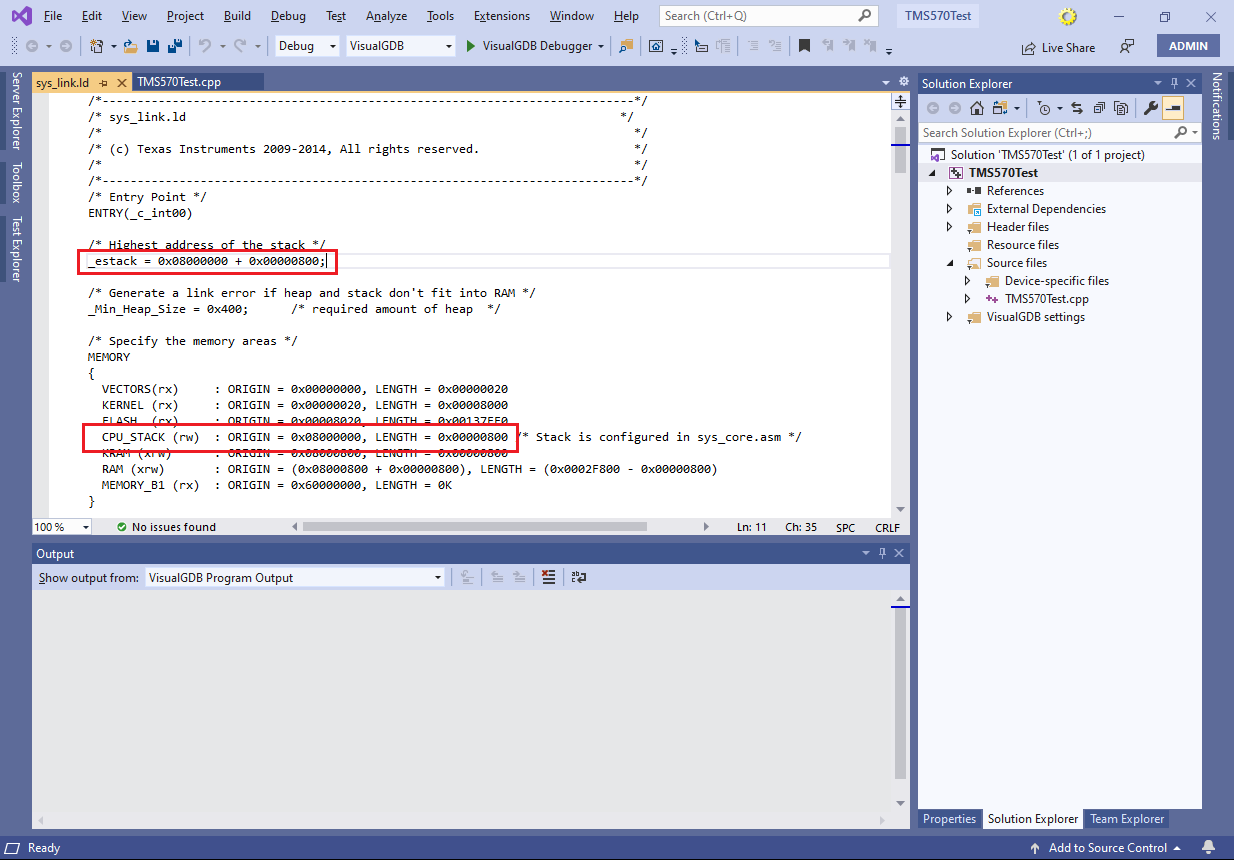
- This happens because the _estack symbol generated by HALCoGen does not point to the actual end of stack. To fix this, locate the linker script in the BSP directory:

- Then edit the _estack symbol to point at the end of the CPU_STACK region:
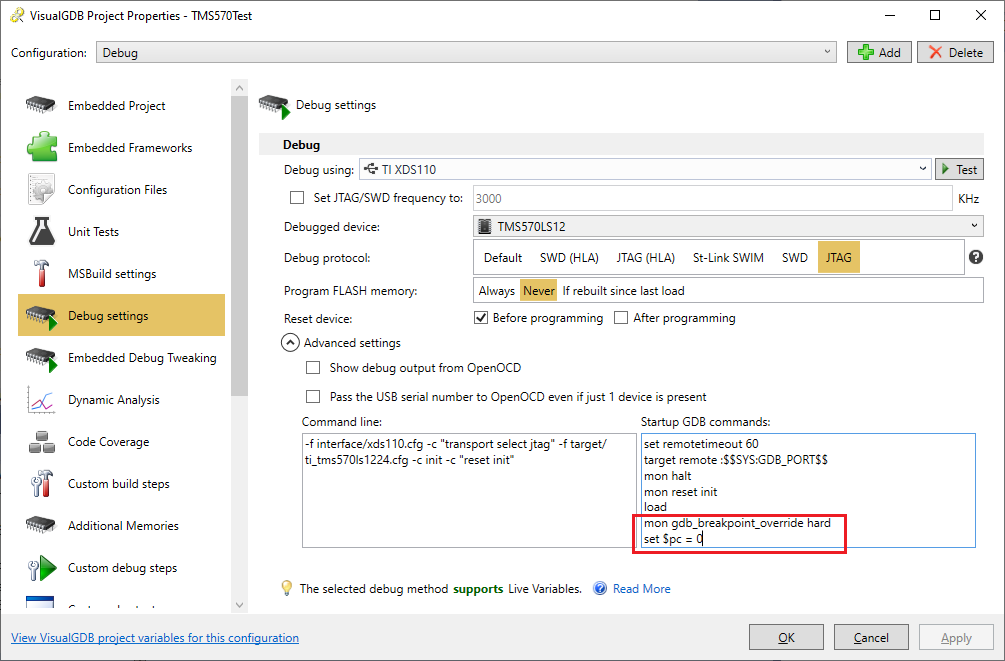
- To make sure you can set breakpoints in the FLASH memory and debug the program from the very beginning, add the following lines to the Startup GDB Commands field in Debug Settings:
mon gdb_breakpoint_override hard
set $pc = 0
The first command forces all breakpoints to be hardware breakpoints, and the second one forcibly jumps to the reset vector at the beginning of the debug session:
- Now you will be able to debug the program as usual:

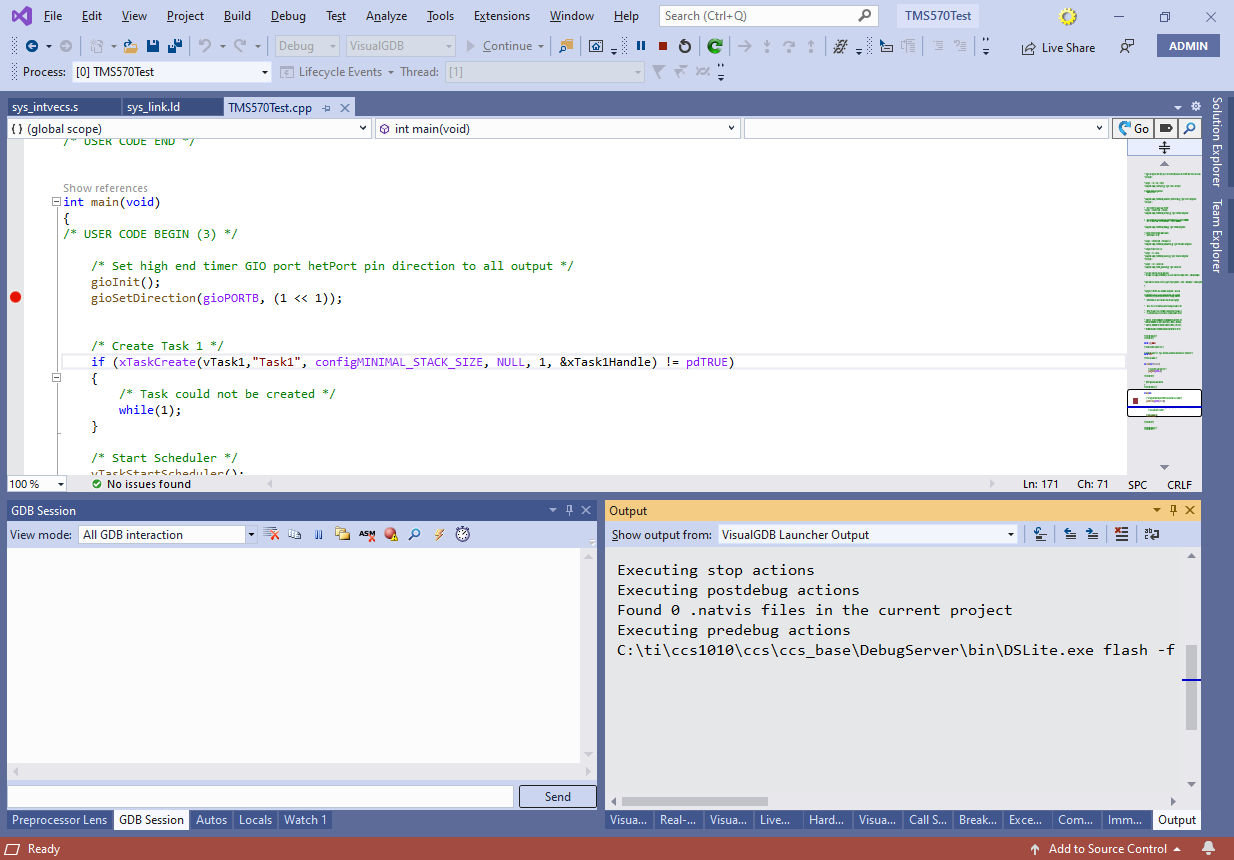
- You can automate FLASH memory programming with DSLite by adding it as a custom pre-debug action:
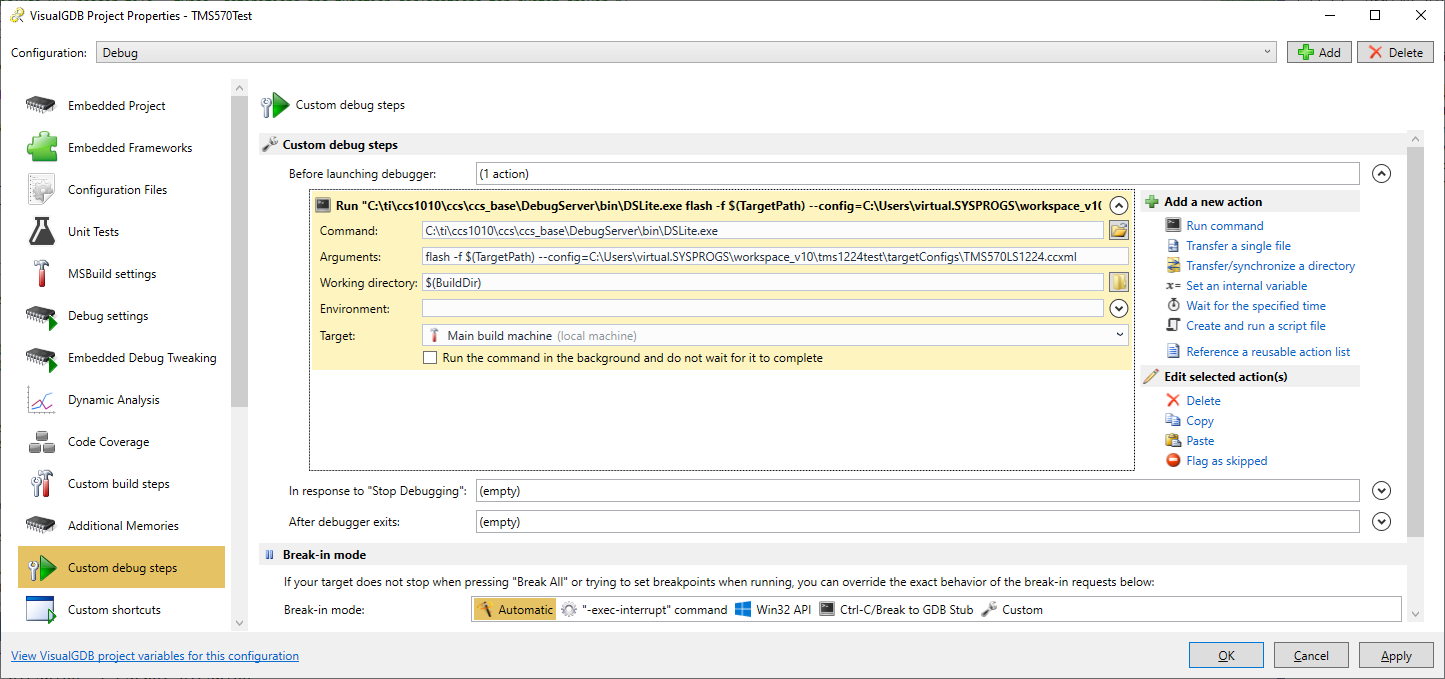
- VisualGDB will then automatically launch it before the debug session. You can find the output from it in View->Output->VisualGDB Launcher Output: