Debugging the ESP32-C3 Device with JTAG
This tutorial shows to to create a basic project for the RISC-V-based ESP32-C3 device and how to debug it with JTAG. We will show all the necessary wiring on the ESP32-C3-DevKitM board, as well as the steps required to configure the software.
The ESP32-C3 chip includes its own on-chip USB-to-JTAG engine, so it can be debugged by connecting a secondary USB cable to the special debug USB pins (Option A). Alternatively, it can also be debugged using an external JTAG probe (Option B), however it requires additional setup described here.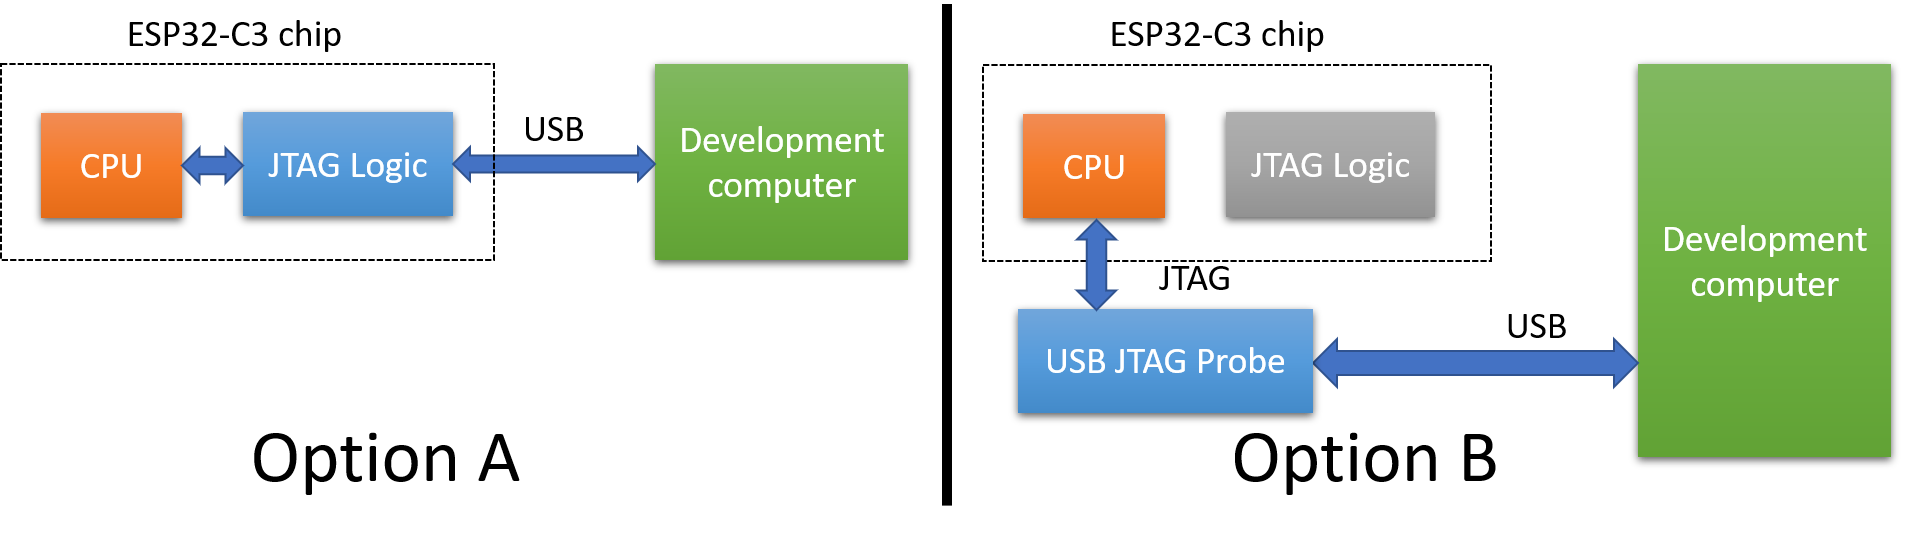 In order to debug ESP32-C3 using the built-in JTAG engine, you need to use a secondary USB cable and connect it to the following pins on the board:
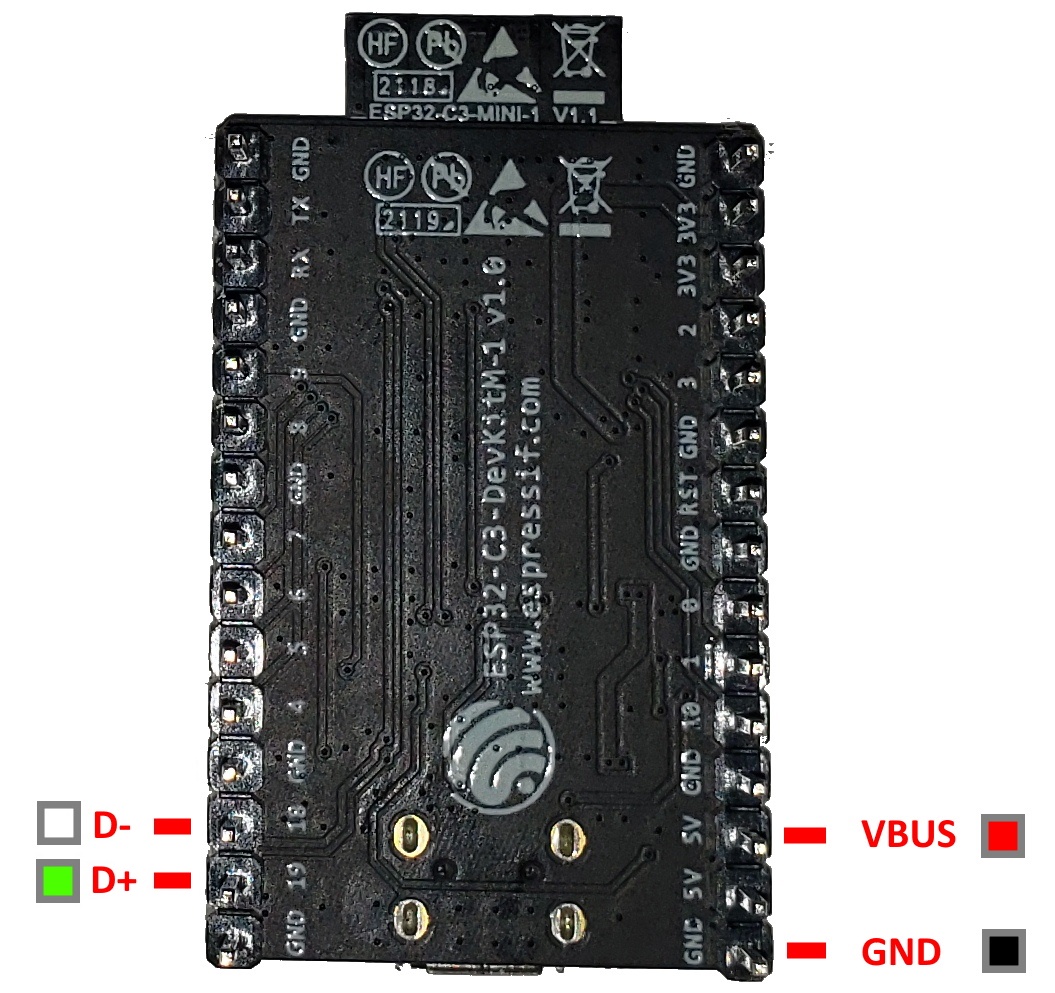
| USB Signal | Typical wire color | ESP32-C3 Signal Name | ESP32-C3-DevKitM Pin |
| D- | White | GPIO18 | J3.13 |
| D+ | Green | GPIO19 | J3.14 |
| V_BUS | Red | 5V | J1.13 or J1.14 |
| GND | Black | GND | J1.15 |
 The fully assembled setup will look like this:
 Note that since the secondary USB connection also supplies power to the board, you do not need to connect another cable to the primary USB connector.
If you wanted to use an external USB-to-JTAG probe, you would need to connect the following signals according to the Espressif documentation:
| JTAG signal | JTAG20 pin | ESP32-C3 signal | ESP32-C3-DevKitM Pin |
| TMS | 7 | IO4 | J3.11 |
| TDI | 5 | IO5 | J3.10 |
| TCK | 9 | IO6 | J3.9 |
| TDO | 13 | IO7 | J3.8 |
| GND | 4 | GND | J3.1 |
You would also need to do additional setup as shown in this thread. For easier setup, we advise using the built-in JTAG controller instead.
Once you got all the wiring set up, follow the steps below to create a basic project and debug it:
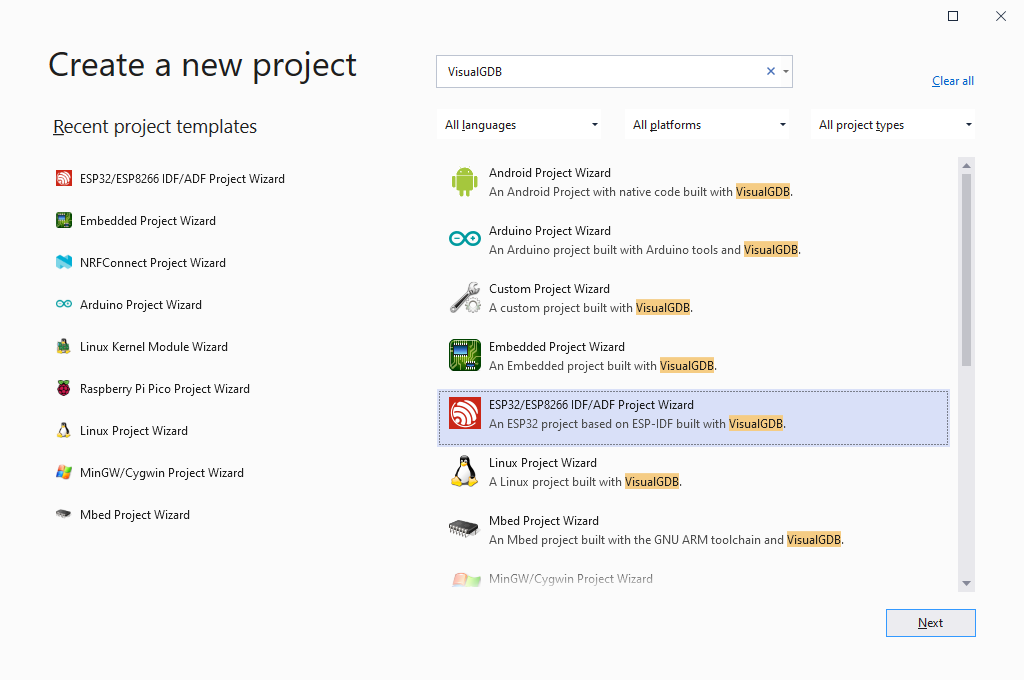
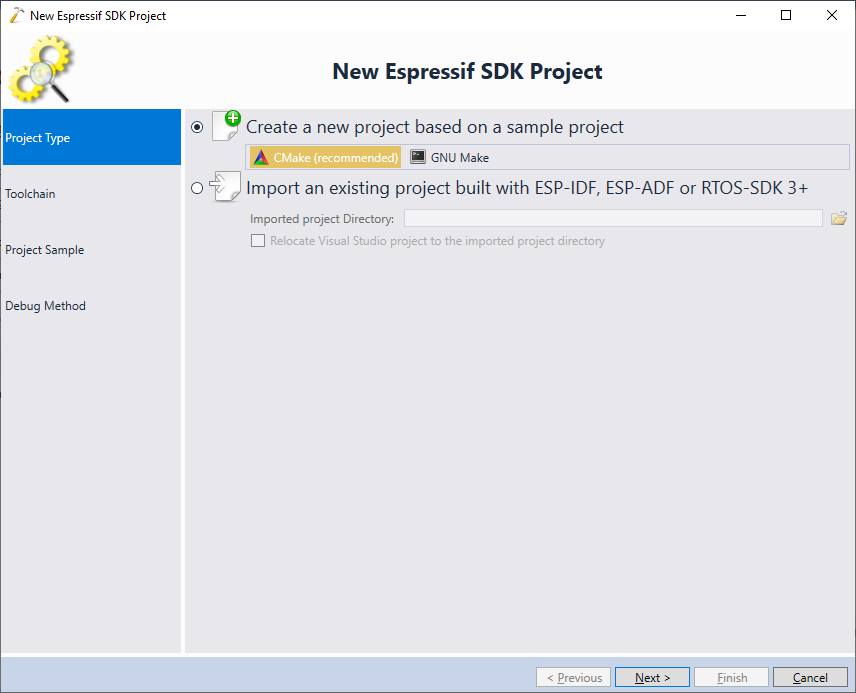
- Start Visual Studio and open the VisualGDB ESP32 Project Wizard:
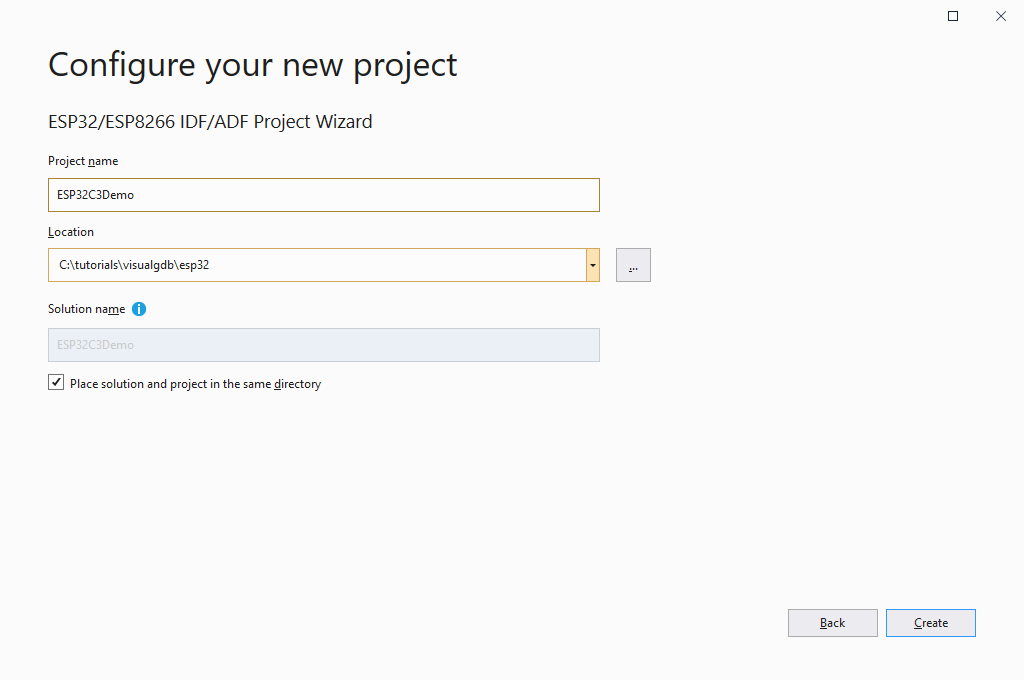
- Pick a name and location for your project:
- Proceed with the default CMake build system:
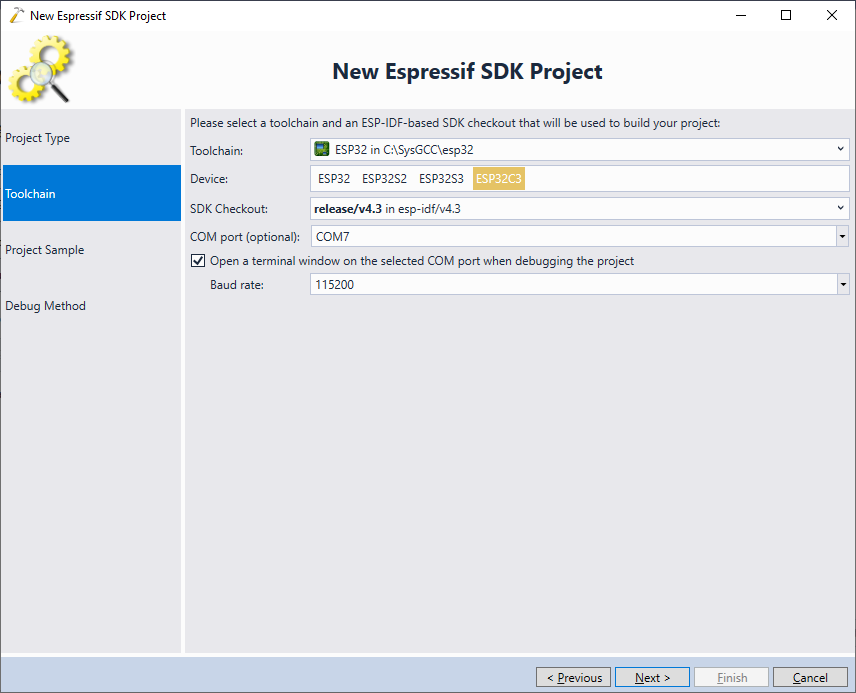
- Make sure you are using VisualGDB 5.6+, the esp32-gcc8.4.0-r3 toolchain or later and the ESP-IDF 4.3 or later. Then, select the ESP32C3 chip in the wizard:
 Update: For better compatibility with the latest ESP32 tools, we recommend selecting the consolidated toolchain instead.
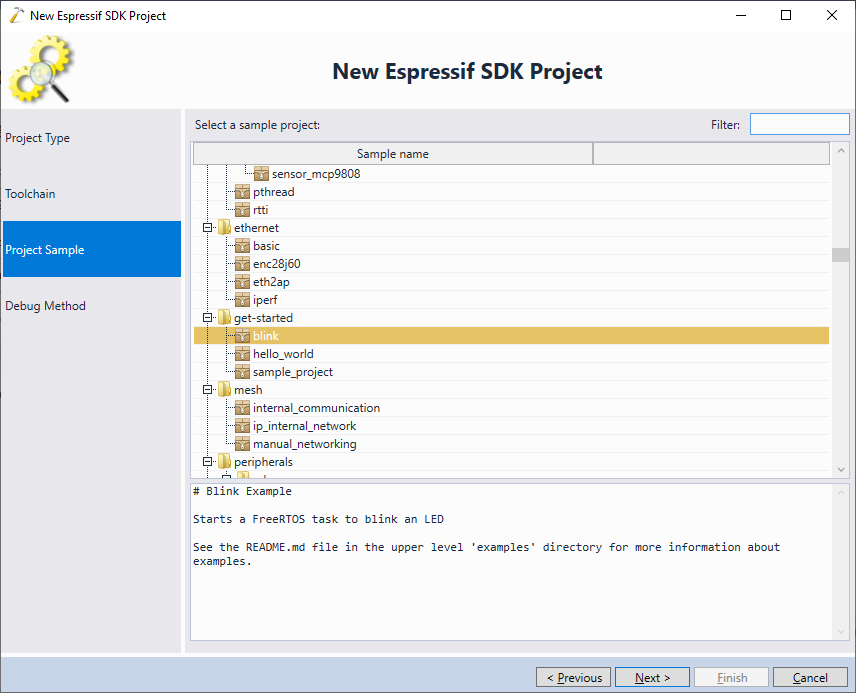
 - Proceed with cloning the basic “blink” example:
- Connect the secondary USB cable as shown in the beginning of this tutorial. VisualGDB will automatically detect the ESP32C3 built-in JTAG interface and will select it on the Debug method page. Press “Test” to verify the connection:
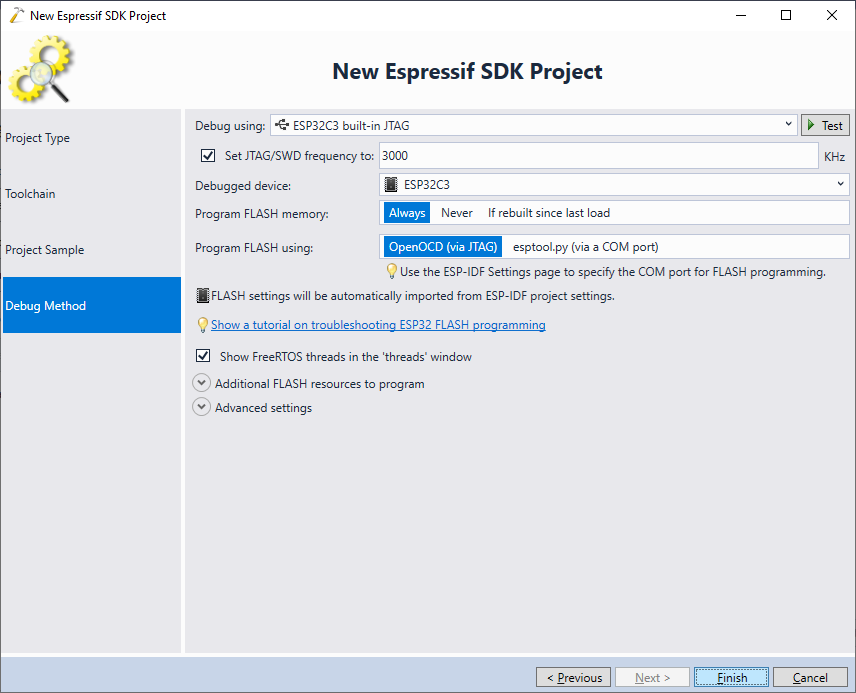
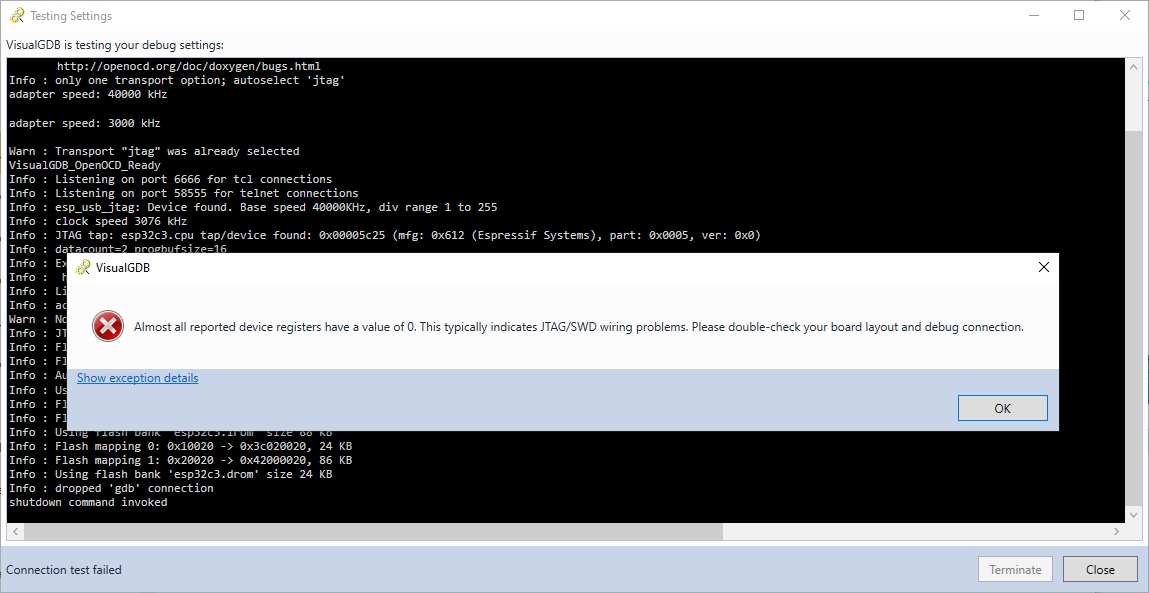
- Use the “test” button to verify the connection. Note that VisualGDB may report that most device registers are set to 0. This is expected for ESP32-C3 devices and does not indicate an error:
- Finally, press “Finish” to create the project. Now you will be able to build and debug it as usual:
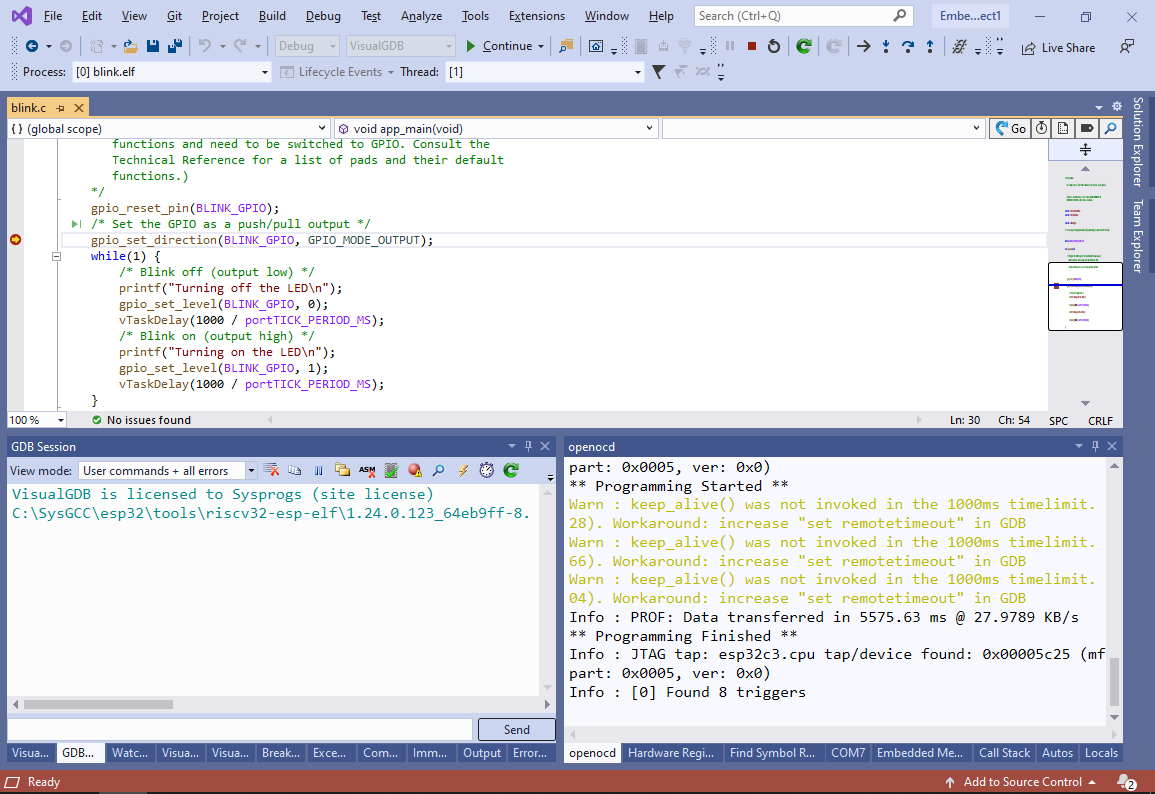
- Note that the default blink example does not blink the on-board LED. Instead, it configures IO5 (that would be normally used as a TDI signal for external JTAG debugging) as an output and slowly toggles it. In order to debug the code with an external JTAG debugger, this would need to be disabled (e.g. by changing the BLINK_GPIO) in addition to following the steps described here.