Debugging the PIO module on Raspberry Pi Pico
This tutorial shows how use VisualGDB to debug the PIO module on RP2040 (Raspberry Pi Pico). We will start with cloning the basic “hello_pio” sample, modify it to have a non-trivial PIO state machine program, and will show how to use VisualGDB to step the PIO state machine.
Before you begin, install VisualGDB 5.6 or later and make sure you are using the Custom edition or higher.
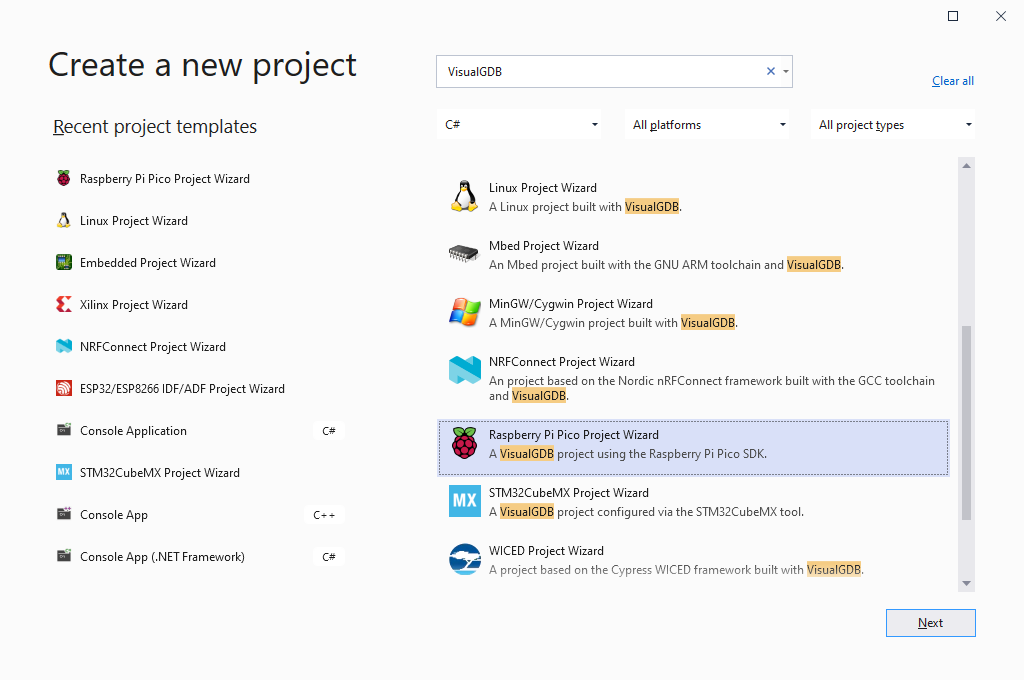
- Start Visual Studio, and locate the VisualGDB Raspberry Pi Pico Project Wizard in the Create a new project dialog:
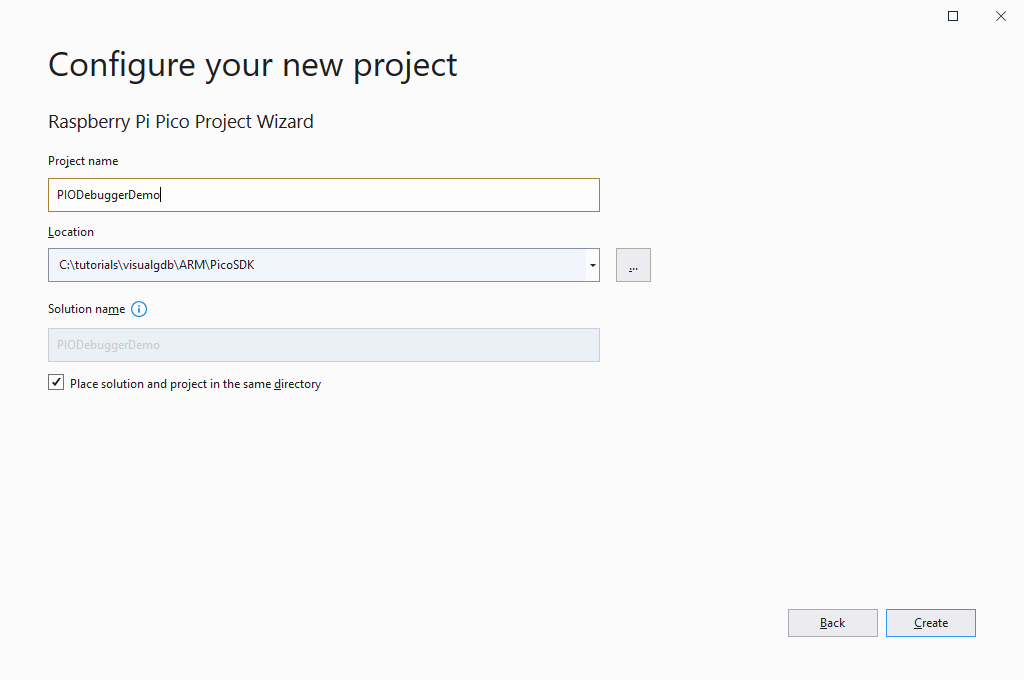
- Enter the name and location for your project, then click “Create” to launch the VisualGDB-specific part of the wizard:
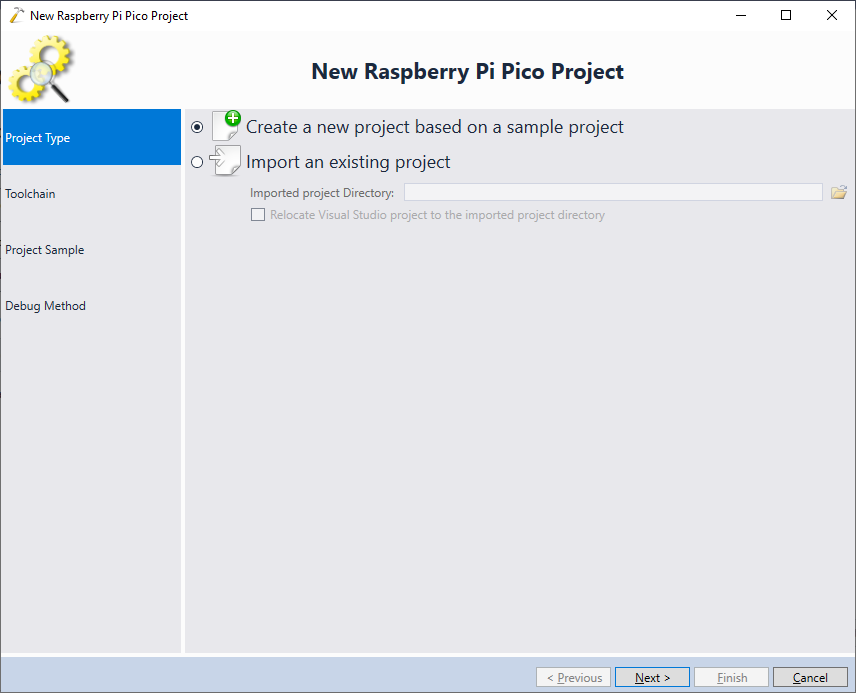
- In this tutorial we will be cloning the hello_pio sample from the SDK, so proceed with the “Create a new project” selection:
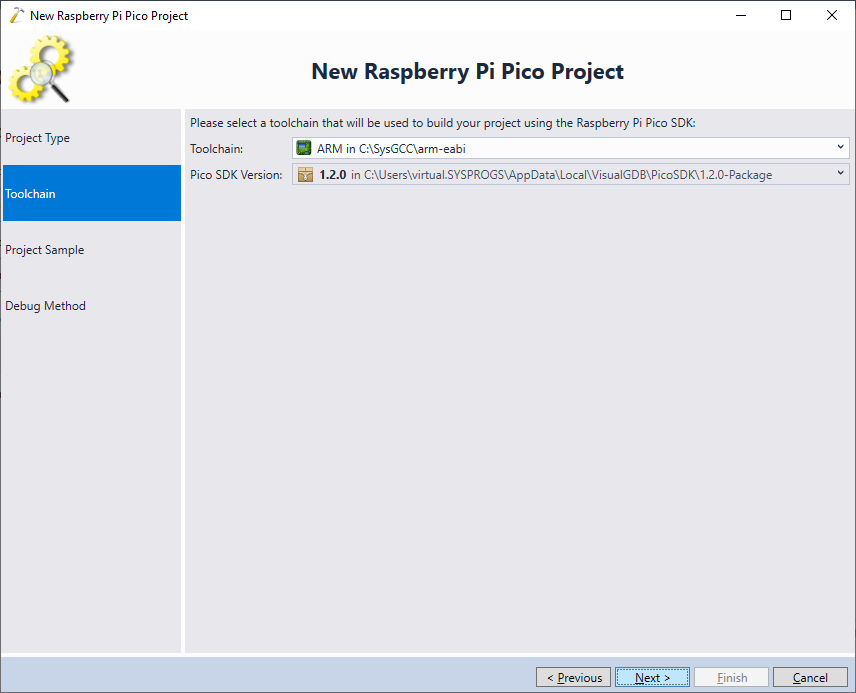
- On the next page of the wizard select the ARM toolchain and pick the latest version of the Pico SDK:
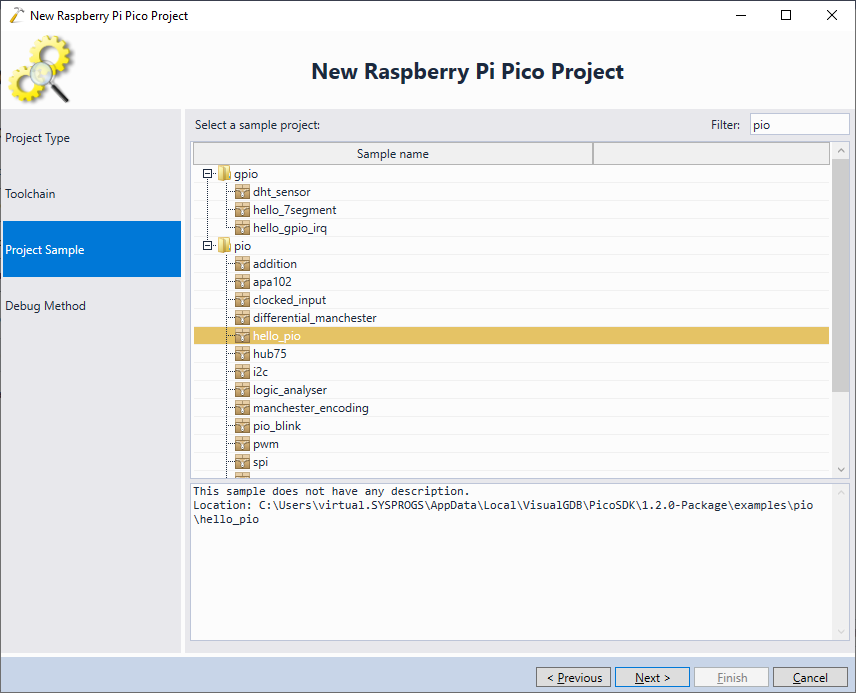
- On the Project Sample page select the hello_pio sample under the pio category. You can use the filter to easily filter out samples that don’t have “pio” in the name:
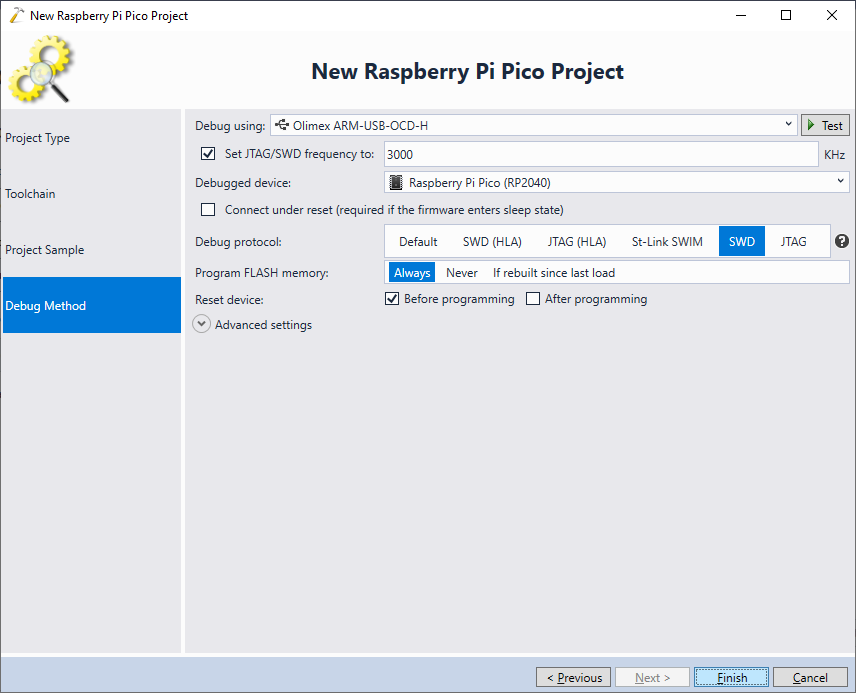
- Power on your Raspberry Pi Pico board and make sure it’s connected to an SWD debugger. See this page for detailed instructions on SWD setup. Once everything is connected, VisualGDB will automatically detect the debug settings:
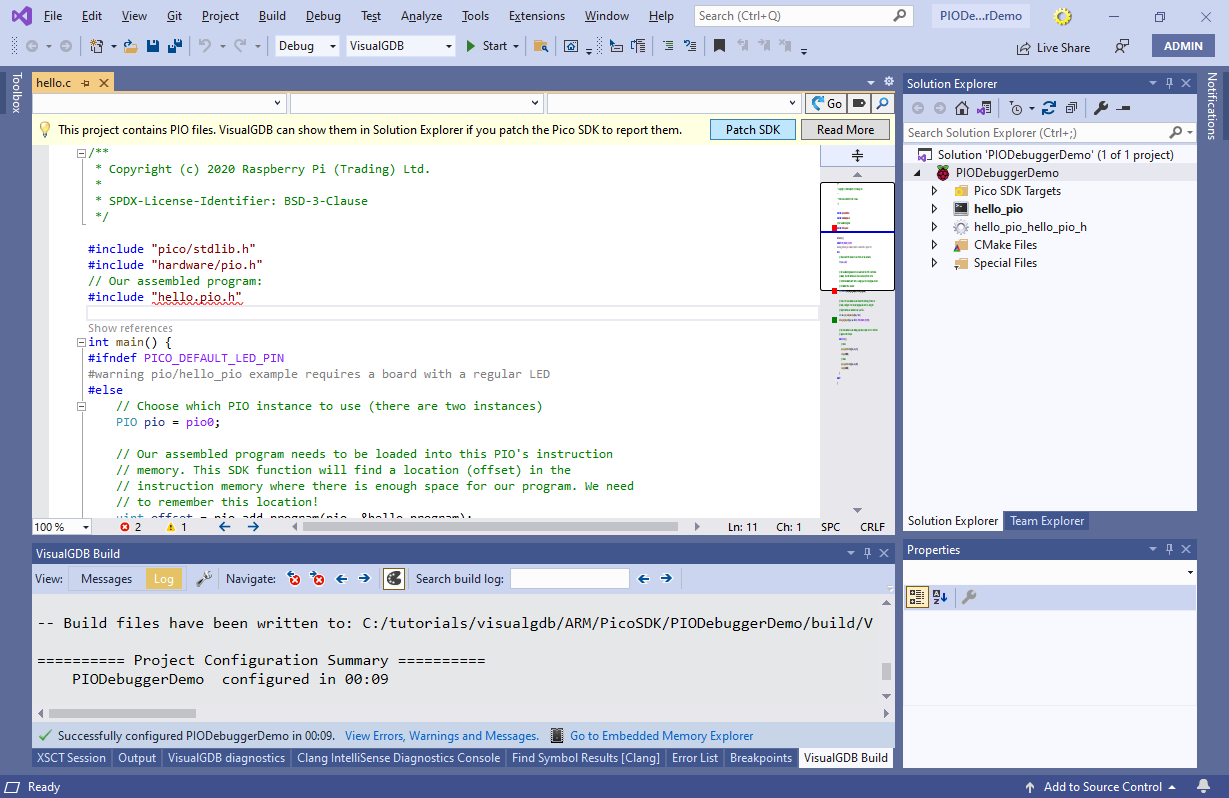
- Press “Finish” to generate the project. Note that initially, Solution Explorer won’t show the PIO files because the Pico SDK does not report them out-of-the-box. To fix that, press the “Patch SDK” button in the tooltip shown by VisualGDB, or patch the SDK manually as described on this page:
- Once the SDK has been patched, VisualGDB will show the PIO files in Solution Explorer and will highlight the PIO assembly syntax inside them. Try setting a breakpoint inside the loop in main() and starting a debug session. Once the breakpoint is hit, use the Debug->Windows->PIO Debugger command to open the PIO debugger:
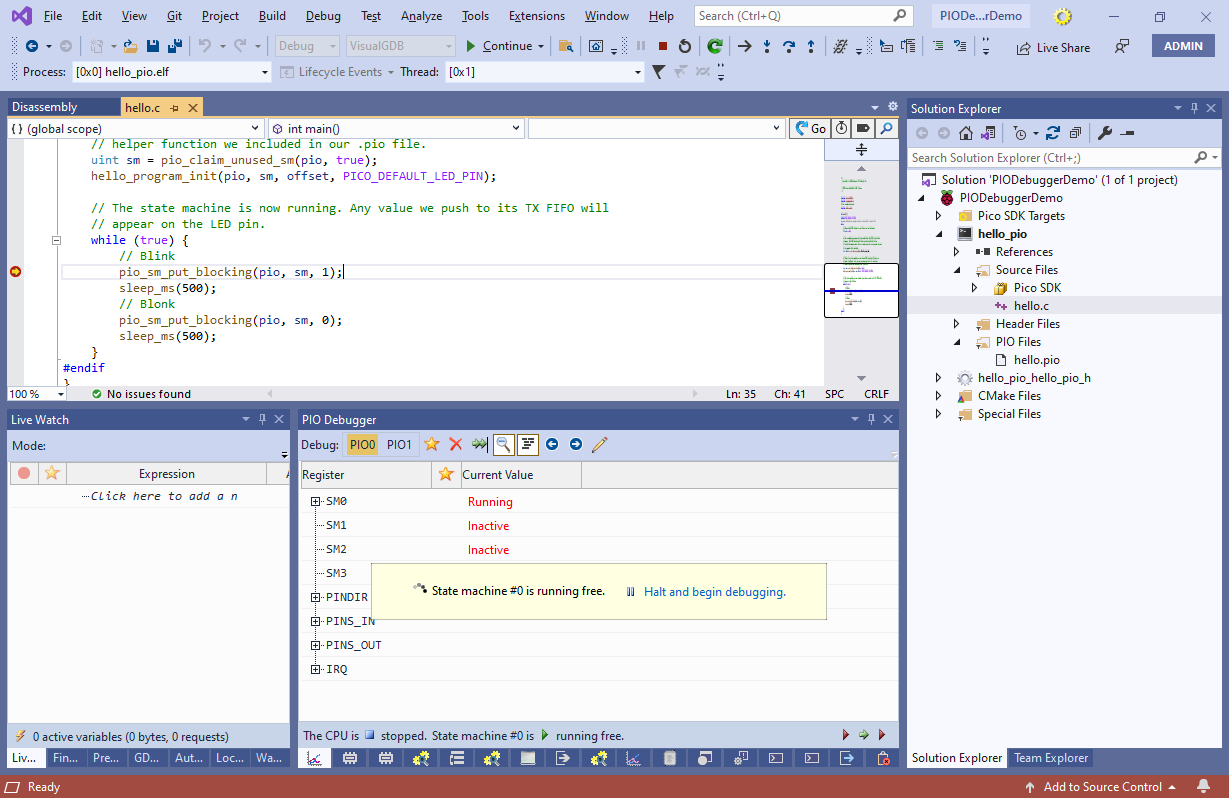 Normally, the PIO debugger tries to be as non-intrusive as possible. Even when the CPU is stopped at a breakpoint, the PIO will continue running and the PIO debugger will show it.
 - Click at the “Halt and begin debugging” link in the PIO Debugger window. VisualGDB will suggest doing another patch to the SDK to track down each PIO instruction to a source line in the corresponding .pio file. You can proceed with patching the SDK automatically, or do it manually as shown here:

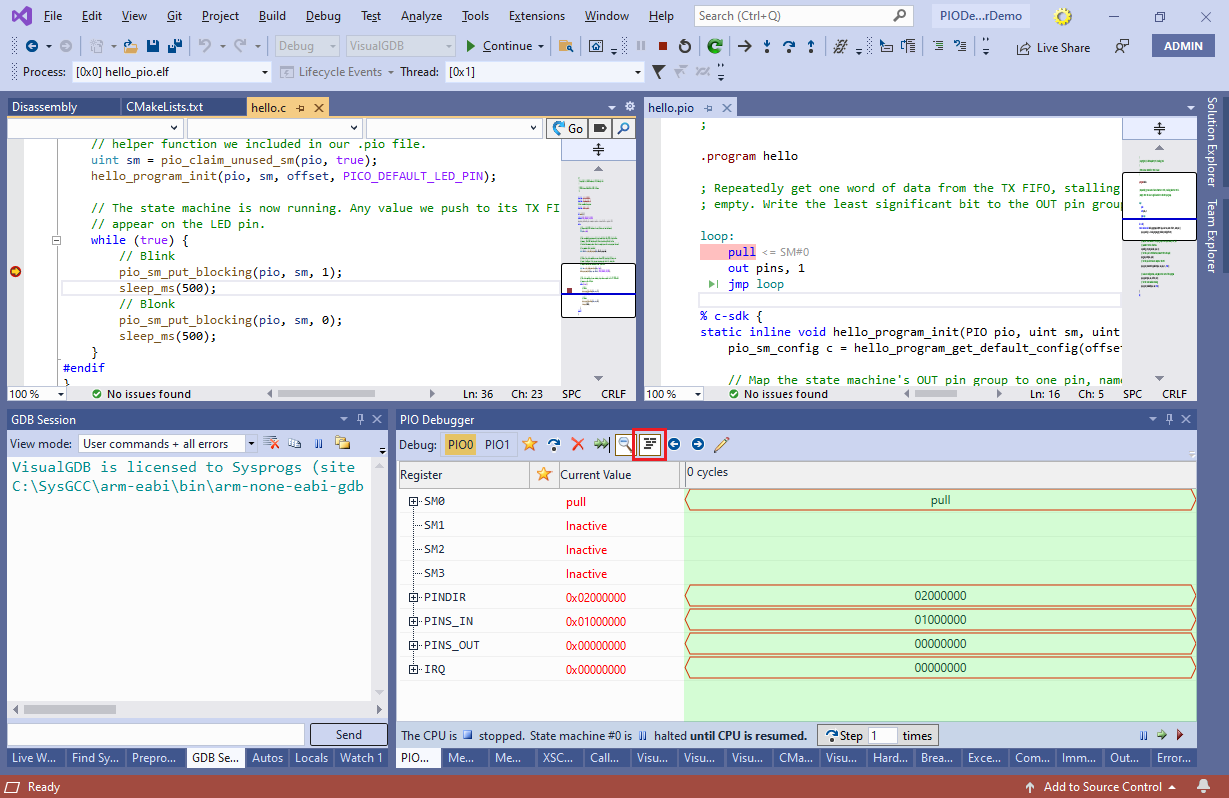
- Once the SDK has been patched, and the project has been updated to include the profiler framework, start debugging it again and let the breakpoint in the main loop hit. Click “halt and begin debugging” in the PIO debugger window again. This time VisualGDB will show the values of the PIO registers and will highlight the current PIO instruction in the .pio files as long as the highlighting is enabled via the button on the toolbar:
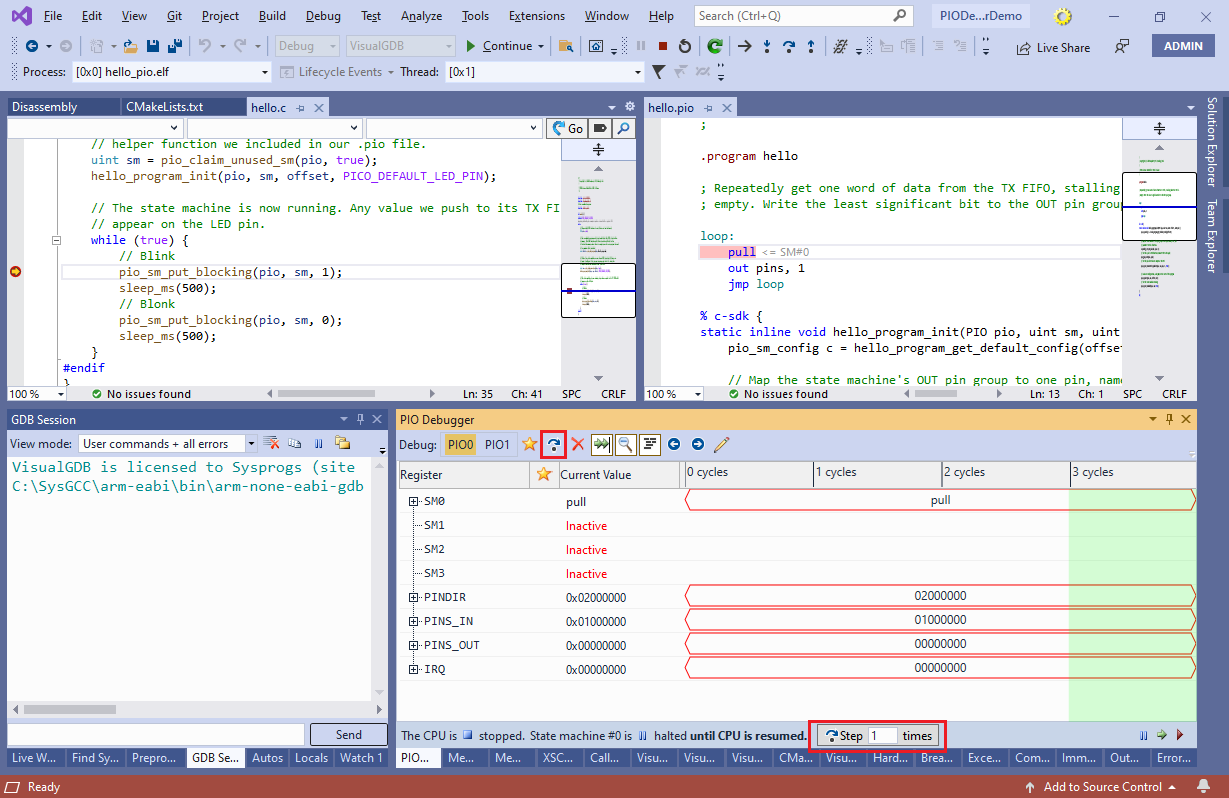
- You can step the PIO separately from the main CPU using the “step” button on the toolbar, or do multiple steps at a time using a button at the bottom of the PIO debugger:
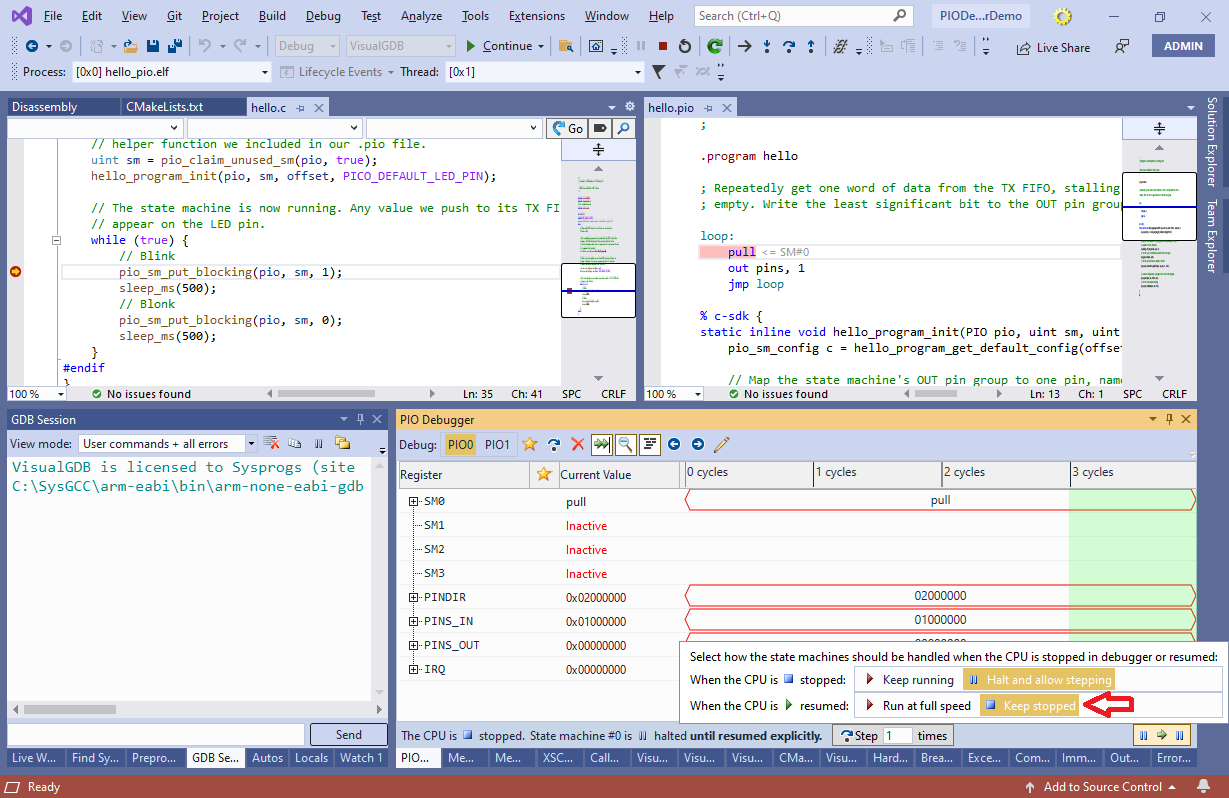
- Note that the PIO is stuck at the ‘pull’ instruction because the CPU has not fed any data into it. You can simply step over the call to pio_sm_put_blocking() to let the CPU send one data word to the PIO. To prevent the PIO from being resumed together with the CPU, click at the button to the bottom right of the PIO debugger and select “When the CPU is resumed => Keep Stopped“:
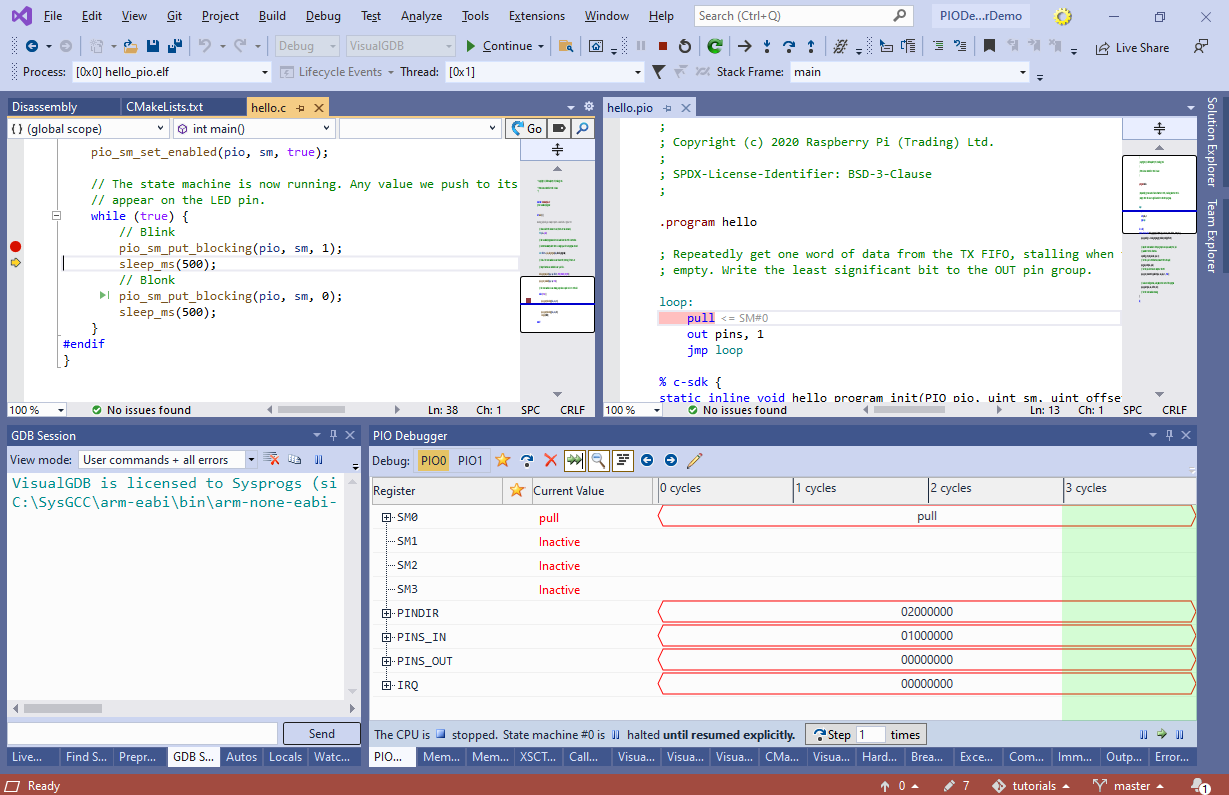
- Now you can step over the call to pio_sm_put_blocking() and the PIO will remain stopped at the ‘pull’ instruction:
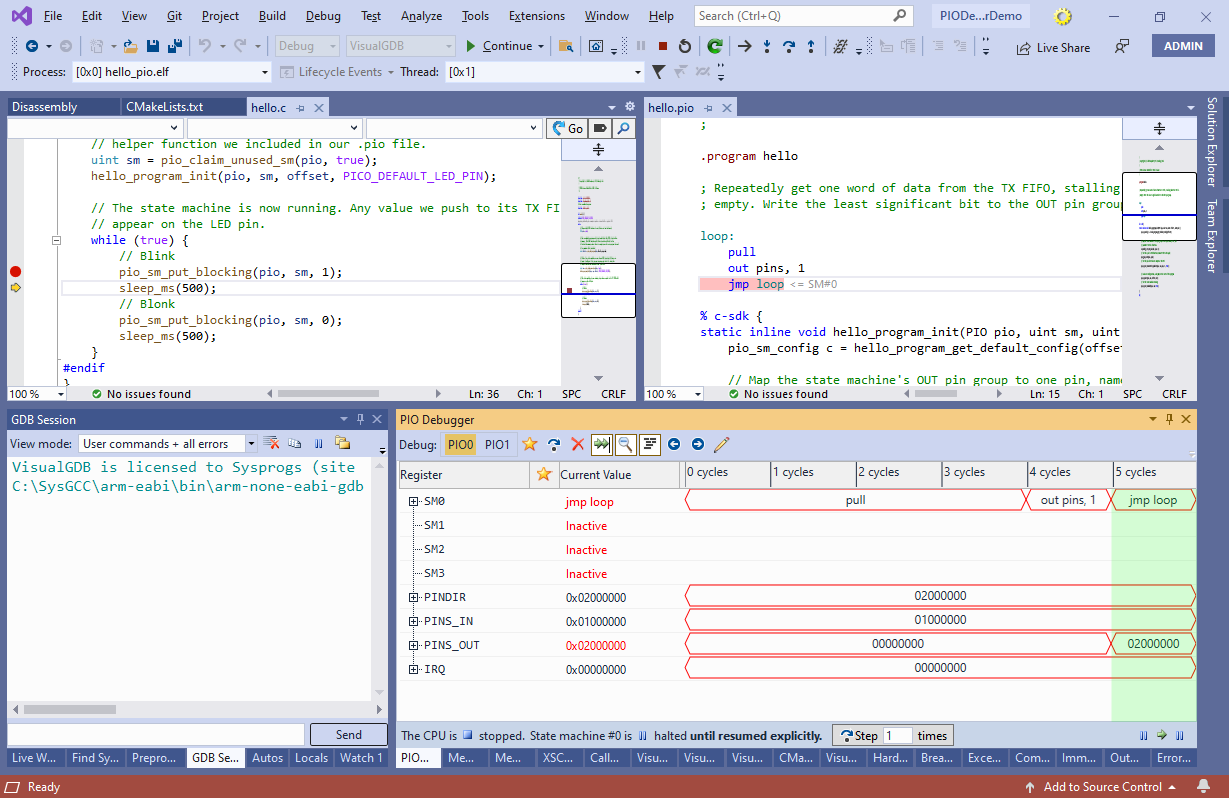
- Now you can step the PIO to record how it responds to the newly received data. Press the “Step” button in the PIO debugger window twice and observe how the state machine goes through the out instruction, changing the value of PINS:
- The PIO debugger always keeps history of the PIO state after each step. You can use the back/forward buttons in the PIO debugger to display the previous states of the PIO:

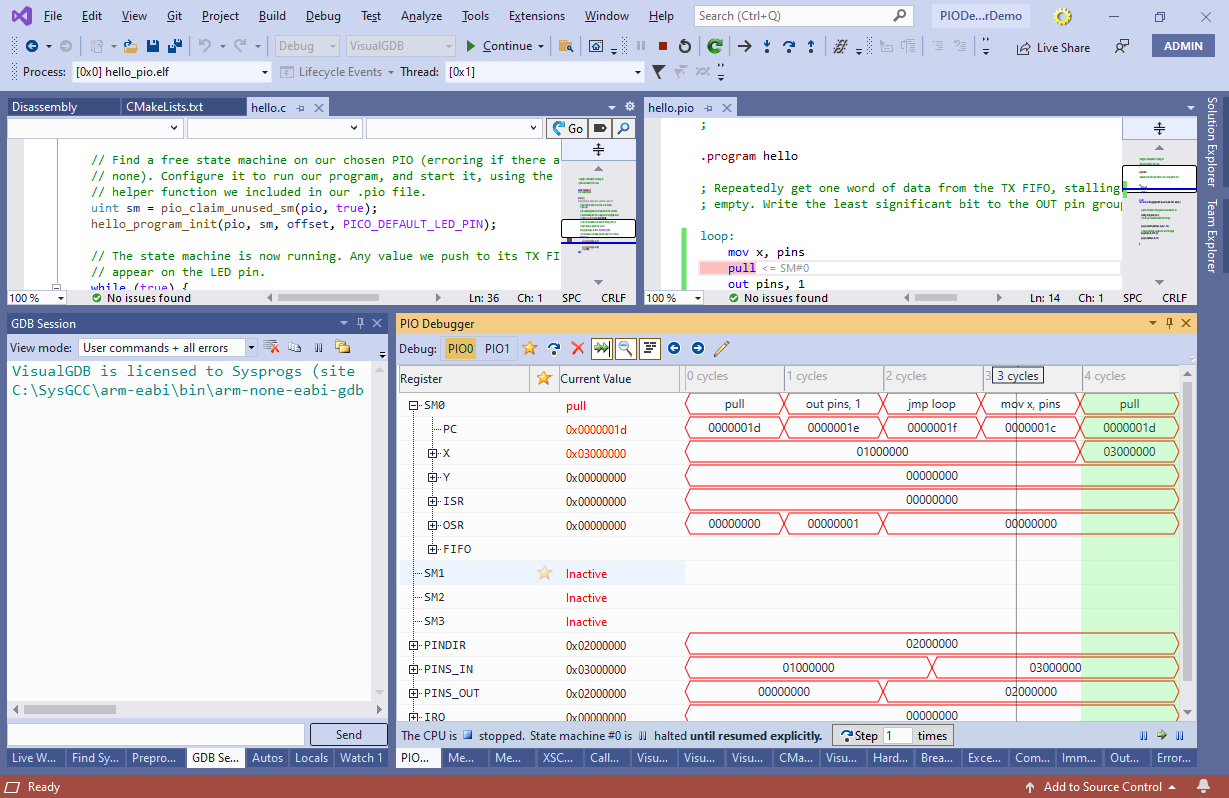
- Running both CPU and PIO state machines one step at a time works well when the PIO is used as an output. However, it it depends on some rapidly changing external signal that cannot be easily paused, this won’t work. To support debugging such scenarios VisualGDB allows overriding the input signals routed into the PIO. We will demonstrate it on a simple example. Modify the PIO program to load the value of PINS into the X register and run the program again. Use the same trick with stepping over pio_sm_put_blocking() to let the PIO run one full loop and observe how the value of the X register is changed after running the mov x, pins instruction:
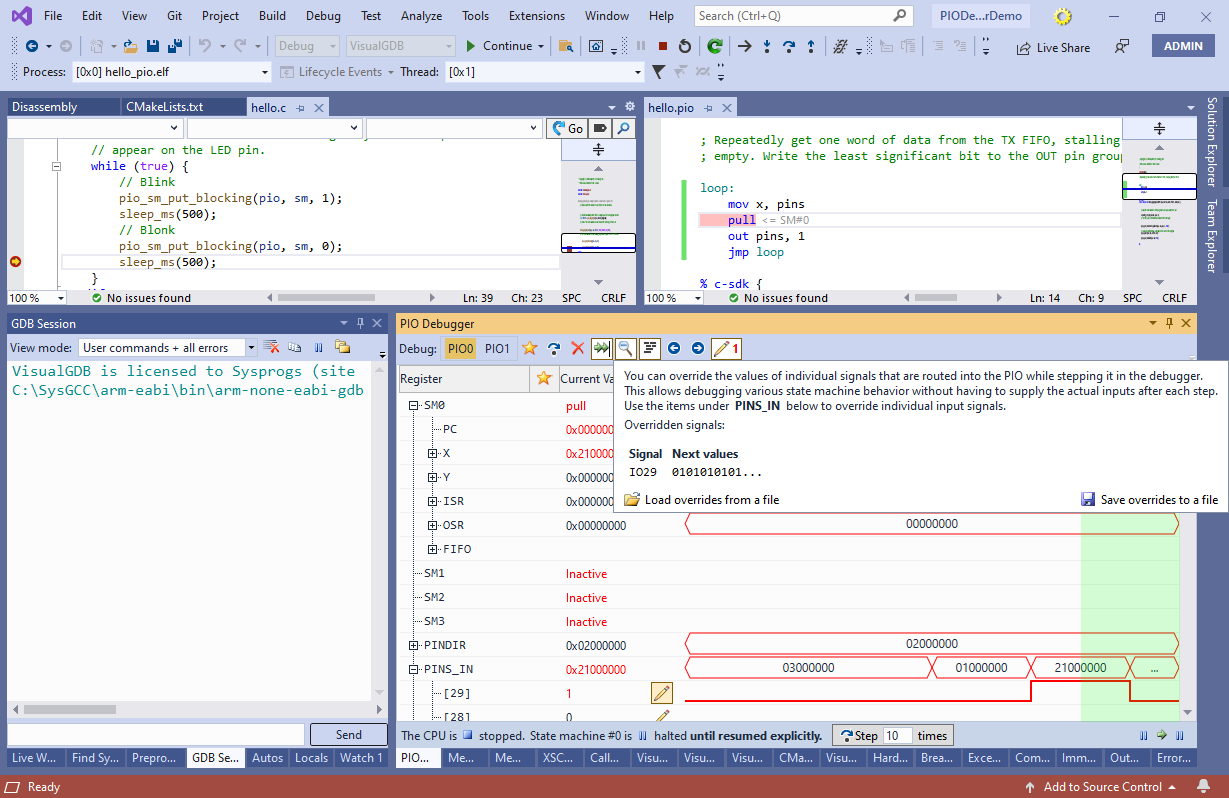
- For the sake of the demonstration, let’s assume that the input #29 is some external clock and we want to check how the PIO responds when it is set to 1. Step the PIO until it reaches the mov x, pins instruction again and click on the “override” button under PINS_IN -> [29]:
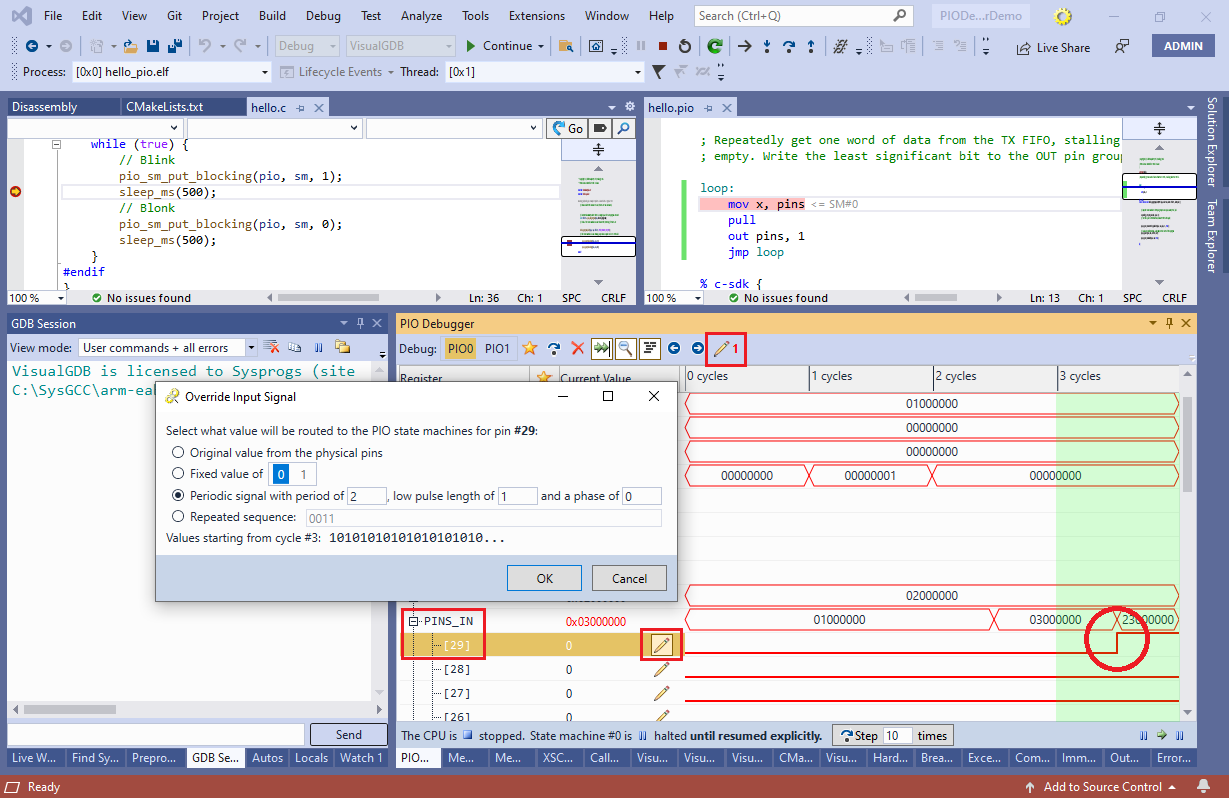 Configure VisualGDB to replace the signal on pin #29 with a periodic clock. See how the new value will be immediately displayed in the second half of last cycle and how the toolbar will indicate that 1 signal has been overridden.
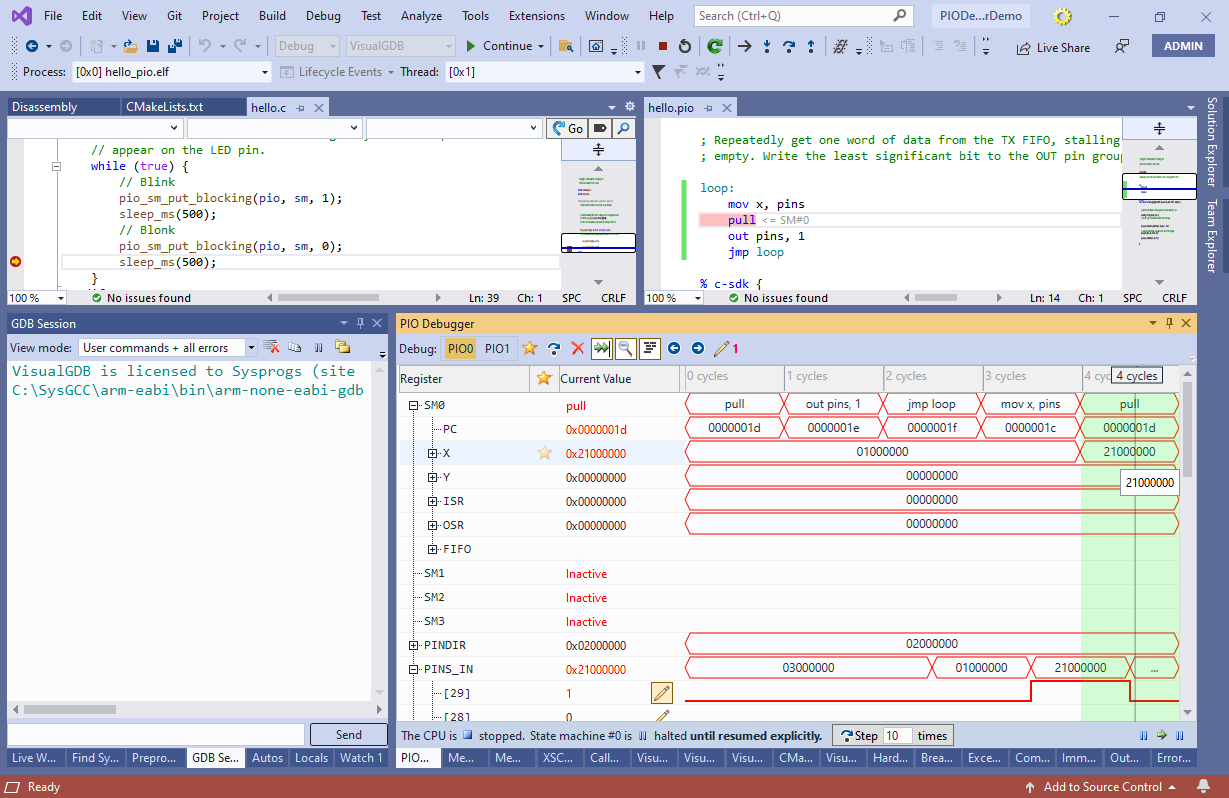
 - If you step over the “mov x, pins” instruction now, the value of X will have the 0x20000000 bit set, as if pin #29 had a value of 1:
 Overriding the signals does not affect the actual physical state of the pins. It only changes the value seen by the PIO (and any other peripherals inside the chip). The pins remain configured as inputs or outputs, depending on the previous configuration.
 - You can quickly switch between different sets of test signals by saving signal override configuration to XML files, and loading them back later:
 Note that loading overrides from a file resets their phase (i.e. all patterns and clocks will start from the beginning at the clock cycle when the override configuration was loaded).
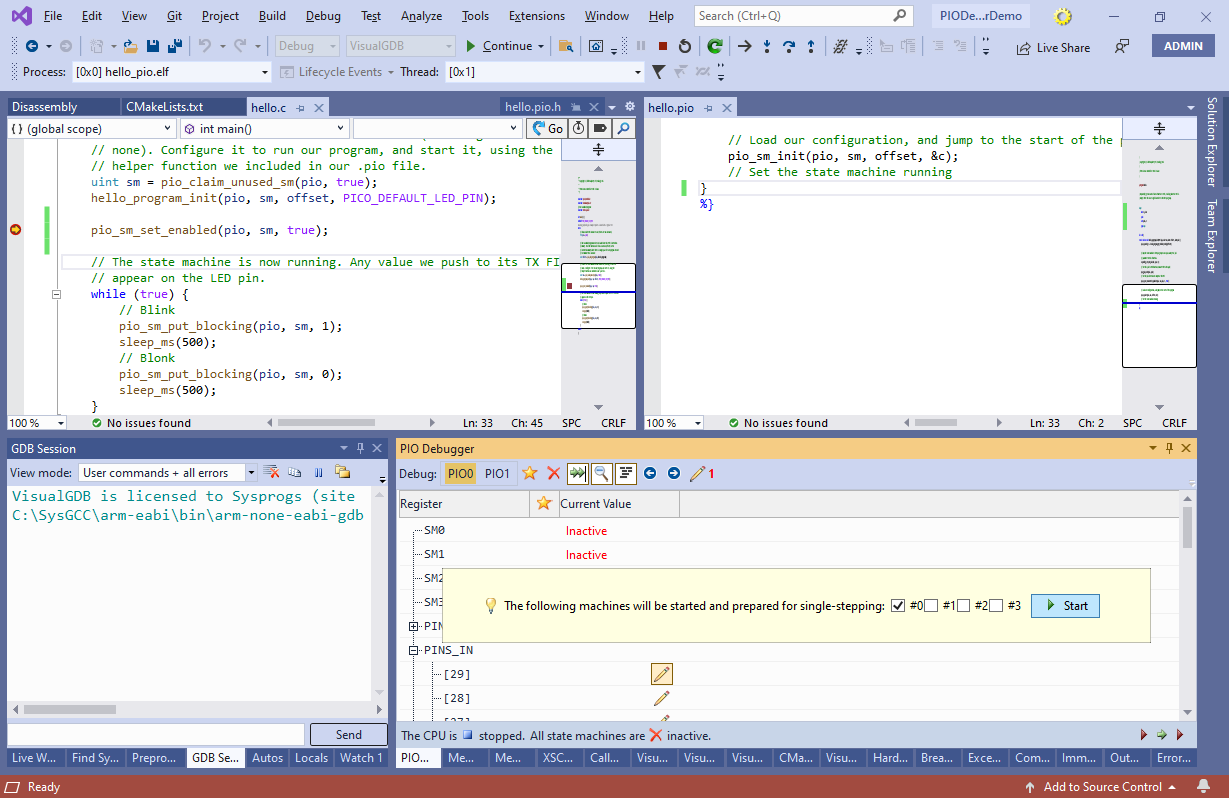
 - Note that in the previous run the PIO debugger started at the “pull” instruction and never recorded the first “mov x, pins“. This happened because the PIO executed that instruction before the PIO debugger had a chance to stop it. We will now show how to override this behavior and step the PIO programs from the very beginning. First of all, move the call to pio_sm_set_enabled() from hello.pio to hello.c. Then set a breakpoint on that call:

- Once the breakpoint hits, the PIO will be configured and ready to be started, but not running yet. Instead of letting pio_sm_set_enabled(), click the “Explicitly start one or more state machines” link in the PIO debugger, then select state machine #0 and click “Start”:
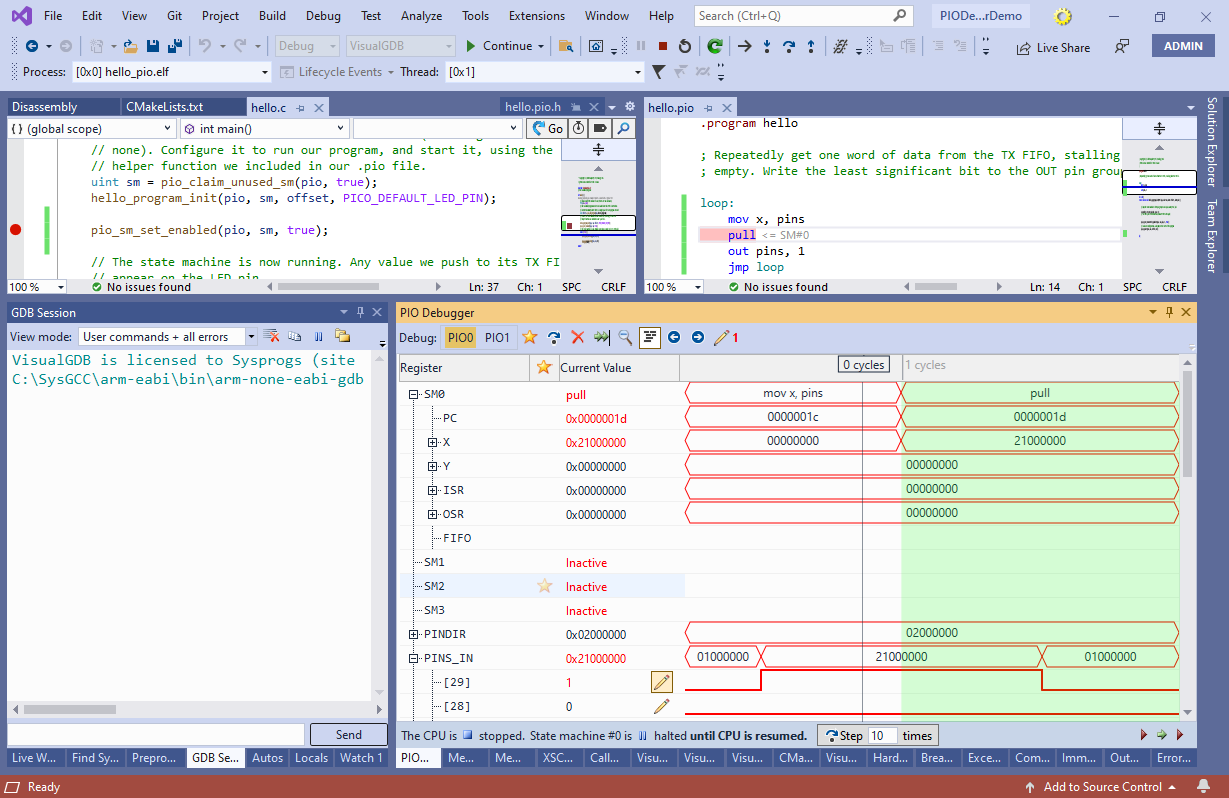
- VisualGDB will start the PIO and record its operation from the first instruction:
 Note that if you configure the PIO Debugger to keep the PIO stopped, and step over the pio_sm_set_enabled() call, it will still start the PIO, preventing VisualGDB from capturing its state. You can override this by right-clicking at the next code line after the call to pio_sm_set_enabled() and selecting “Set Next Statement” to force the CPU to skip that call.