Preparing PicoSDK projects for PIO debugging
This page describes the changes that need to be applied to the Raspberry Pi Pico SDK project in order to enable debugging the PIO hardware with VisualGDB.
Patch the PicoSDK to report the additional PIO file information.
VisualGDB can show the PIO files used by the targets in Solution Explorer, as long the SDK is patched to report them. To patch the SDK, open the <SDK path>\tools\CMakeLists.txt file, and locate the following line:
add_custom_target(${HEADER_GEN_TARGET} DEPENDS ${HEADER}) |
Add the following lines after that line:
set(${HEADER_GEN_TARGET}_INPUT_FILE "${PIO}" CACHE INTERNAL "") set(${HEADER_GEN_TARGET}_OUTPUT_FILE "${HEADER_DIR}/${PIO_NAME}.h" CACHE INTERNAL "") set(${HEADER_GEN_TARGET}_CONTAINING_TARGET "${TARGET}" CACHE INTERNAL "") |
If you reload the project now, the PIO files will appear directly under the target nodes in Solution Explorer, together with sources and headers:
Patch the _pio_add_program_at_offset() function
VisualGDB can automatically translate PIO instruction pointers to the locations in the PIO files. In order to enable this, the function responsible for loading PIO programs in pio.c file inside the SDK needs to be modified as shown below:
void __attribute__((weak)) SysprogsDebugger_PIOProgramLoaded(PIO pio, const pio_program_t *program, uint offset) { } static void _pio_add_program_at_offset(PIO pio, const pio_program_t *program, uint offset) { SysprogsDebugger_PIOProgramLoaded(pio, program, offset); /* ... */ } |
The function name depends on the PicoSDK version:
| PicoSDK 1.x | _pio_add_program_at_offset() |
| PicoSDK 2.x | add_program_at_offset() |
This will have minimal performance overhead (calling one empty function when loading PIO programs) normally, but when you reference the Fast Semihosting and Profiler framework, VisualGDB will be able to track what code got loaded into the PIO program memory, and will automatically map it to the original .pio files: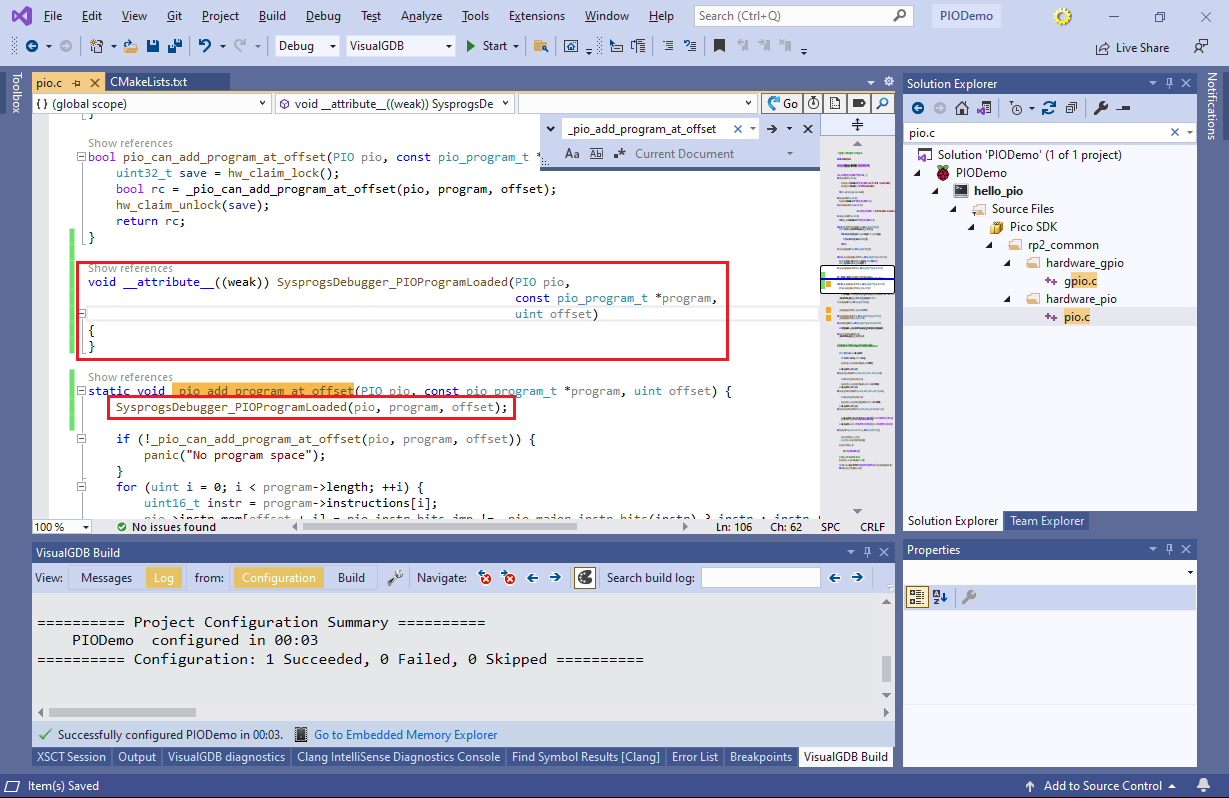
Now that you have successfully patched the Pico SDK, you will be able to use the VisualGDB’s PIO debugger to debug the PIO programs.