Linux Debugger Settings
This page explains various debug settings of Linux-based projects. You can configure these settings via VisualGDB Project Properties -> Debug Settings for projects targeting Linux systems.
Contents
Attaching to existing processes
Using a different debugger
Tweaking GDB parameters
Running GDB on a different machine
Configuring break-in logic
Using Advanced CMake projects
Troubleshooting GDB issues
Attaching to Existing Processes
Instead of launching a new instance, you can configure VisualGDB to attach to an existing instance: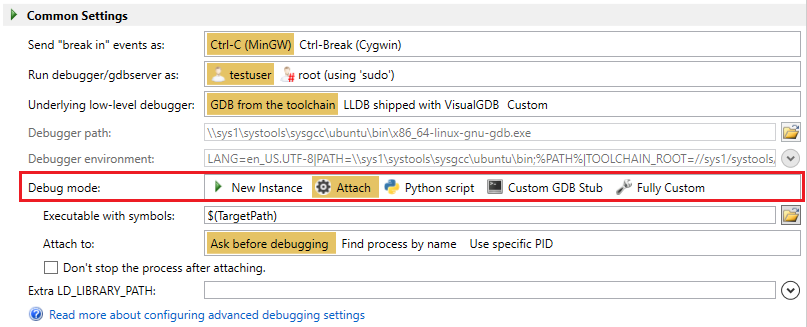 If this option is selected, starting debugging with F5 will automatically attach to an existing process instance. Normally, VisualGDB will try to find the process by name, however you can also configure it to use a harcoded PID, or to run a custom script printing the PID to attach.
The script can be configured via VisualGDB Project Properties -> Custom Debug Steps -> Before Launching Debugger -> Set an Internal Variable -> AttachPID.
Using a different debugger
Normally, VisualGDB will automatically run the gdb debugger from your toolchain. However, you can configure it to launch the LLDB debugger shipped with VisualGDB, or to use an arbitrary executable: 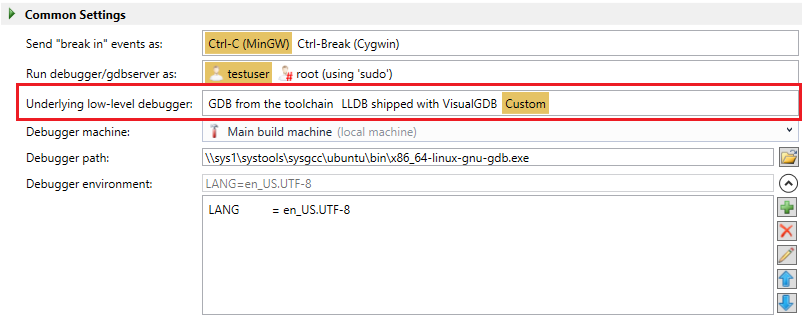 Note that the gdb executable must be built to match your target. E.g. gdb build for the arm-none-eabi target cannot debug an AMD64 Linux system, or vice versa.
Tweaking GDB Parameters
You can completely override the command line used to launch GDB by selecting the “Fully custom” debug mode: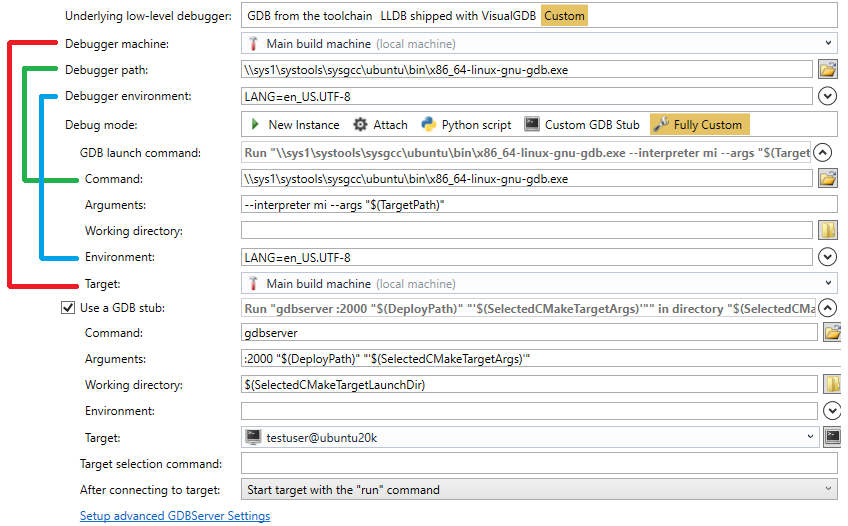 Note that some of the parameters in the Fully Custom mode are linked to the settings above the Debug Mode setting.
The table below summarizes various settings that can be configured in this mode:
| Setting | Description |
| GDB Launch Command | Specifies the gdb executable to use. If your GDB build depends on additional libraries (e.g. Python), their location may need to be added to Environment->PATH. |
| GDB Launch Arguments | Exact arguments passed to gdb. Must include the –interpreter mi part to enable the GDB machine interface (as opposed to the regular command-line mode). Typically follows the –interpreter mi –args <Application> <Arguments> structure. |
| GDB Environment | Specifies the environment variables passed to GDB. Typically has the PATH=%PATH%;<extra PATH> structure. If GDB is running on Linux, VisualGDB will still understand the %PATH% syntax, however “;” with need to be replaced with “:”. |
| Use a GDB stub | Enable this setting if you would like VisualGDB to launch an arbitrary program (e.g. gdbserver) before launching gdb, and terminate it after the end of the debug session. |
| GDB Stub Command/Arguments | Specifies the exact GDB stub to run and the arguments passed to it. |
| Target selection command | Specifies the GDB command that will be issued to connect to the target. When using GDB stubs, it is typically “target remote <host>:<port>“. It can also be an “attach” command or a command launching the built-in simulator. |
| After connecting to target | Specifies how to continue the debug session after GDB has connected to the target. If the target is selected with “target remote“, GDB would expect a “continue” command. If a target is built-in (e.g. the GDB simulator), use the “start” command instead. You can alternatively configure VisualGDB to stop immediately after attaching to the target so that you could continue debugging by pressing F5. |
Running GDB on a different machine
Normally, VisualGDB will automatically select the machine where to run gdb. If you are building the code directly on the target, VisualGDB will run gdb there. If you are using a cross-toolchain, VisualGDB will run the GDB executable from that toolchain. However, in some cases (e.g. compatibility issues between gdb/gdbserver) you can explicitly specify where to run the gdb executable. In order to do that, first enable the “Allow choosing build/clean/debug command hosts independently” checkbox on the Project Settings page (requires VisualGDB Custom Edition or higher):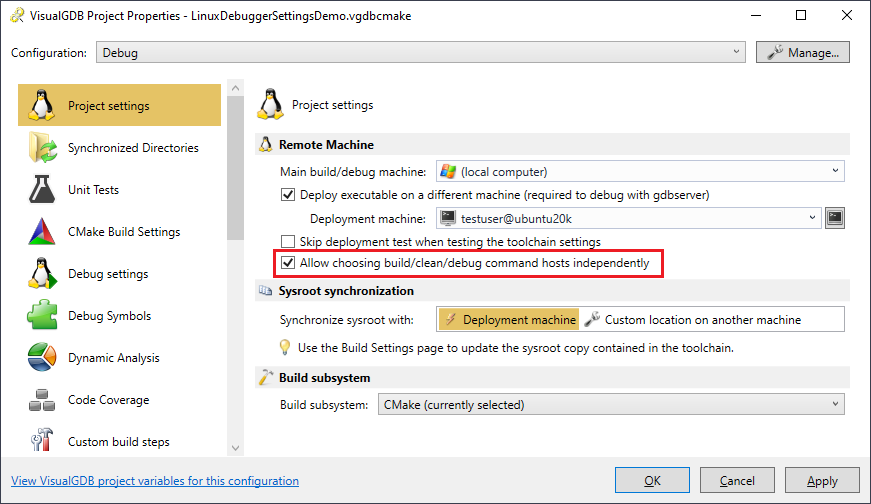 Then you can switch the underlying low-level debugger setting (1) to Custom and pick a different machine below (2):
 Make sure the Debugger Path and Debugger Environment settings make sense on the selected machine. If you switch the debugger machine to Deployment Machine, VisualGDB will automatically pick the default gdb executable.
If you are launching a new instance of the application, VisualGDB will automatically skip over launching gdbserver if the Debugger Machine is set to Deployment Machine. However, you can also explicitly turn it off by switching to the Custom mode: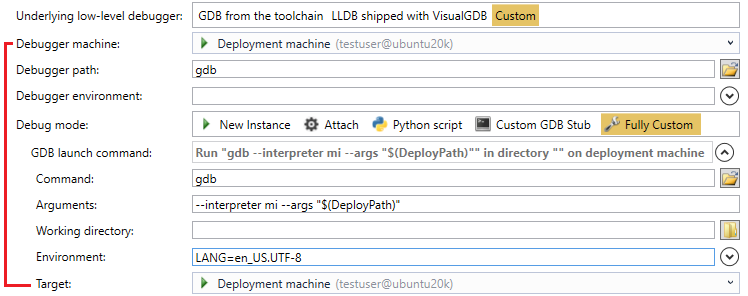
Note that the host setting in under the GDB Command is linked to the Debugger machine setting.
WARNING! If you are switching to run the GDB on a different machine, make sure the application is uploaded to that machine and that you are using the correct path. In most of the cases, simply changing $(TargetPath) to $(DeployPath) should sufficient. You do not need to upload the source files to the machine where gdb is running, however if VisualGDB has trouble finding
Configuring Break-in Logic
If stepping through the code works fine, but you cannot stop the program or set any breakpoints while it’s running, the GDB debugger is not properly receiving the break-in requests.
Normally, if VisualGDB needs to stop the debugger (e.g. to set a breakpoint) while the target is running, it would send a Ctrl-C or Ctrl-Break event to either gdb itself, or the gdb stub (e.g. gdb server) that is controlling the target. However, in some combinations of tools and target settings, this mechanism may not work correctly. If this happens, you can explicitly configure how and where should VisualGDB send the break-in requests.
First of all, you can switch between sending the Ctrl-C and Ctrl-Break events in VisualGDB Project Properties -> Debug Settings: This setting only has effect if the tool receiving the request is running on Windows. Older cygwin-based tools would ignore the Ctrl-C events, but would respond to Ctrl-Break. Newer Cygwin-based tools and all MinGW-based tools typically respond to Ctrl-C and terminate when they receive Ctrl-Break. If the tool receiving the request is running on Linux, this setting is ignored.
It neither Ctrl-C nor Ctrl-Break options work and you are using gdbserver (i.e. are deploying the executable to a different machine), you can explicitly configure VisualGDB to send the break-in event to the gdbserver instead of gdb. First of all, switch the Debug Mode to Custom GDB Stub or Fully Custom (VisualGDB will try to automatically compute the stub command line from the previous setting), then click the “Setup advanced GDBServer settings” link below the rest of the settings and finally change the break-in target to GDB Stub there: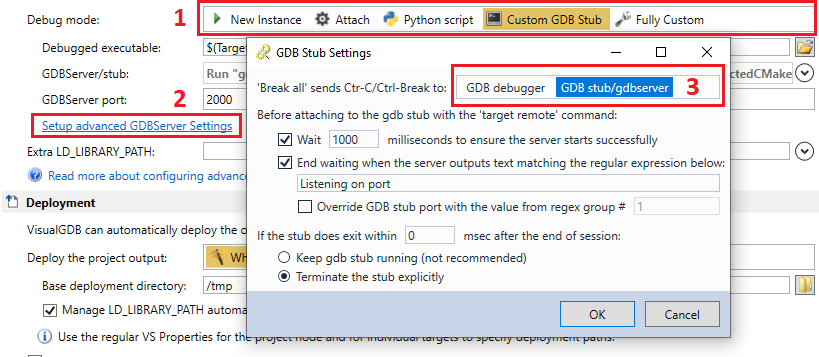
If this doesn’t help either, you can try checking if sending SIGINT directly to the debugged application works. Try running “kill -s INT <PID>” on the target while a debug session is active, and if it works, “killall -s INT <Executable name>“. The debug session should stop, reporting a SIGINT signal: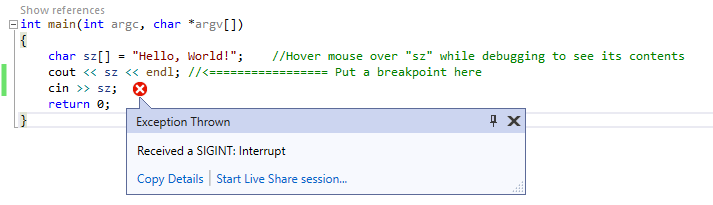 If this works, you can configure VisualGDB to run the “killall” command automatically each time it needs to stop the target:
 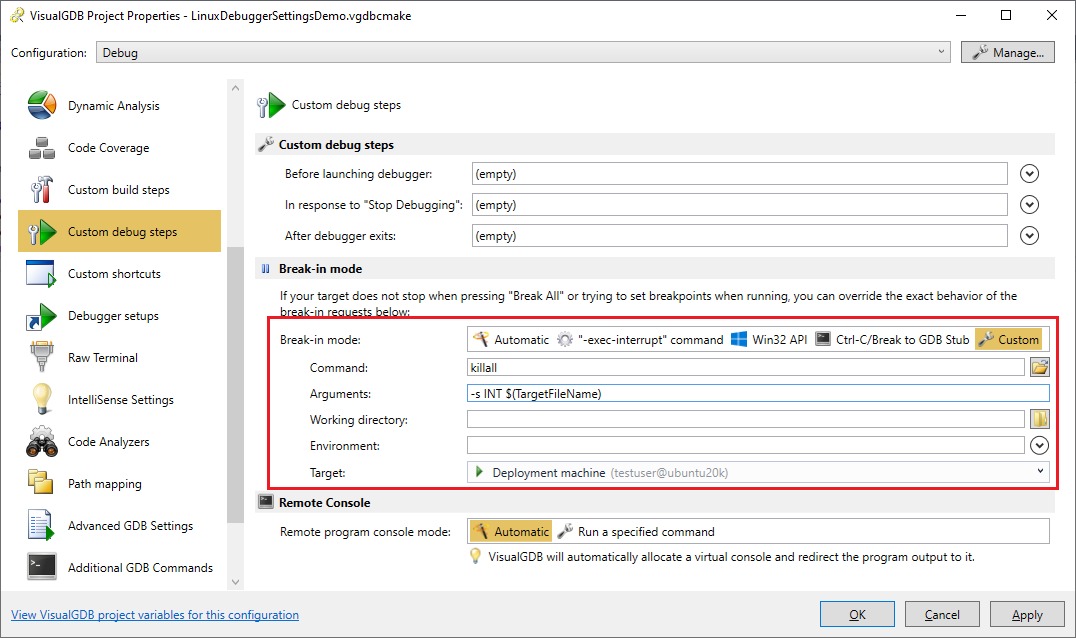 Another option would be to enable the asynchronous mode via VisualGDB Project Properties -> Advanced GDB Settings:
This method does not rely on the Ctrl-C events, however may not work on older targets.
If enabling asynchronous mode causes errors with setting/removing breakpoints, try disabling the “asynchronous mode supports breakpoint commands” setting below the “asynchronous mode” checkbox. This will force GDB to stop the target for setting breakpoints even when using asynchronous mode.
Finally, if nothing else works and you are using gdbserver (i.e. deploying the target to another machine), you can explicitly switch VisualGDB to run gdb on the target directly. Follow the instructions in this section to switch the GDB machine to Deployment Machine and VisualGDB will run gdb directly there. If VisualGDB has trouble setting breakpoints or displaying source files, you may need to adjust the path mappings via VisualGDB Project Properties -> Path Mapping. Try comparing the GDB log from the gdbserver-based session and the direct session (specifically the breakpoint-related command and GDB responses to the -stack-list-frames command to recheck if the path mapping needs adjustment).
Using Advanced CMake projects
If you are using Advanced CMake projects, all targets within the same project will share the same debugging/deployment settings. However, you can still specify different working directories and command-line arguments for each target via per-target properties: VisualGDB will automatically set the $(TargetPath), $(SelectedCMakeTargetArgs) and $(SelectedCMakeTargetLaunchDir) variables based on the specific target being debugged. You can also define per-target additional variables via the Advanced -> Additional Internal Variables setting in the per-target properties.
Troubleshooting GDB Issues
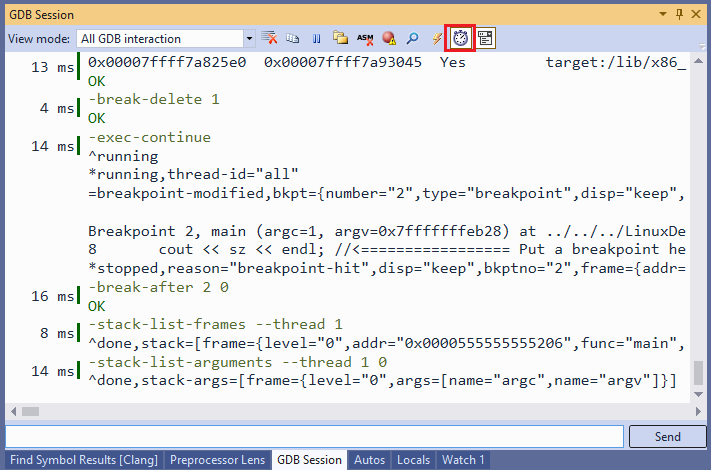
If you experience strange issues with GDB, you can configure VisualGDB to log all interaction with the gdb debugger (including the precise timing) to a log file via VisualGDB Project Properties -> Advanced GDB Settings: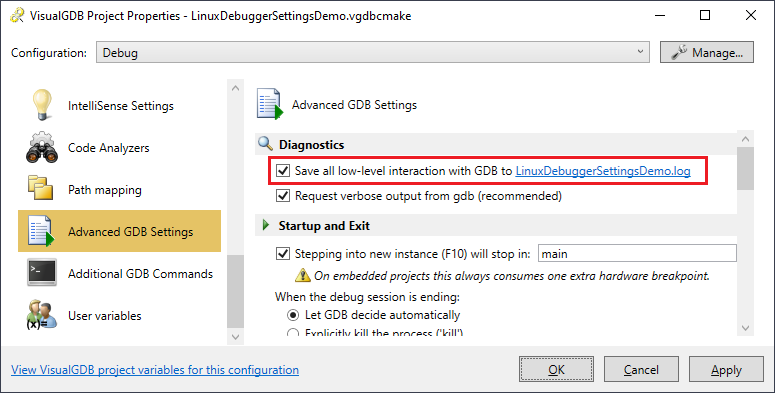 Reviewing the log file (or comparing log files from multiple debug sessions) could provide insights into the cause of the problems.
You can also view the GDB commands in real time using the GDB Session window. If you are tracking down slow performance, enabling the timing mode will show how much time exactly each of the commands took: