Developing ST BlueNRG-LP Projects with Visual Studio
This tutorial shows how to use Visual Studio with VisualGDB to target the STEVAL-IDB011V1 board featuring the BlueNRG-LP device. We will show how to quickly clone the examples from the BlueNRG SDK, edit them and debug them in Visual Studio.
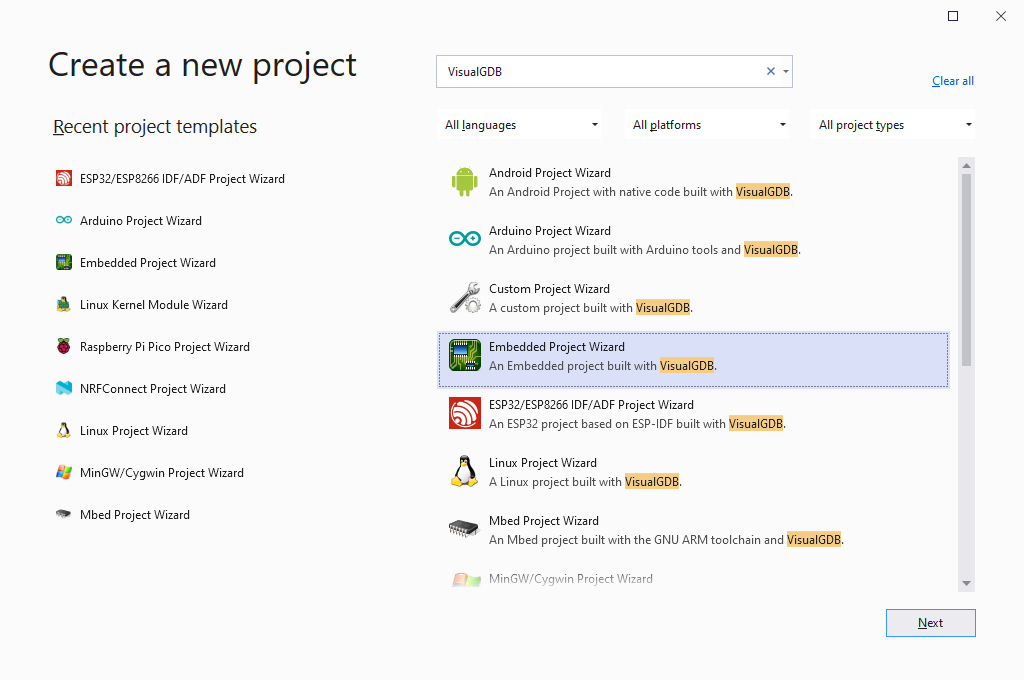
- Start Visual Studio and open the VisualGDB Embedded Project Wizard:
- Enter the name and location for your project, then press “Create”:

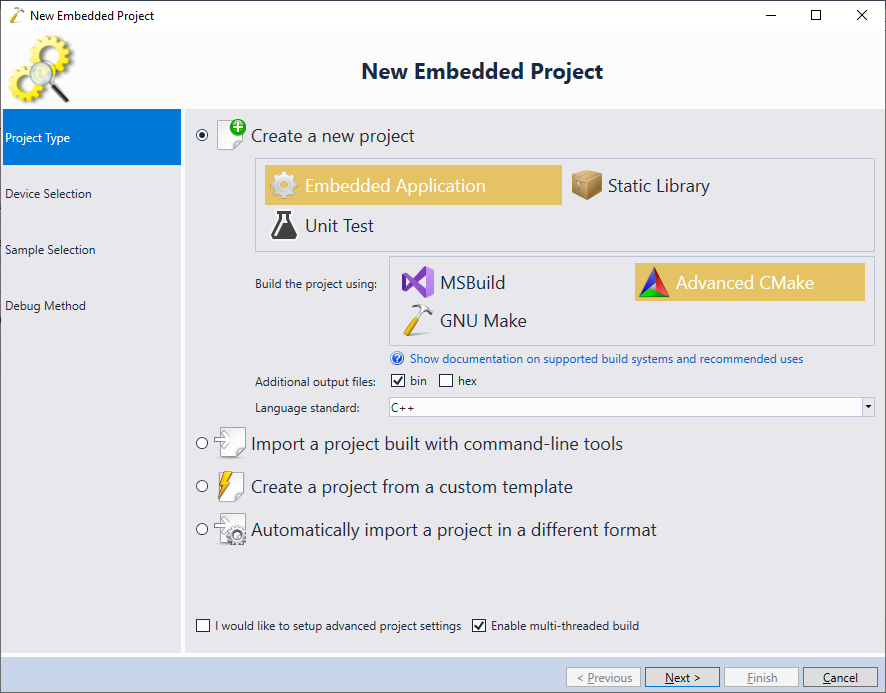
- On the first page of the VisualGDB-specific part of the wizard, select “Create a new project -> Application -> Advanced CMake“:
- On the next page select the ARM toolchain and pick the BlueNRG-LP device. If you have not installed the BlueNRG-LP BSP, click “Install” to automatically download and install it:

- Once the BSP is installed, VisualGDB will allow selecting the BlueNRG-LP device and will show various configuration options for it:

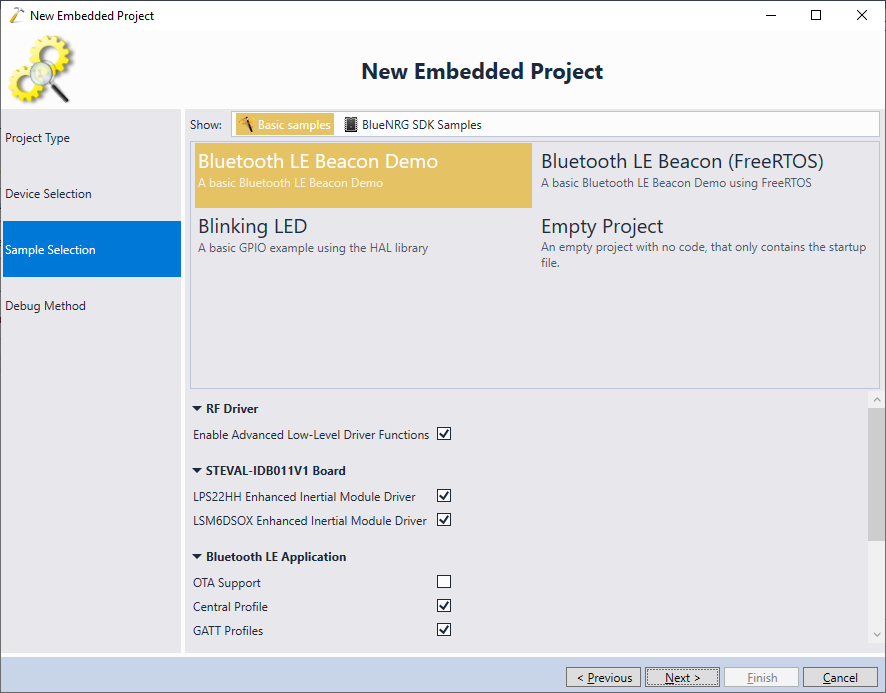
- The next page allows selecting a project sample to clone. Both basic samples and BlueNRG SDK samples are using the embedded framework system and can be easily reconfigured later. Hence, you can select either of them:
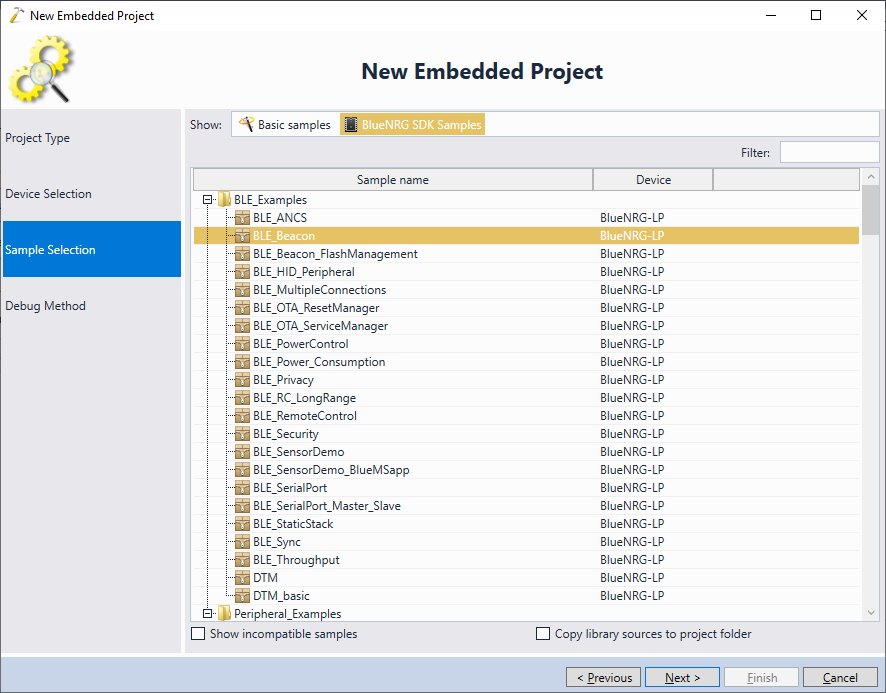
- In this tutorial we will select the BLE_Beacon sample from BlueNRG SDK Samples:
- The last page of the wizard allows configuring debug settings. Unlike most development boards from ST, the BlueNRG-LP board has an on-board CMSIS-DAP instead of an ST-Link. Connect it to the USB port an make sure VisualGDB recognizes it:
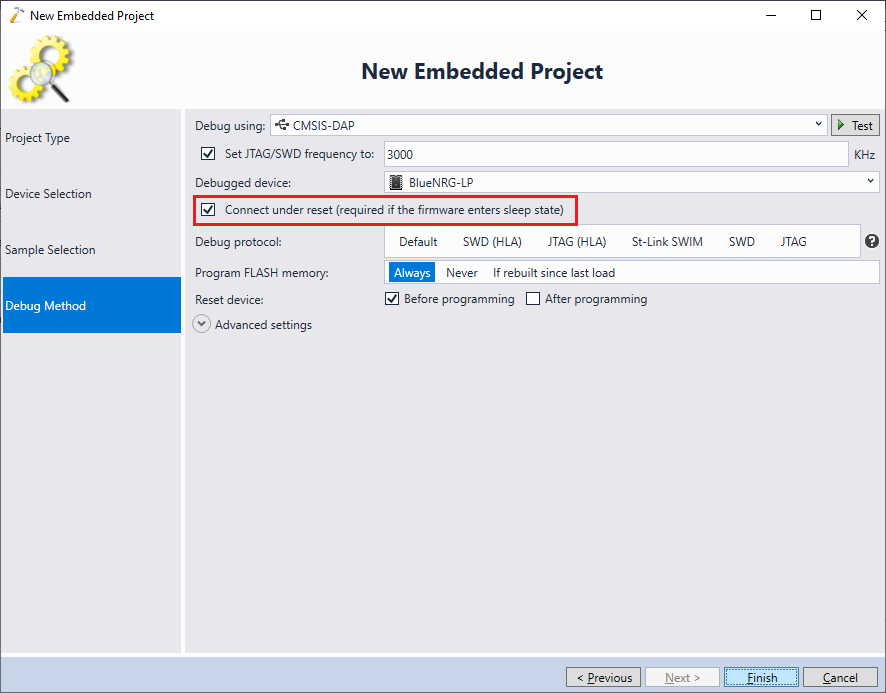 WARNING! Many BlueNRG-LP examples put the device into the low power mode where it is not debuggable. If this happens, you would not be able to connect toe the device unless you enable the “Connect under reset” checkbox in Debug Settings.
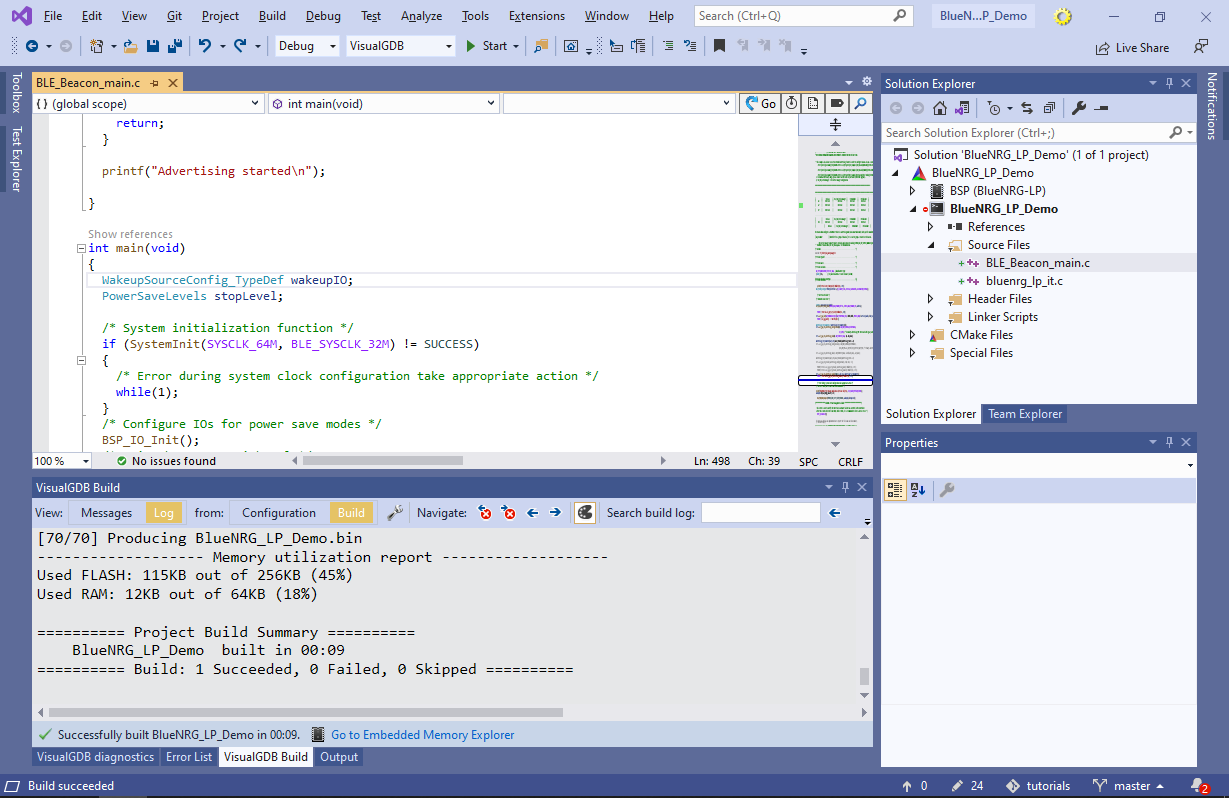
 - Press “Finish” to generate the project. Once it is generated, build it by pressing “Ctrl-Shift-B”:
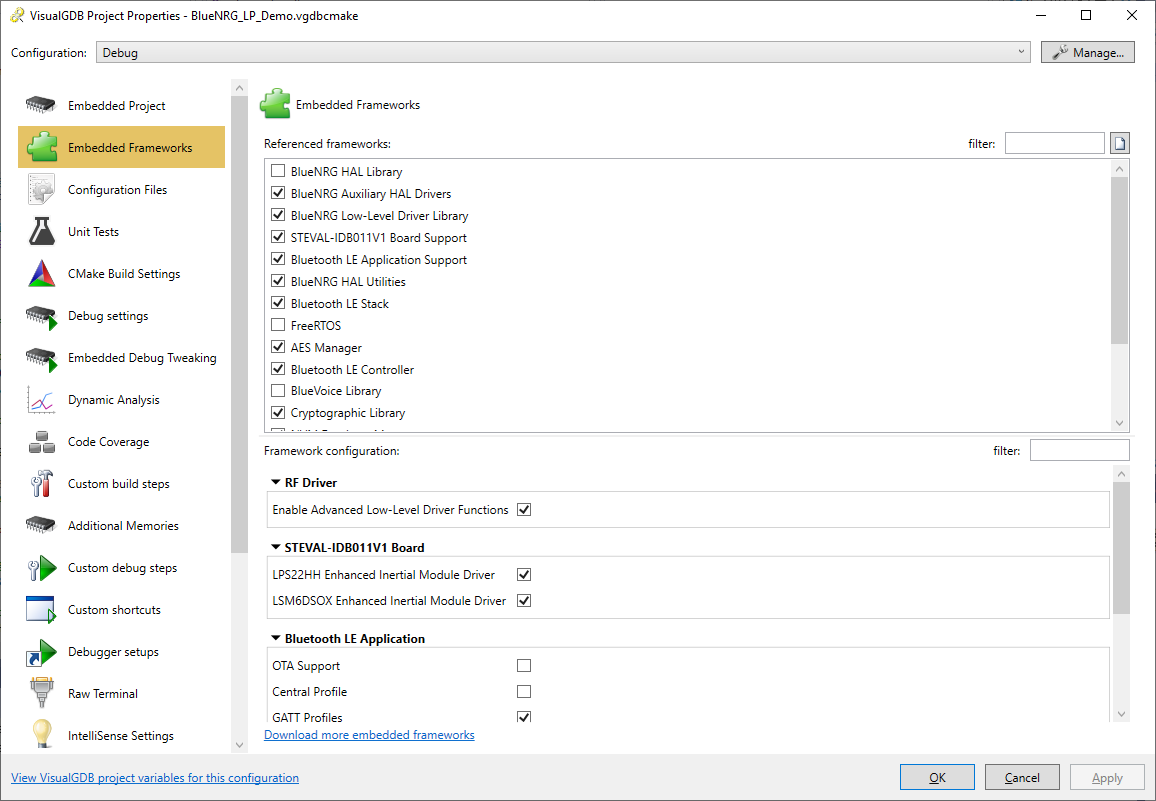
- Right-click on the project in Solution Explorer and go to the Embedded Frameworks page. VisualGDB will display various frameworks from the SDK, allowing you to reference them or change their configuration. The frameworks used by the sample will be already selected:
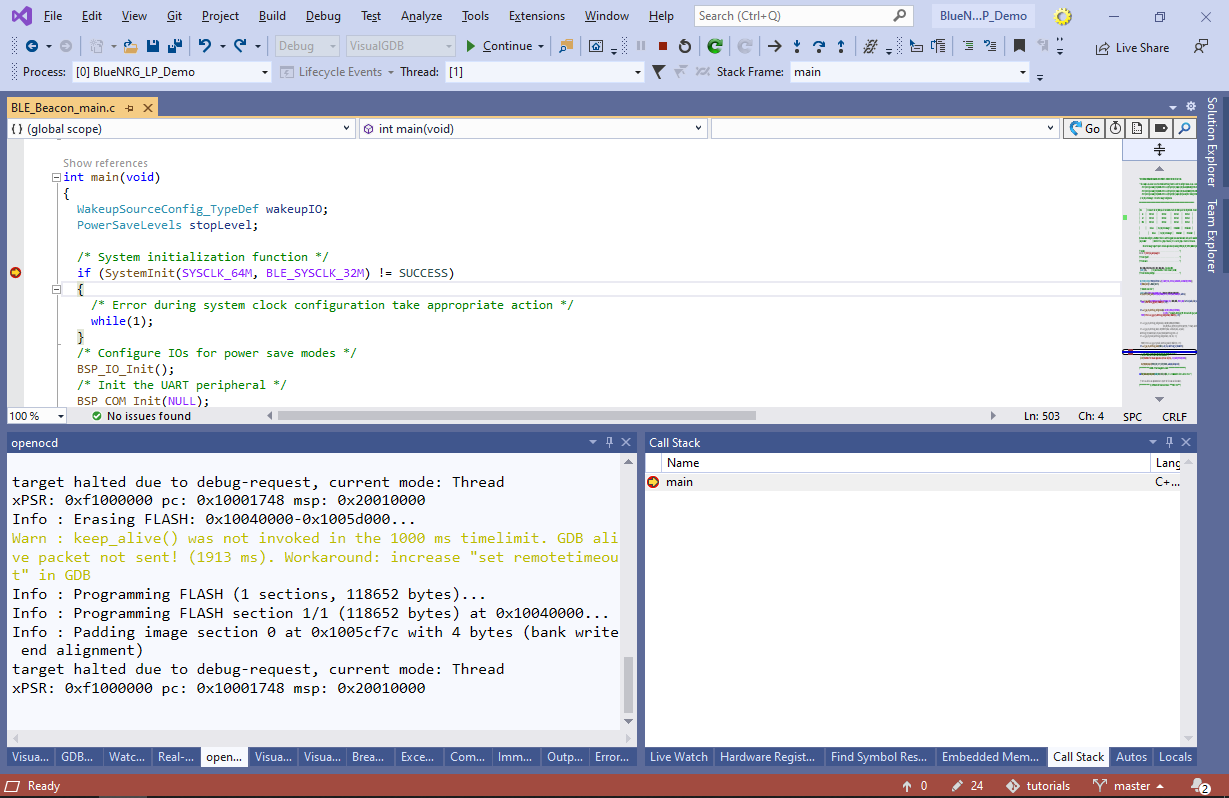
- Set a breakpoint in main() and press F5 to start debugging. The breakpoint will hit:
- Note that if you continue the execution now, OpenOCD will display the “Error connecting DP: cannot read IDR” error:

- This happens because the device has entered the low-power mode. You can comment out the call to HAL_PWR_MNGR_Request() to prevent this from happening. Now you will be able to debug the program without interruptions:

- As of June 2021, the on-board CMSIS-DAP probe sometimes fails to connect to the target right after it has been started. VisualGDB would then display a message that OpenOCD has exited. Simply starting the debug session again solves the problem in most cases.