Embedded/Live Code Coverage
This page describes the Code Coverage support for embedded projects.
Contents
Overview
Implementation
Code Coverage Reports
Live Coverage
Differential Coverage
CMake Projects
MSBuild Projects
GNU Make Projects
Nordic nRF5x Devices
Limitations
Overview
Embedded Code Coverage allows viewing the paths of the code that were executed during a debug session. E.g. the example below shows how the code managed to successfully initialize and start the USB device, but the VCP_read() function never returned 1 and the subsequent VCP_write() calls were never executed: 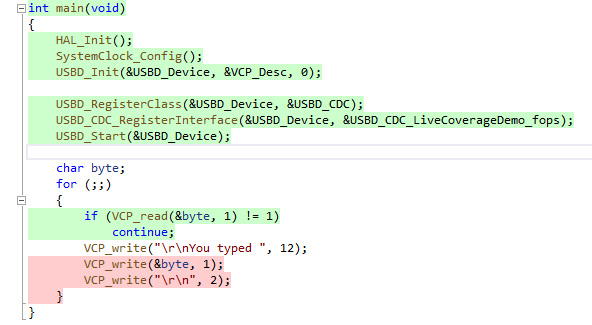 Code coverage is typically used in unit tests to see what code paths were covered by the test, however for embedded projects it has two additional uses:
- Observing what parts of the program are running right now without stopping it in the debugger (Live Coverage)
- Quickly checking the path taken by a long function, or an interrupt handler without stepping through it (Differential coverage)
Code Coverage is supported by VisualGDB Custom Edition or higher and can be enabled via the Code Coverage page of VisualGDB Project Properties: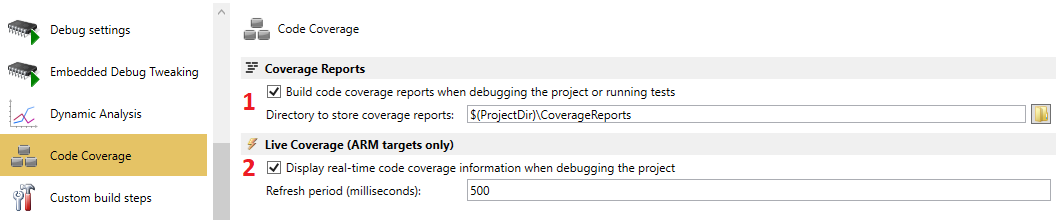 Note that code coverage reports (1) can be enabled separately from Live Coverage (2).
WARNING: After you enable code coverage via VisualGDB Project Properties, the project settings will be changed to instrument the code for coverage. Disabling code coverage here will keep the instrumentation enabled. See the project-specific sections of CMake, MSBuild or GNU Make for details on disabling it.
Embedded Code Coverage is supported by CMake, MSBuild and GNU Make-based projects, as well as mbed projects. It is only supported when using the GCC compiler (not Keil or IAR) and it is not supported for ESP-IDF projects, Arduino projects or other projects where VisualGDB does not fully control the build process.
Implementation
The code coverage for Embedded projects does not require any tracing hardware (live tracing with Segger J-Trace works separately from Live Coverage). It works by instrumenting the code to keep track of every taken branch, resulting in performance overhead and a considerable memory overhead. You can assess the overhead by comparing the instrumented and non-instrumented build of your project in Embedded Memory Explorer: You can reduce the overhead by limiting the instrumentation to a select set of files. See the project-specific sections of CMake, MSBuild or GNU Make for details.
Live Coverage is implemented by continuously reading the branch counters while the program is running, so it requires the target to support background memory reads. Most ARM Cortex devices and RISC-V devices support this functionality.
Code Coverage Reports
You can enable the generation of code coverage reports via VisualGDB Project Properties -> Code Coverage: If the report generation is enabled, each time a debug session is ended, VisualGDB will save the code coverage results in a .scovreport file in the specified directory. Normally, VisualGDB will only keep the 5 most recent coverage reports for each projects, deleting the older ones automatically. You can change this setting via Tools->Options->VisualGDB->General->Profiling->Max. coverage reports per project.
You can also configure VisualGDB to keep the original .gcda files produced by GCOV via the Tools->Options->VisualGDB->General->Profiling->Keep raw coverage reports setting.
Coverage reports can be viewed via Test->VisualGDB Code Coverage Reports: Below is the summary of the controls in the Code Coverage window:
- Normally, the code coverage window will show the report for the last debugged project. If the solution contains multiple projects, you can select a specific one via the project selector (1).
- You can switch between the recent coverage reports via the report selector (2).
- You can delete old reports via the ‘delete’ button in the drop-down list (3). VisualGDB will also delete the old reports automatically according to the Tools->Options->VisualGDB->General->Profiling->Max. coverage reports per project setting.
- The refresh button (4) allows updating the list of reports for a project, in case one was produced outside Visual Studio.
- The coverage highlight button (5) enables highlighting of source code lines based on whether they were covered or not. This only works when using Clang IntelliSense.
- System Symbol Filter (6) allows hiding irrelevant symbols from system directories. You can right-click on any symbol in the Code Coverage window to mark its location as a system directory, and hide any other symbols from that directory as well. System directories are stored in the SystemDirectoryPrefixes element inside the .vgdbsettings file.
- You can sort the functions in the Code Coverage view by name, declaring file, number of invocations and coverage by clicking on the corresponding headers in the list view (7).
You can read the coverage reports programmatically by referencing the VisualGDBCore.dll assembly from the VisualGDB directory and using the CoverageReportReader class. See this file for a brief example of reading .scovreport files.
Live Coverage
Live Coverage can display the branches of code taken in real time. It can be enabled via VisualGDB Project Properties -> Code Coverage and works independently from the coverage reports: Enabling Live Coverage also enables the Differential Coverage (Recent Lines).
Once Live Coverage is enabled, you can view it via the Debug->Windows->Live Tracing/Coverage command while the project is running: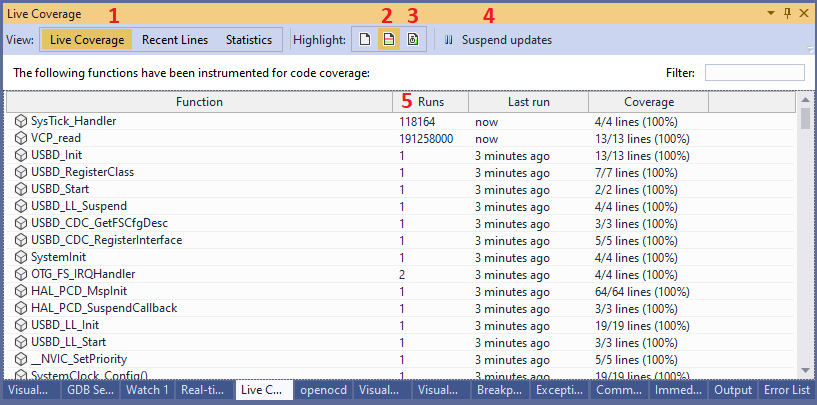 Below is the summary of the Live Coverage controls:
- The View switch allows selecting the Live Coverage view (1), differential coverage (Recent Lines) and Statistics view.
- The Highlight Mode switch allows either showing whether a particular line is covered (2), or showing how recent a line was executed (3).
- If continuously sampling the branch counters interferes with other debugging functionality (e.g. makes Live Watch slower), you can suspend it using the suspend button (4).
- You can sort the contents of the Live Coverage window by function name, number of runs, or the last time it ran by clicking on the corresponding headers (5).
Highlighting the recently executed lines allows observing the code running in real time without actually stopping it in the debugger. The functions executed within the specified interval will be shown with a more intense color: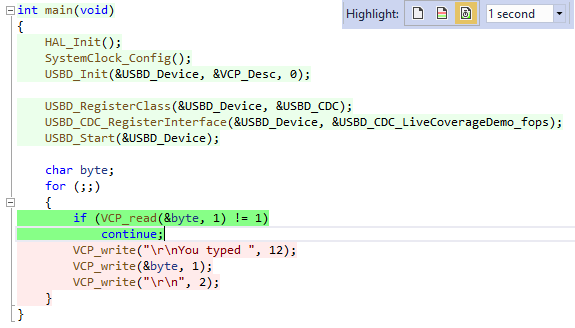
Differential Coverage
Differential Coverage is a special type of Live Coverage. It works by comparing the coverage snapshots before and after a step (or between 2 breakpoints):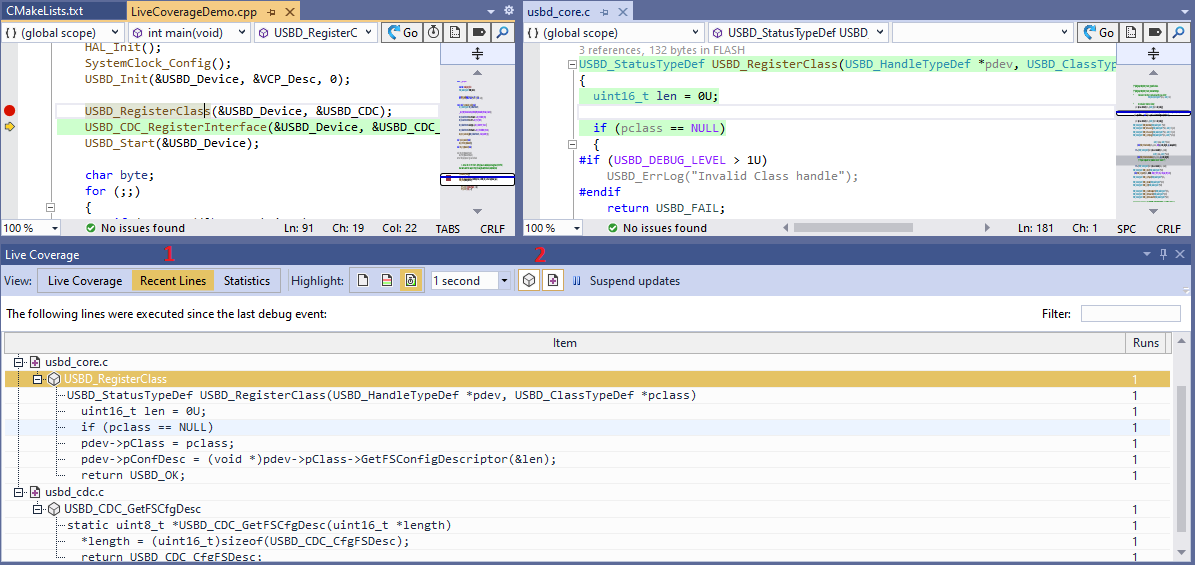 It is enabled by switching the Live Coverage view to Recent Lines (1) and either stepping over a function call, or resuming and waiting for another breakpoint to hit. VisualGDB will then display all lines that changed their run counts since the last event. You can further group them by symbol or file (2).
Differential coverage is useful if stepping through a large failing function is impractical (e.g. due to high stepping latency) and gives a good overview of what happened since the last debug event.
Instrumentation – CMake Projects
CMake projects offer the best GUI for controlling which files should be instrumented for live coverage.
In order to instrument a project for coverage, you first need to enable the instrumentation of the corresponding BSP (1) by opening its properties on the Code Coverage page (2).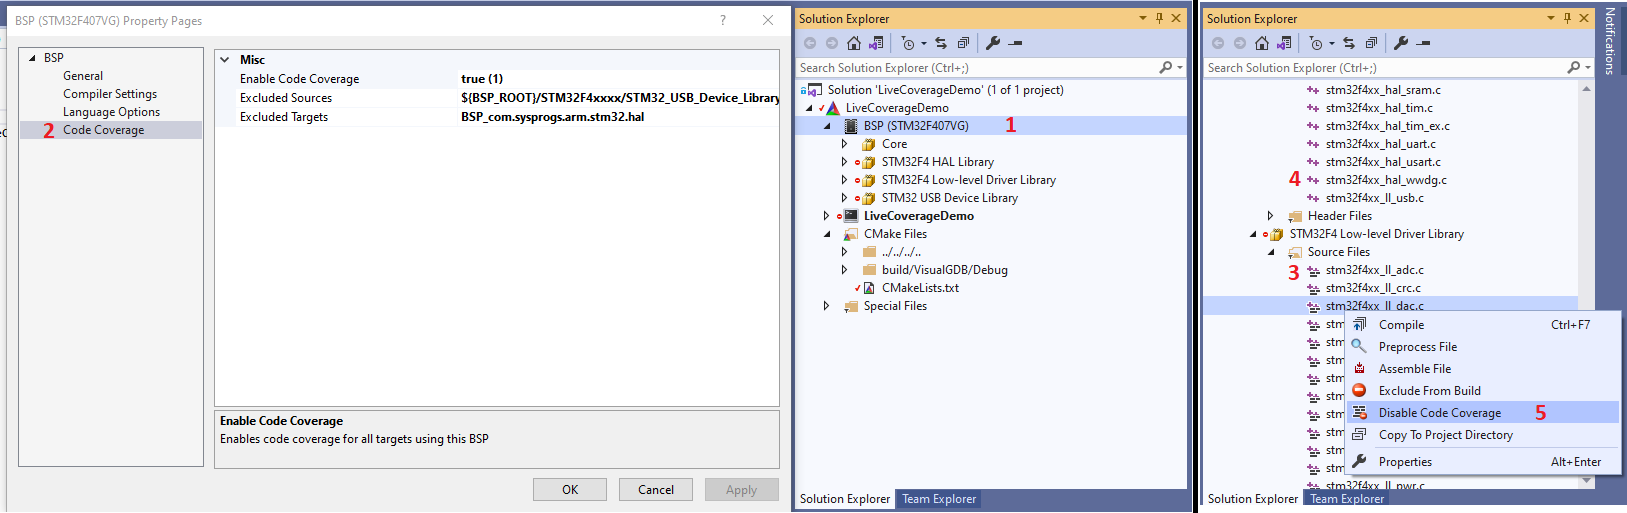 Once the instrumentation is enabled, VisualGDB will show the “coverage” overlay on top of the file icon for the instrumented files (3). Non-instrumented files will retain the regular icon (4). You can enable or disable coverage for individual files or frameworks via a context menu in Solution Explorer (5).
Changing any of the instrumentation settings will insert/update the bsp_configure_code_coverage() statement in your CMakeLists.txt. E.g.:
bsp_configure_code_coverage(ENABLED 1 EXCLUDE_TARGETS BSP_com.sysprogs.arm.stm32.hal EXCLUDE_FILES ${BSP_ROOT}/STM32F4xxxx/STM32_USB_Device_Library/Core/Src/usbd_ctlreq.c) |
WARNING: Enabling code coverage via VisualGDB Project Properties will automatically enable code instrumentation, however disabling it will keep the code instrumentation settings unchanged. In order to disable instrumentation, simply comment out the bsp_configure_code_coverage() statement in CMakeLists.txt.
If you would like to quickly switch between instrumented and non-instrumented variants of the project, consider using the if() statement together with the configuration/platform GUI to create special configurations or platforms for instrumenting the code for code coverage.
Instrumentation – MSBuild Projects
MSBuild projects rely on the regular Visual Studio property system, so controlling the instrumentation is slightly less straight-forward than for CMake projects. First of all, the instrumentation always needs to be enabled for the project globally via Configuration properties -> Embedded Project -> Instrument Code for Code Coverage: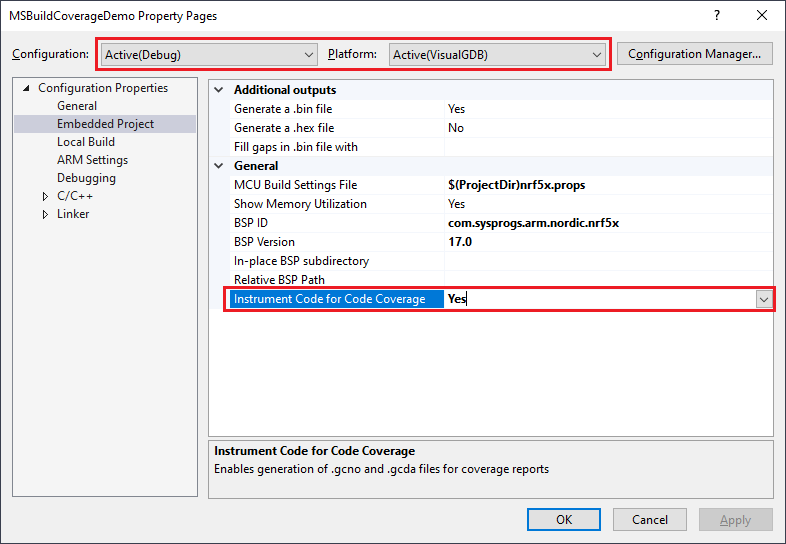 Note that this setting is stored separately for each configuration/platform. Always double-check that the edited configuration platform matches the one you intend to edit, as Visual Studio sometimes displays settings for an unexpected configuration.
Once you have enabled the instrumentation globally, it will be automatically enabled on the compiler level (C/C++ -> Instrumentation -> Generate Code Coverage Reports):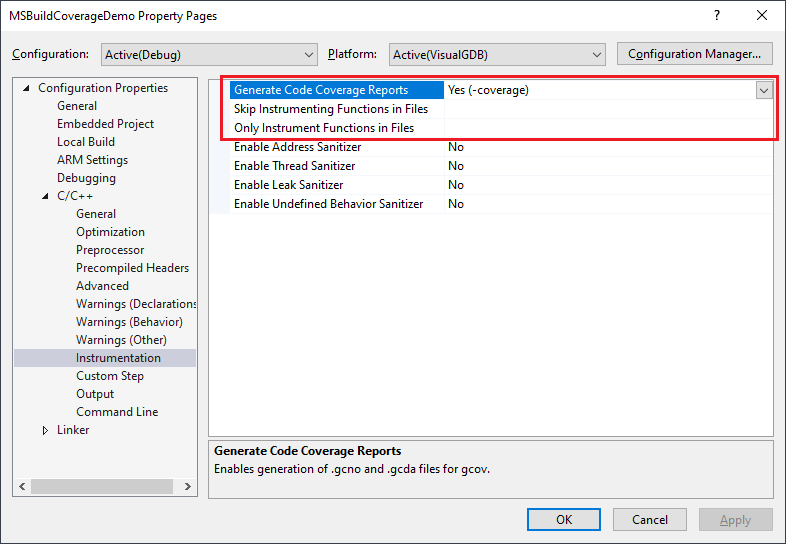 Normally, you do not need to change the setting under C/C++->Instrumentation, as its default value depends on the global setting. However, you can explicitly set it No for individual files that you do not wish to be instrumented (select these files in Solution Explorer and open Properties in context menu to edit file-specific properties).
The table below summarizes the relation between the 2 settings:
| Embedded Project->Instrumentation | C/C++ -> Instrumentation | Intended use | Effects |
| No | Default (No) | Not instrumenting code | Code coverage completely disabled |
| No | Yes | Do not use | Files will be instrumented by GCC, but not optimized for embedded projects by VisualGDB. The project will likely not link. |
| Yes | Default (Yes) | Instrumenting code | Code coverage working as intended |
| Yes | “Default (Yes)” for project. “No” for specific files. |
Excluding specific files | The files overriding the option will not be instrumented. The rest of the project will be. |
| Yes | “No” for project. “Yes” for specific files. |
Only instrumenting specific files | The files overriding the option will be instrumented. The rest of the project will not be. |
| Yes | No | Do not use | Will have the same effect as disabling the other setting, although could be confusing as the other setting will be set to “Yes”. |
Note that setting per-file settings works on the translation unit level (e.g. affects a .c/.cpp file and all header files used by it). If you would like to control instrumentation for individual header files, you can use the “Skip instrumenting function in files” and “Only instrument functions in files” options. They correspond to the and -fprofile-exclude-files and -fprofile-filter-files GCC switches respectively.
WARNING: Enabling code coverage via VisualGDB Project Properties will automatically enable code instrumentation, however disabling it will keep the code instrumentation settings unchanged. In order to disable instrumentation, simply set the Embedded Project -> Instrument Code for Code Coverage option to No.
If you would like to quickly switch between instrumented and non-instrumented variants of the project, consider creating separate MSBuild configurations for instrumented and non-instrumented builds.
Instrumentation – GNU Make Projects
We do not recommend creating new projects using GNU Make, since it is extremely limited in comparison to Advanced CMake and MSBuild. If you absolutely have to use embedded code coverage with GNU Make, you need to explicitly enable it by adding “–coverage” to VisualGDB Project Properties -> Makefile Settings -> Common flags: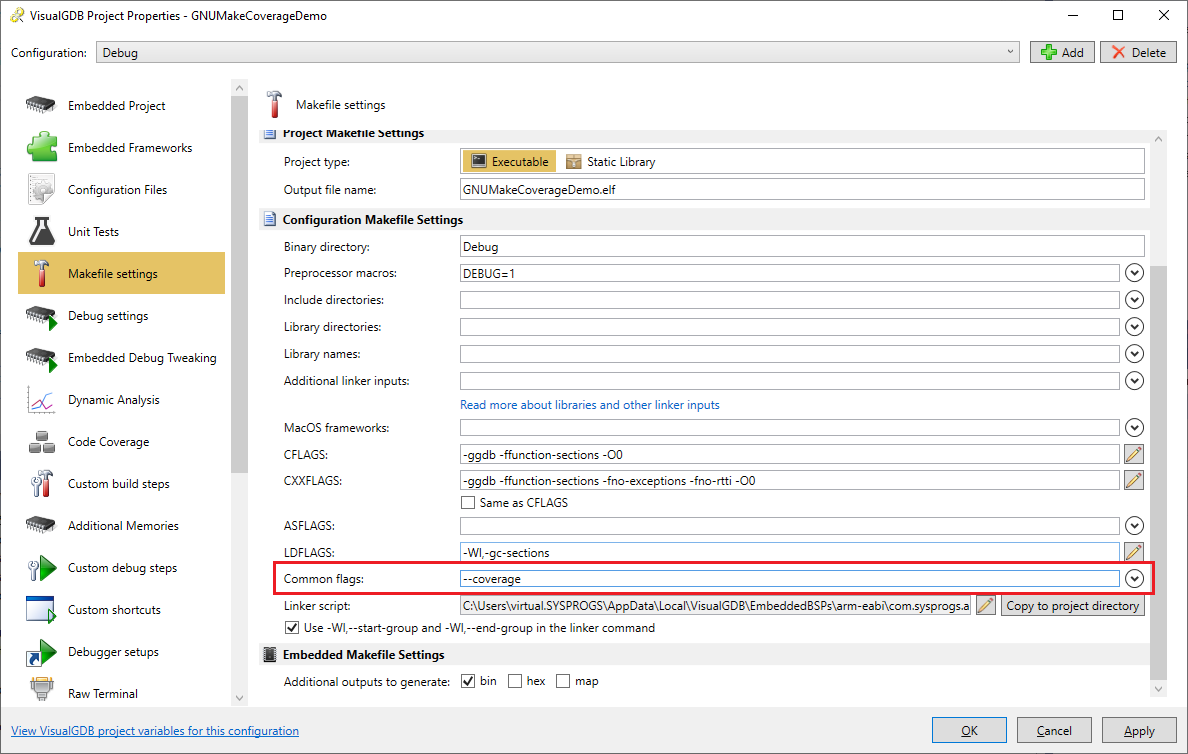 The configuration-specific Makefile (e.g. debug.mak) should also set the DETACH_CODE_COVERAGE variable to 1, e.g.:
COMMONFLAGS := --coverage DETACH_CODE_COVERAGE :=1 |
If you would like to disable code coverage later, simply remove “–coverage” from COMMONFLAGS. You can keep the DETACH_CODE_COVERAGE line, as it will have no effect if no files are actually instrumented.
Nordic NRF5x Devices
The Nordic nRF5x projects include a softdevice that is controlled by the main firmware via system calls. Instrumenting the entire nRF5x project for coverage breaks this mechanism and results in a hard-to-trace crash: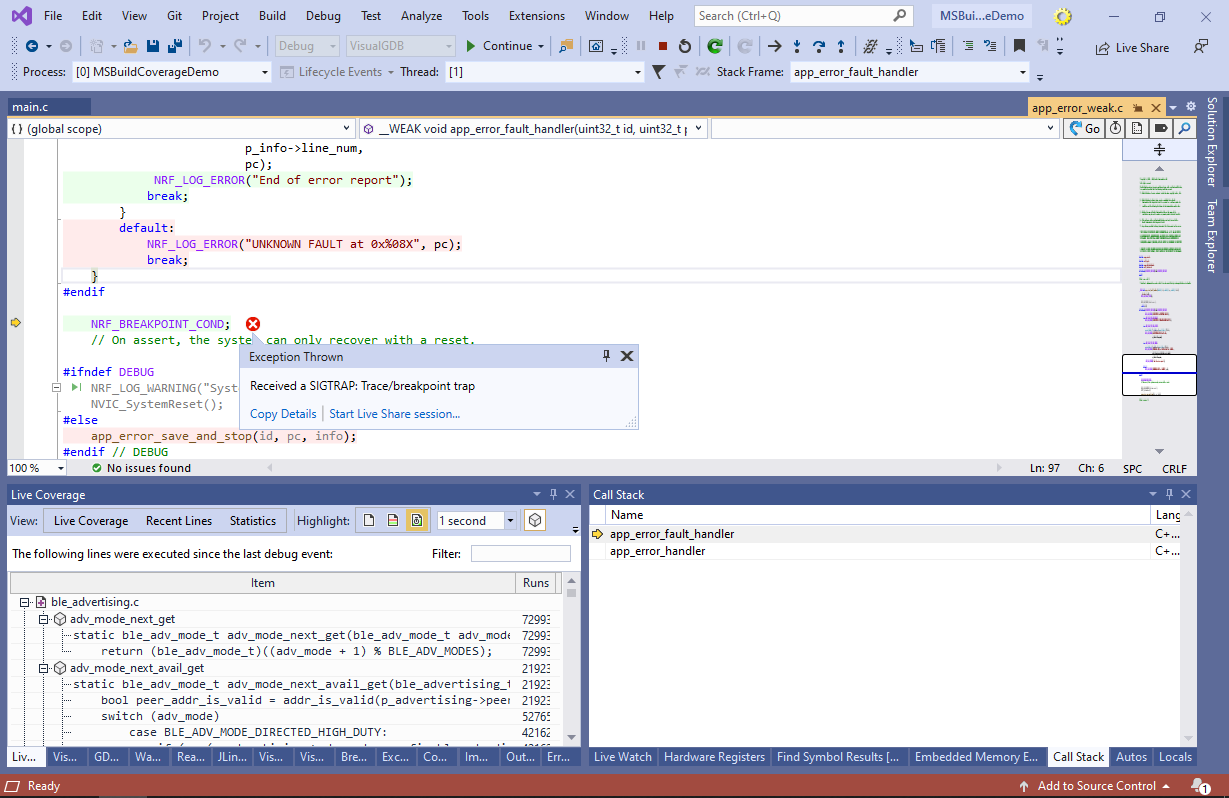 Although the call stack in this case is not very informative, checking the information about the covered lines just before the crash quickly allows pinpoint the root cause:
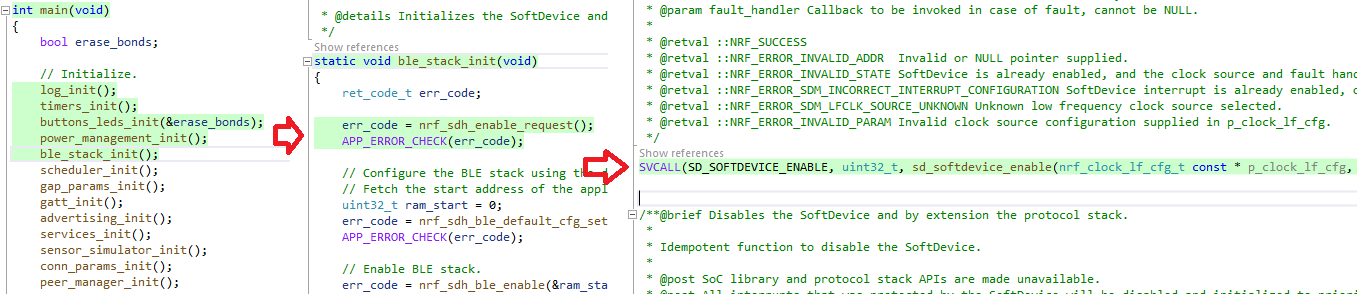 The problem is caused by instrumenting the syscall wrappers generated by the SVCALL() macro. In order to get coverage working, you would need to disable instrumentation for all files using the SVCALL() macro. Use the Find All References command (Shift+F12) to obtain a specific list of files:
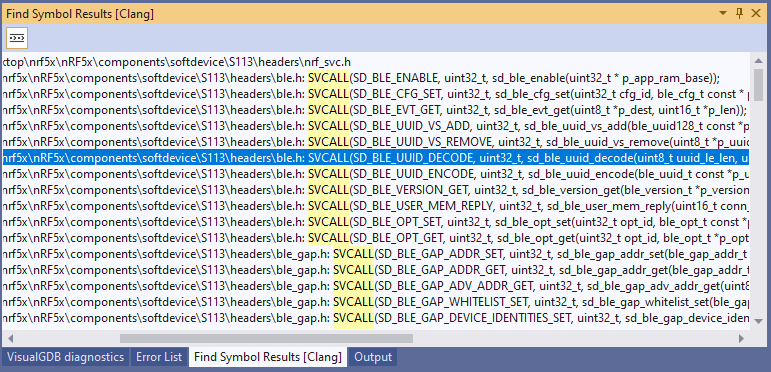 As of SDK v17.0, these files are located under the softdevice directory, so the easiest way to exclude them is to add “softdevice.*\.h” to the “Skip instrumenting functions in files” setting:
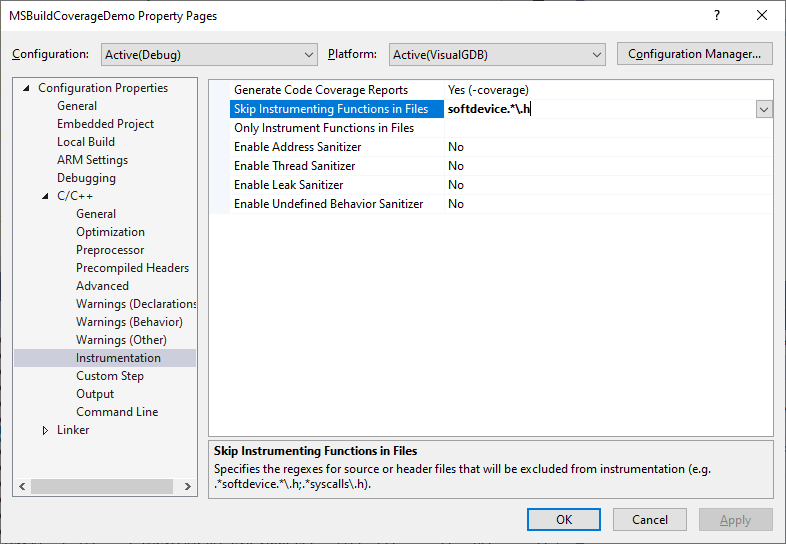 Now you can rebuild the project and confirm that it’s successfully running the idle loop by highlighting the recently executed lines:
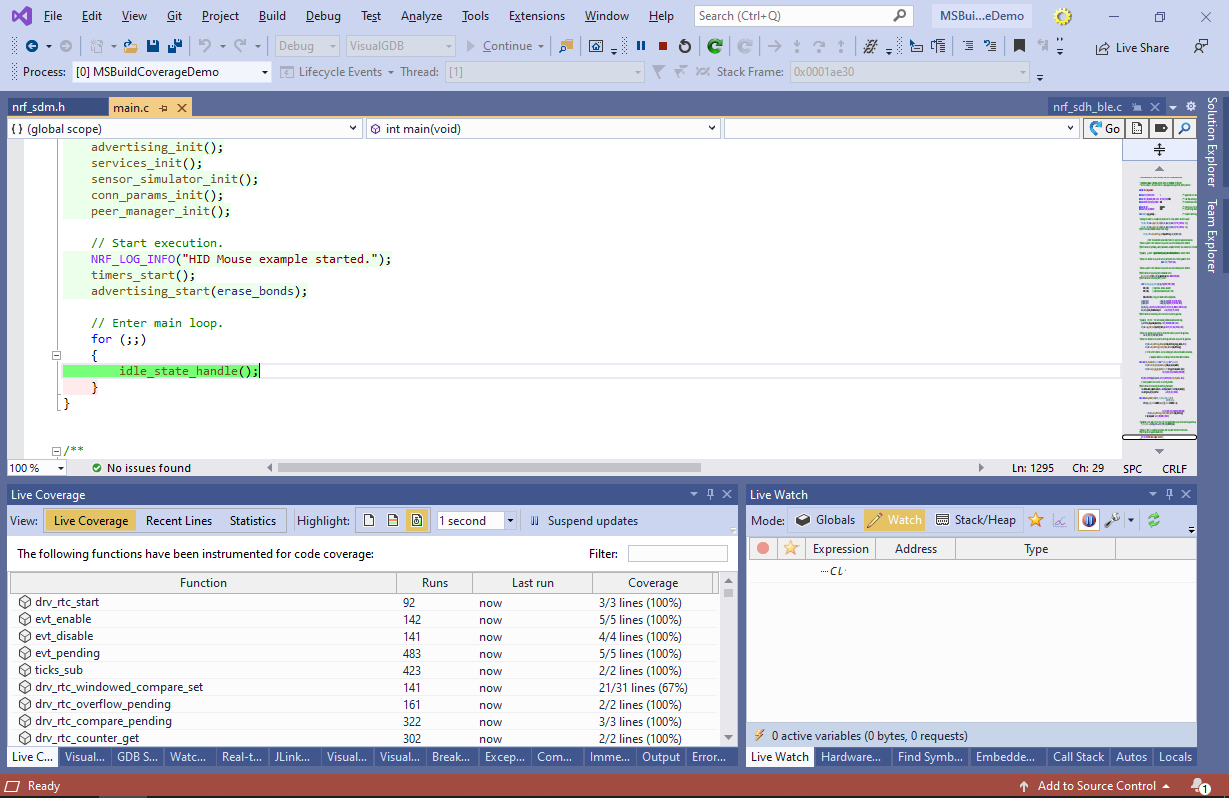
Limitations
Embedded Code Coverage relies on the gcc compiler to instrument the code and on the gcov tool to compute invocation counts for each line and function. This works well for the code that has finished executing, however it can produce inaccurate results for the functions that are running, or are on the call stack at the time of sampling. E.g. stopping the code on the “if()” line (A) can incorrectly mark the rest of the function as covered, while stepping over it into the “return” statement (B) will show that it never got a chance to run: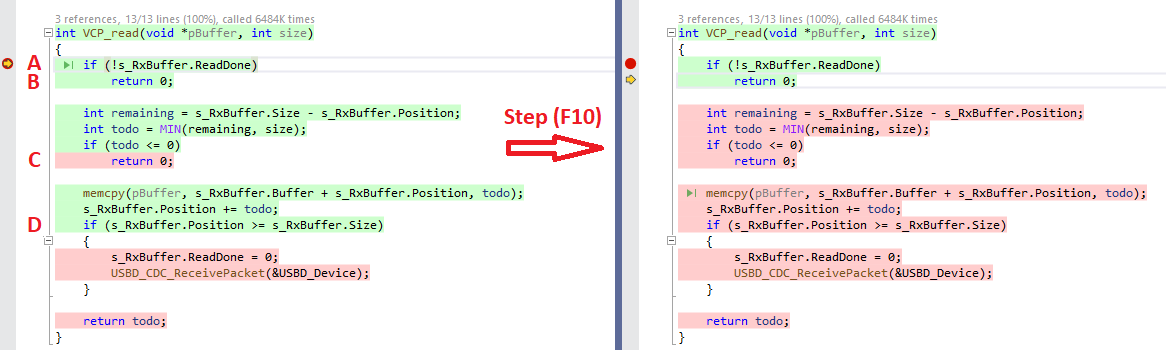
This happens because GCC tries to minimize the amount of branch counters it creates. E.g. in the left example, the function was called X times, the branch leading to line B was taken X-1 times, and the branch leading to line C was never taken. Under normal circumstances, this would mean that the function has reached at least line D. However, in practice, the code is stopped in debugger at line A.
This only affects the functions that are currently running, does not affect the function invocation counters, and gets resolved once the CPU leaves the function (and hence all branch counters will make sense again).
In practice, unless a specific function is running most of the time (e.g. looping while waiting for an interrupt), most of the live coverage samples will be taken while the function is not executing, so the results will be accurate. Inaccurate results computed while the function was running will be rectified next time the live coverage is updated.