Diagnosing Complex Memory Corruption Problems with Segger J-Trace
This tutorial shows how to diagnose complex memory corruption problems using the ARM ETM tracing with VisualGDB and Segger J-Trace.
ETM tracing is a powerful debug technology that allows recording each and every instruction executed by the ARM processor, so you can conveniently step back in time and understand the events that lead to a strange unexpected crash.
In this tutorial we will create a basic FreeRTOS-based program with incompatible floating point settings (leading to a very tough-to-diagnose memory corruption under certain circumstances), will reproduce the problem and then show how to use the tracing functionality with Segger J-Trace to help pinpoint the problem better.
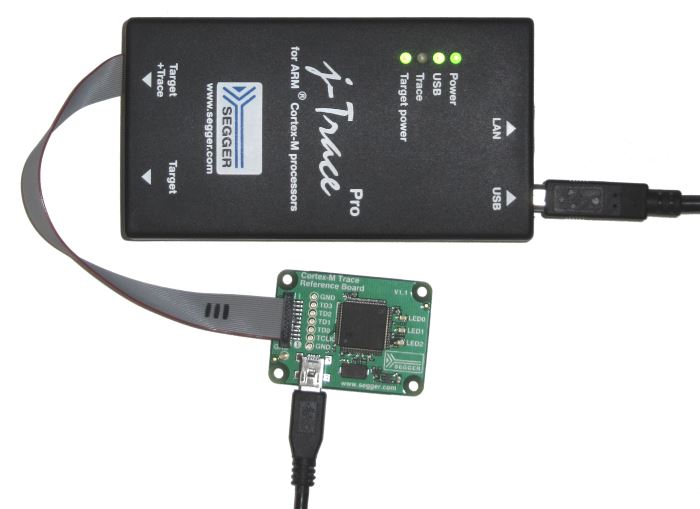
Before you begin, install VisualGDB 5.4 or later and ensure you have a Segger J-Trace Pro and a board with a trace connector (in this tutorial we will use the reference tracing board that comes with the J-Trace).
- Start Visual Studio and open the VisualGDB Embedded Project Wizard:
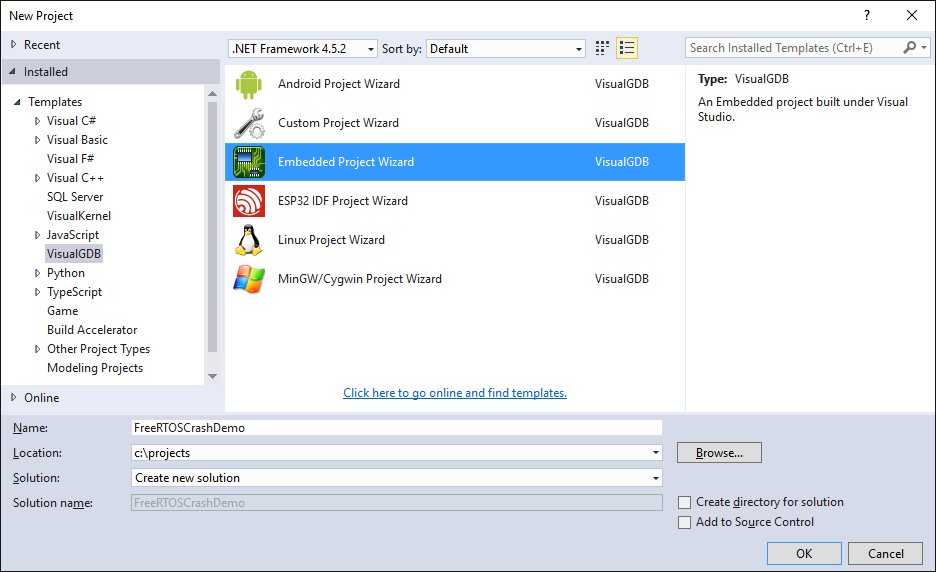
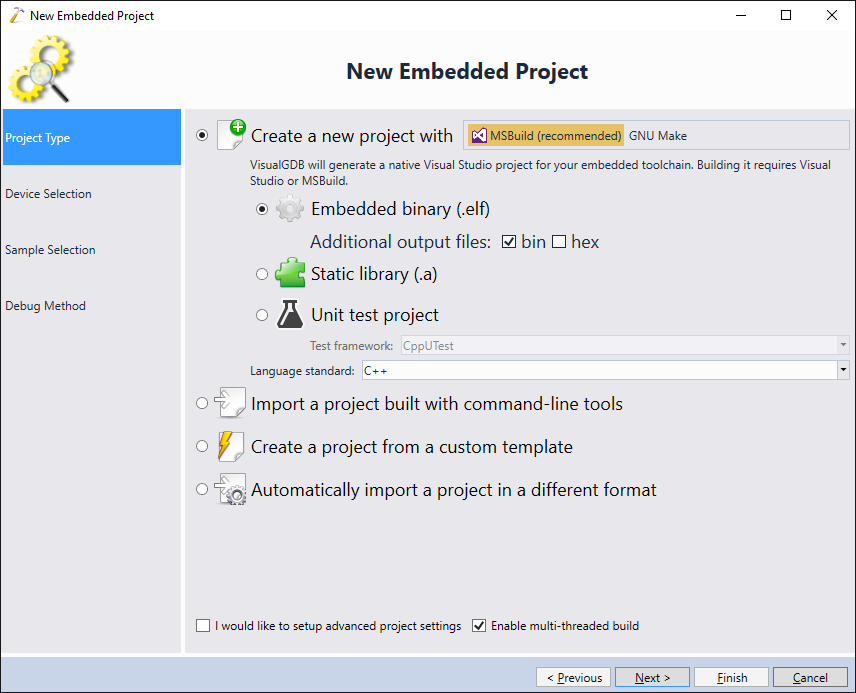
- Select “New Project -> Embedded binary”:
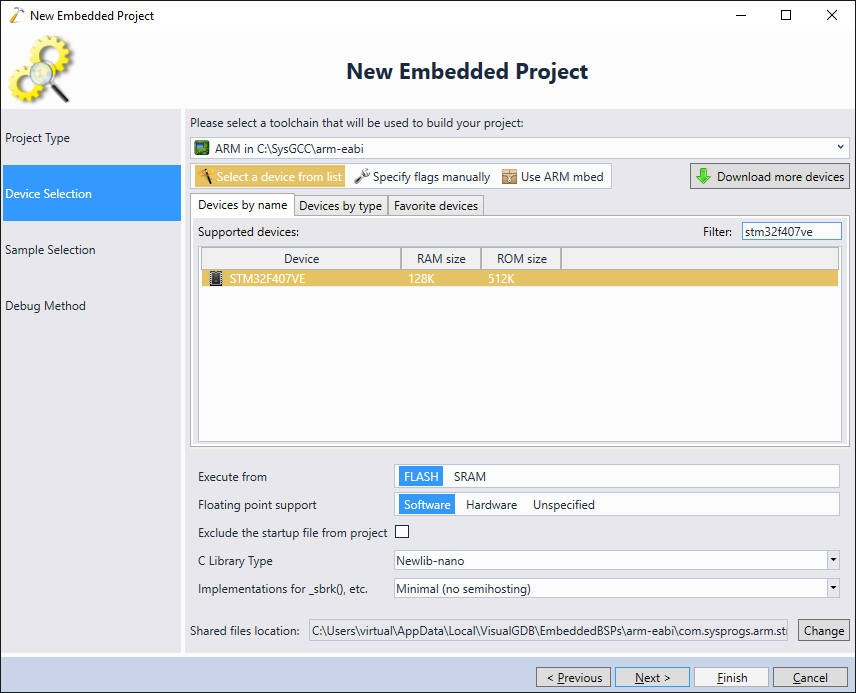
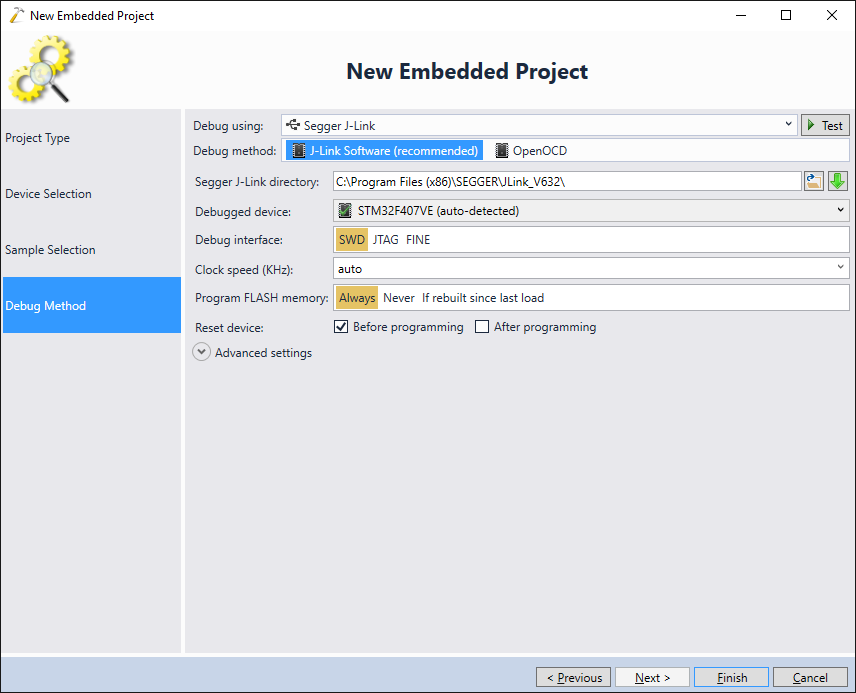
- Pick your toolchain and the device. The reference trace board comes with the STM32F407VE microcontroller, however if you are using a different board, select a device that matches it:
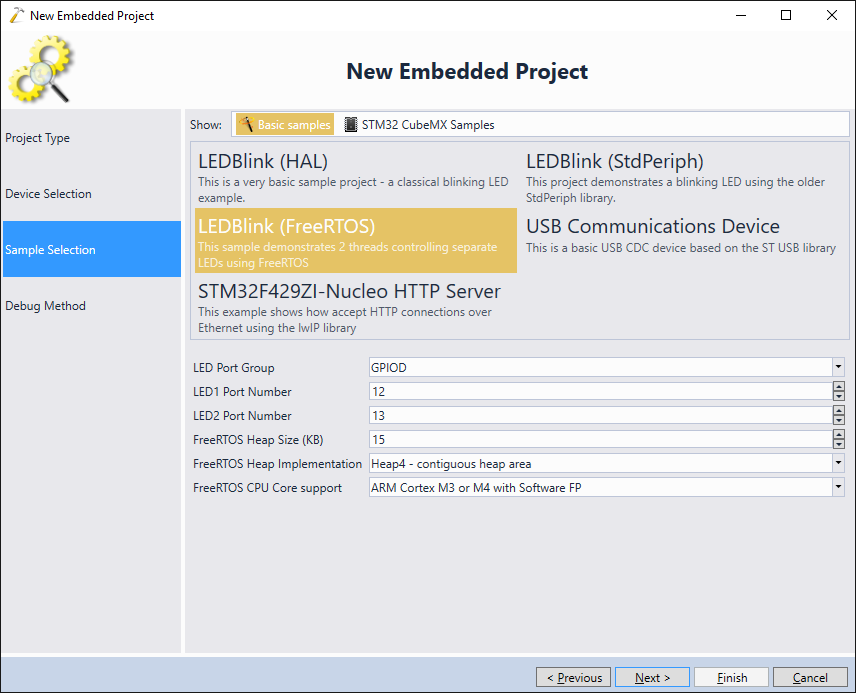
- On the next page select the “LEDBlink (FreeRTOS)” sample. You can try changing the LED numbers to match the Segger board layout, however this is not necessary as we won’t rely on the LEDs in this tutorial:
- Connect your J-Trace to your board and plug both into the USB ports of your computer:
- VisualGDB should automatically recognize the J-Trace (shown as J-Link in the GUI) and pick the correct settings. Ensure you use the Segger software package v6.32 or later, as the previous versions don’t include the functionality used by VisualGDB:
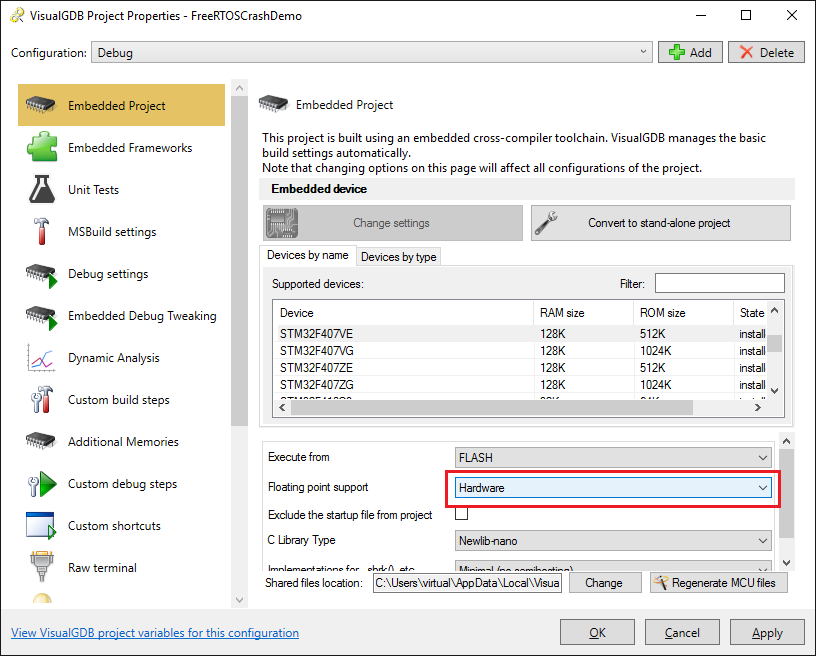
- Press “Finish” to create the project. Now we will introduce the bug. Switch the Floating Point Support setting to Hardware:
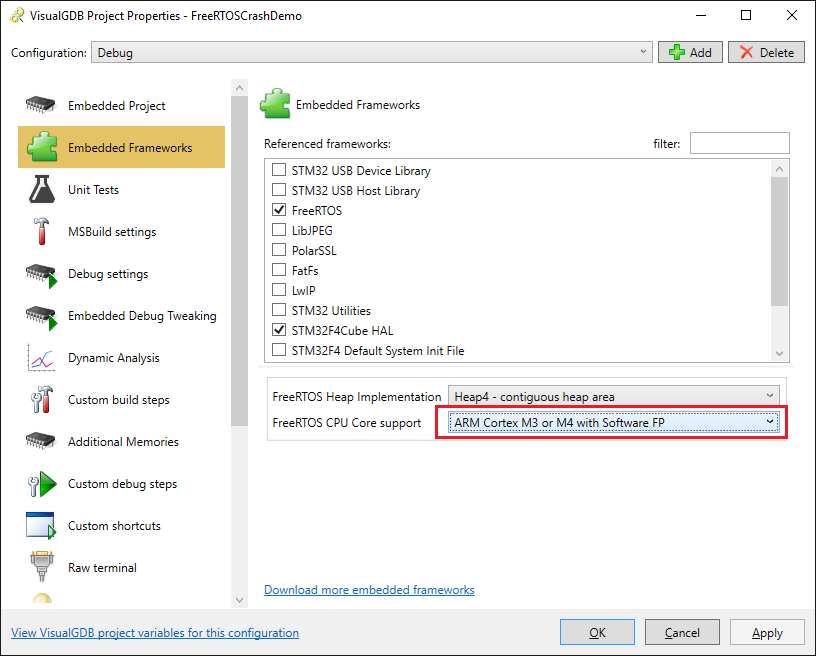
- On the Embedded Frameworks page set the FreeRTOS CPU Core to ARM Cortex M3 or M4 with Software FP:
- Replace the main part of the source file with the following code:
osSemaphoreDef(s_Semaphore);
osSemaphoreId(s_SemaphoreId);

int main(void)
{
    HAL_Init();

    __GPIOD_CLK_ENABLE();
    GPIO_InitTypeDef GPIO_InitStructure;

    GPIO_InitStructure.Pin = GPIO_PIN_12 | GPIO_PIN_13;

    GPIO_InitStructure.Mode = GPIO_MODE_OUTPUT_PP;
    GPIO_InitStructure.Speed = GPIO_SPEED_HIGH;
    GPIO_InitStructure.Pull = GPIO_NOPULL;
    HAL_GPIO_Init(GPIOD, &GPIO_InitStructure);

    /* Thread 1 definition */
    osThreadDef(LED1, LED_Thread1, osPriorityNormal, 0, configMINIMAL_STACK_SIZE);

    /* Thread 2 definition */
    osThreadDef(LED2, LED_Thread2, osPriorityNormal, 0, configMINIMAL_STACK_SIZE);

    /* Start thread 1 */
    LEDThread1Handle = osThreadCreate(osThread(LED1), NULL);

    /* Start thread 2 */
    LEDThread2Handle = osThreadCreate(osThread(LED2), NULL);

    s_SemaphoreId = osSemaphoreCreate(osSemaphore(s_Semaphore), 32);


    /* Start scheduler */
    osKernelStart();

    /* We should never get here as control is now taken by the scheduler */
    for (;;)
        ;
}

void SysTick_Handler(void)
{
    osSystickHandler();
}

#include <math.h>

static void LED_Thread1(void const *argument)
{
    for (;;)
    {
        osDelay(100);

#ifdef CRASH
        volatile float arg = 3.14;
        volatile float result = sinf(arg);
#endif

        osSemaphoreRelease(s_SemaphoreId);
    }
}

static void LED_Thread2(void const *argument)
{
    for (;;)
    {
        osSemaphoreWait(s_SemaphoreId, osWaitForever);
    }
}
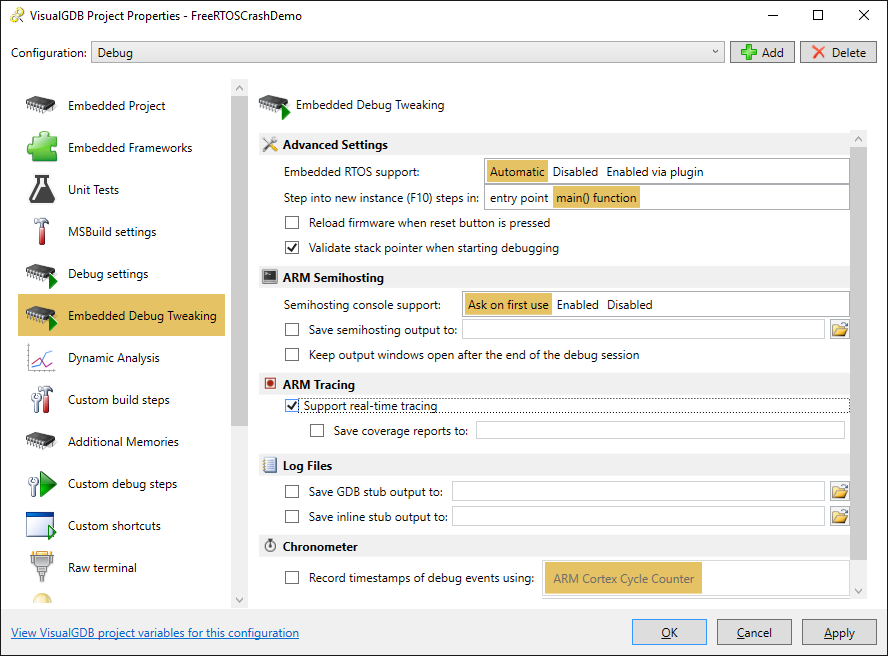
- Open VisualGDB Project Properties and enable real-time tracing to support collecting and analyzing trace data from the CPU:
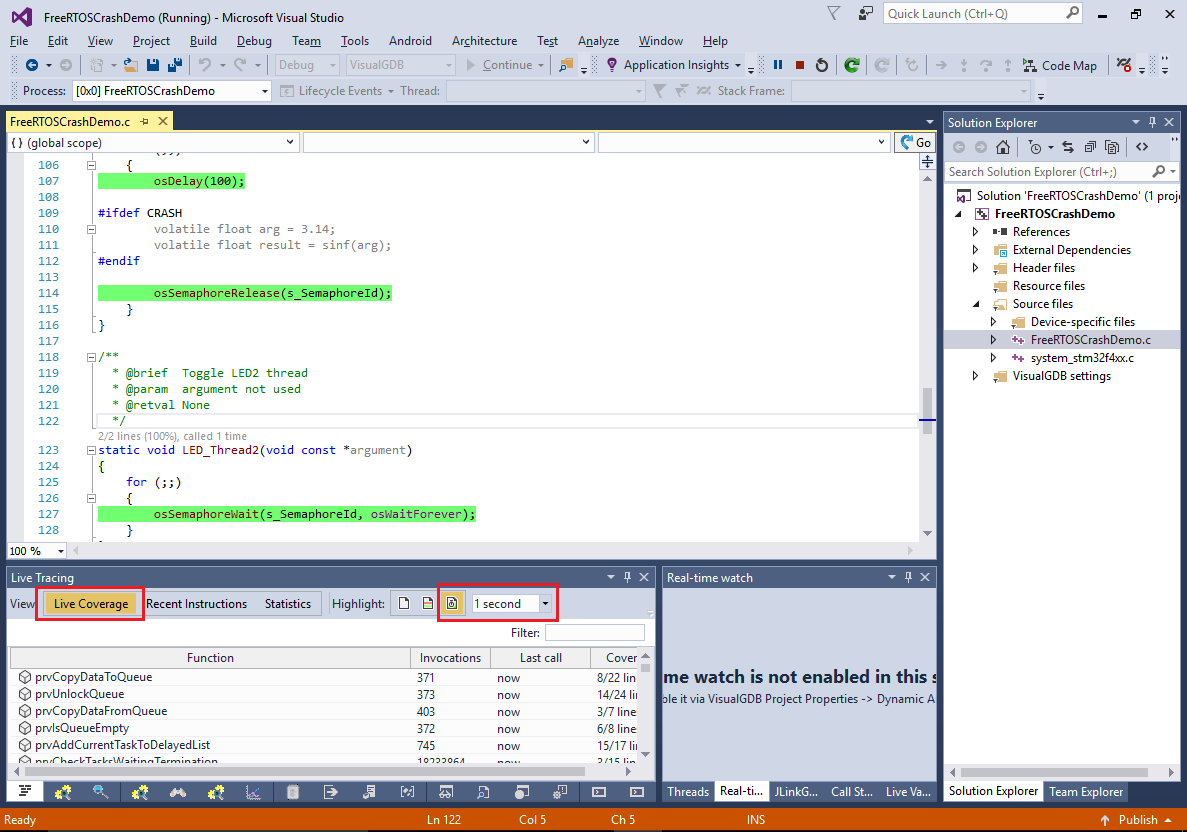
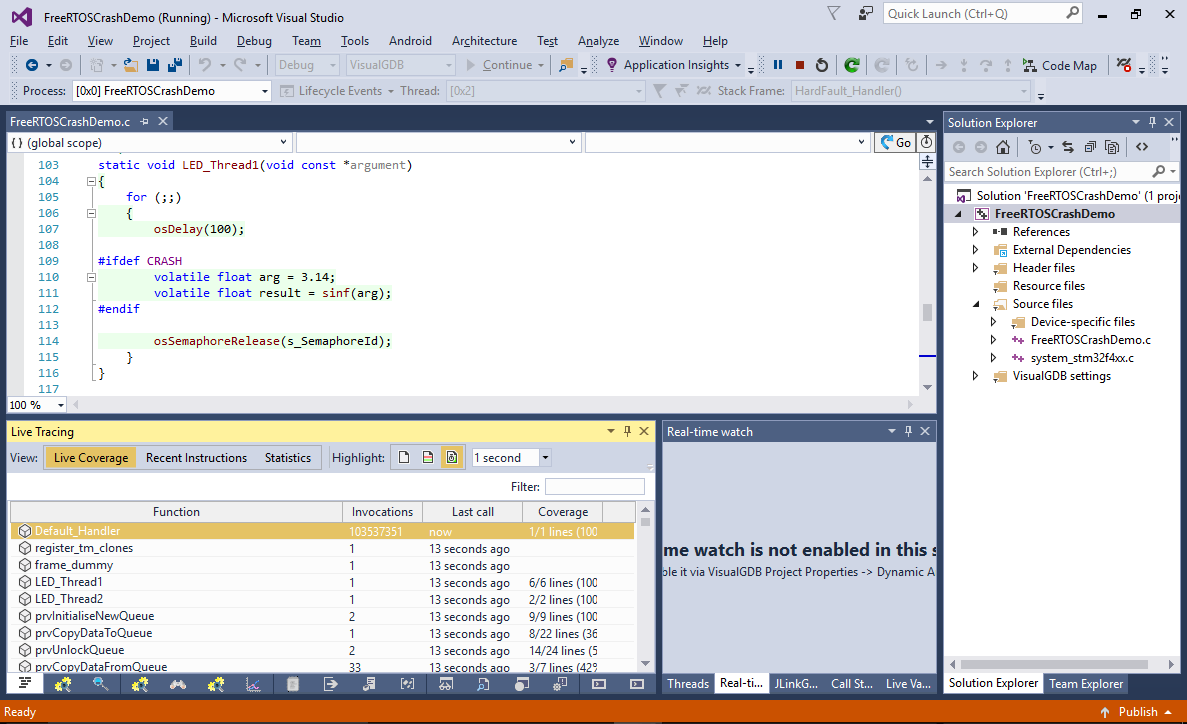
- The current version of the code doesn’t trigger the crash yet and is expected to run normally. Verify this by pressing F5 to build and start the program. The easiest way to see what the program is doing without stopping it is to enable recent code highlighting in the Live Tracing window (although this is not related to the advanced troubleshooting that will be described later):
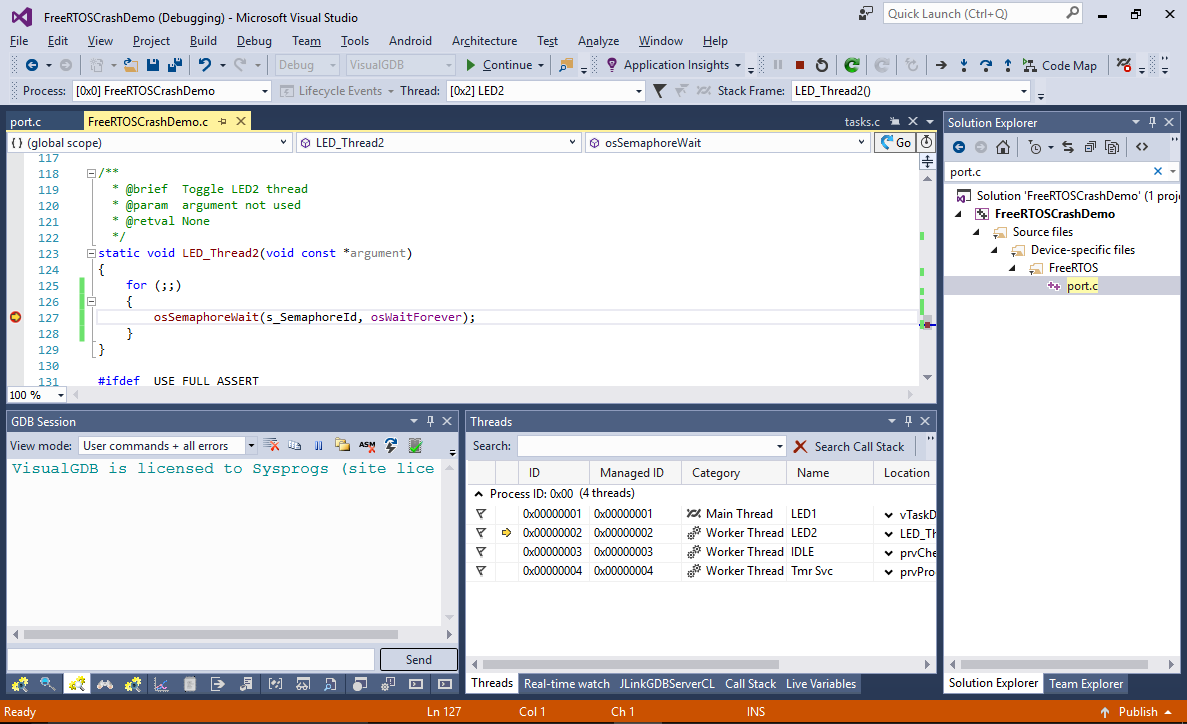
- You can also set a breakpoint in one of the thread functions and wait for it to hit to ensure that the thread is running as expected:
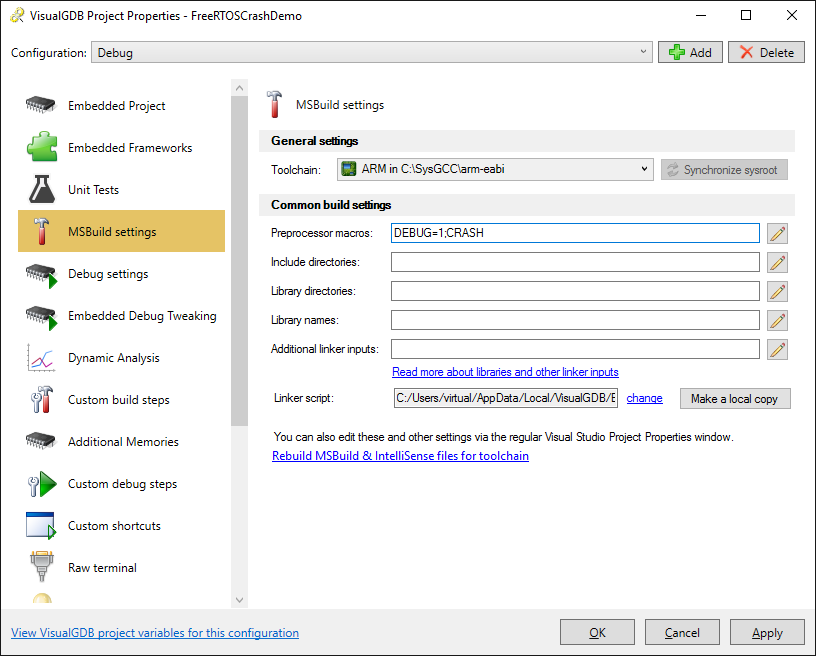
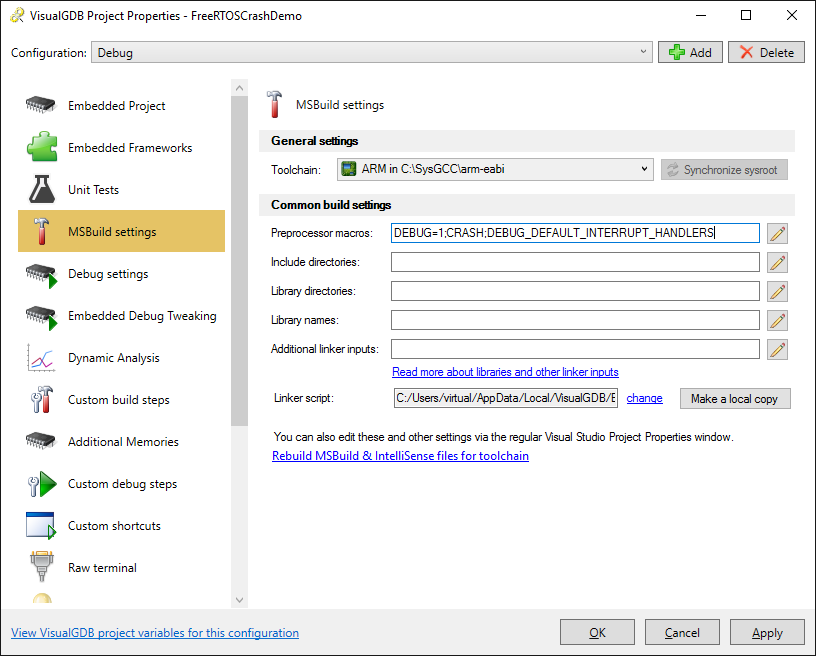
- Now we will trigger the crash. Open VisualGDB Project Properties and add “CRASH” to the “preprocessor macros” session. This will enable the call to sinf() from the LED1 thread:
- Remove all breakpoints, build and run the program again. The Live Coverage view can easily show you that the program is now stuck in the Default_Handler() function and no other code is begin executed:
- Select “Debug->Break All” to stop the program and confirm that it is stuck in the Default_Handler():
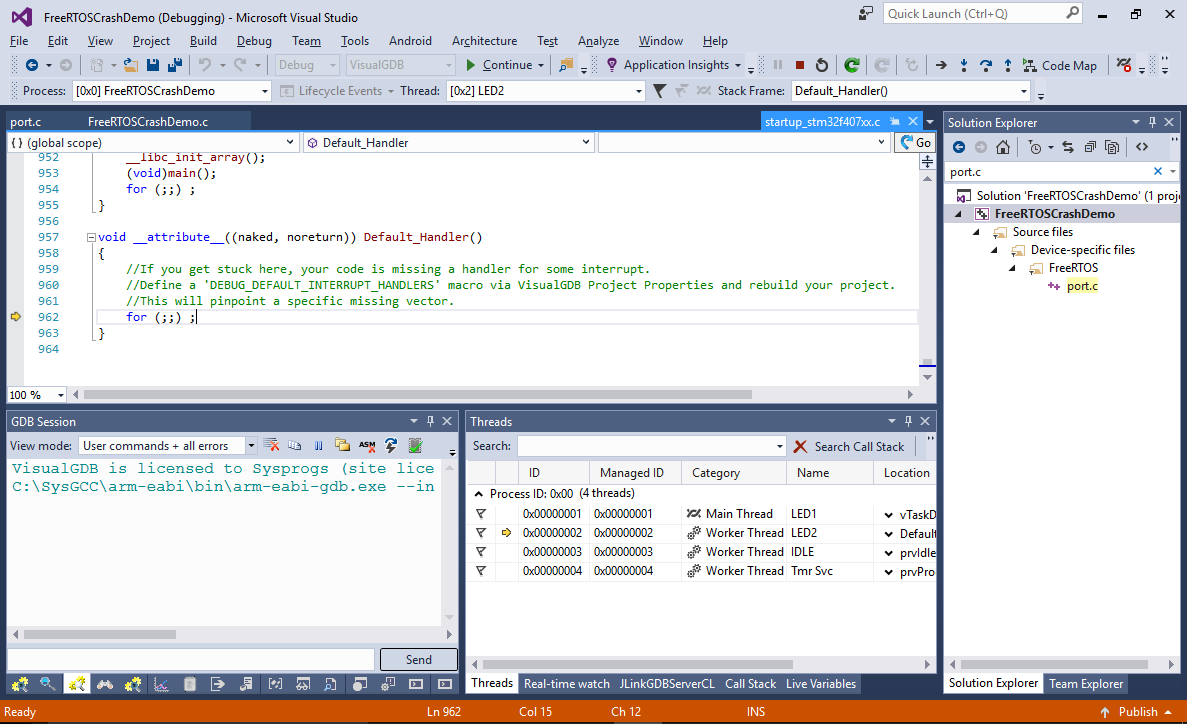
- The Default_Handler() function is shared between all unimplemented interrupt handlers, making it harder to understand which interrupt triggered it. As the comment in the default handler suggests, add “DEBUG_DEFAULT_INTERRUPT_HANDLERS” to Preprocessor Macros to define a separate handler for each unused interrupt (at a slight additional memory cost):
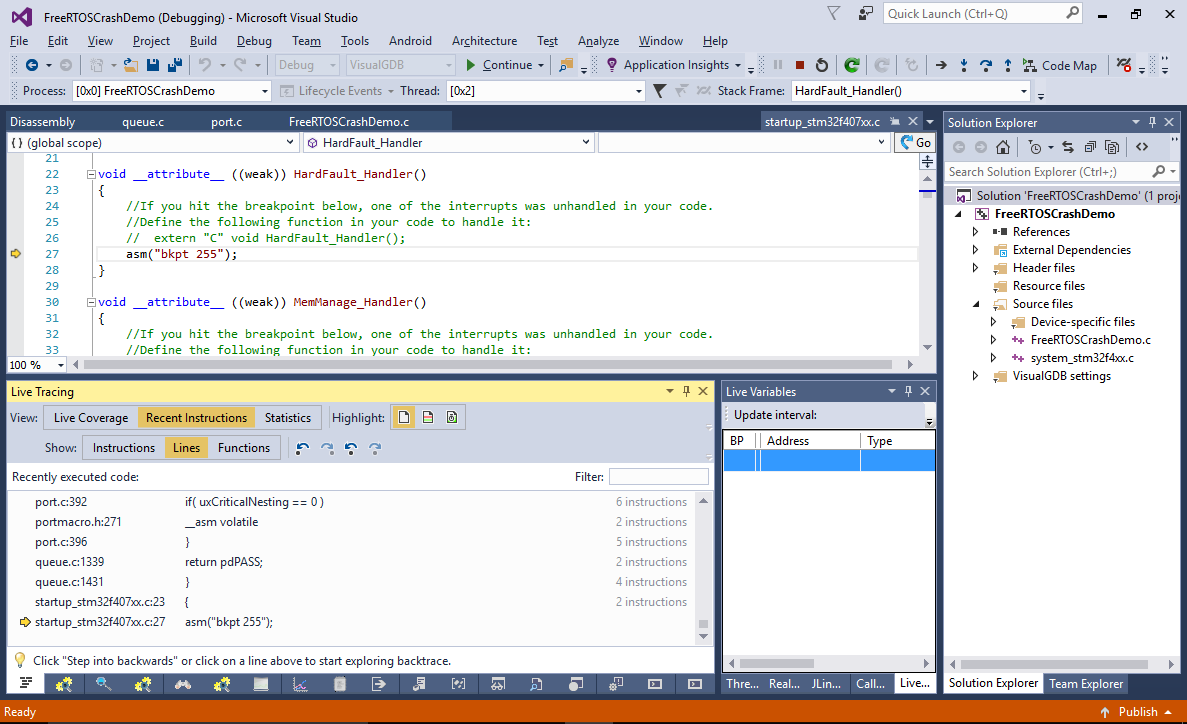
- If you your the program now, it will almost immediately get stopped in the HardFault_handler() function that is called when the ARM core tries executing an invalid instruction or reading from an invalid address:
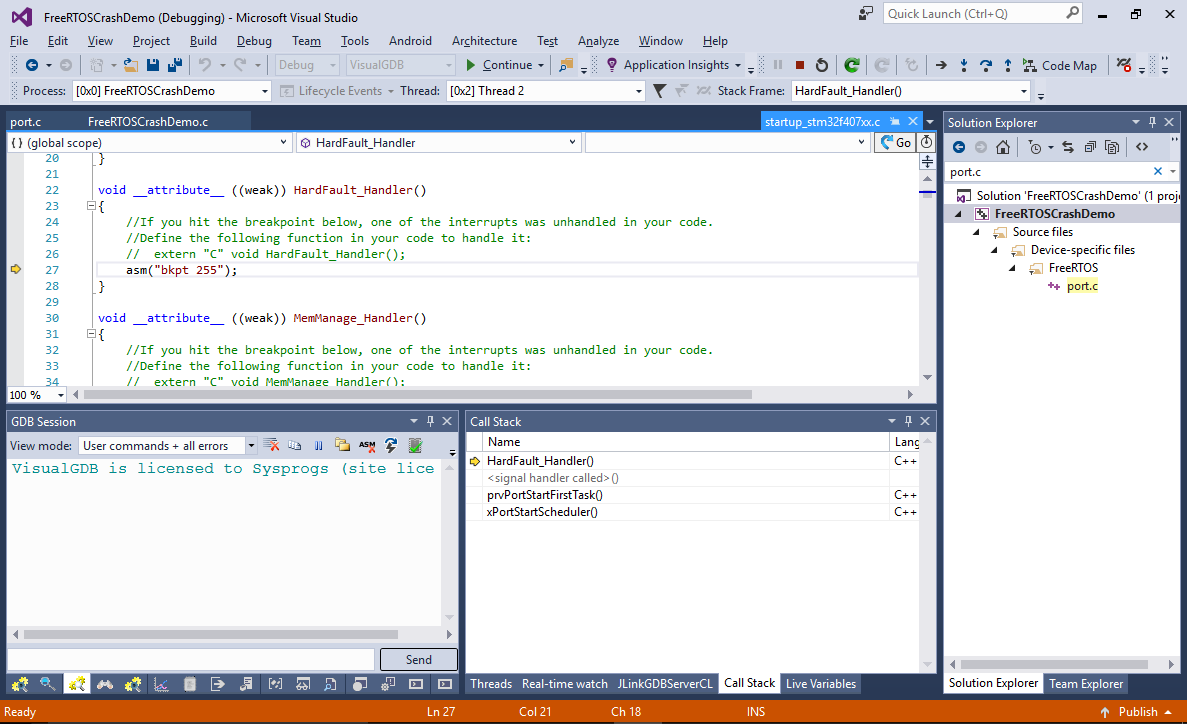 In most of the cases, the Call Stack window would be helpful in identifying the caller of the current function, however in this case it is not very helpful, as it lists the prvPortStartFirstTask() as the caller, that doesn’t make much sense. If we were limited to conventional debugging methods, pinpointing the cause of the crash would be very tough.
 - As we are using J-Trace, we don’t have to rely on the Call Stack to reconstruct the preceding events. Instead we can simply look through executed the instruction list reported by the ARM CPU via the trace interface. Open the Debug->Windows->Live Tracing window and switch it to the Recent Instructions view:
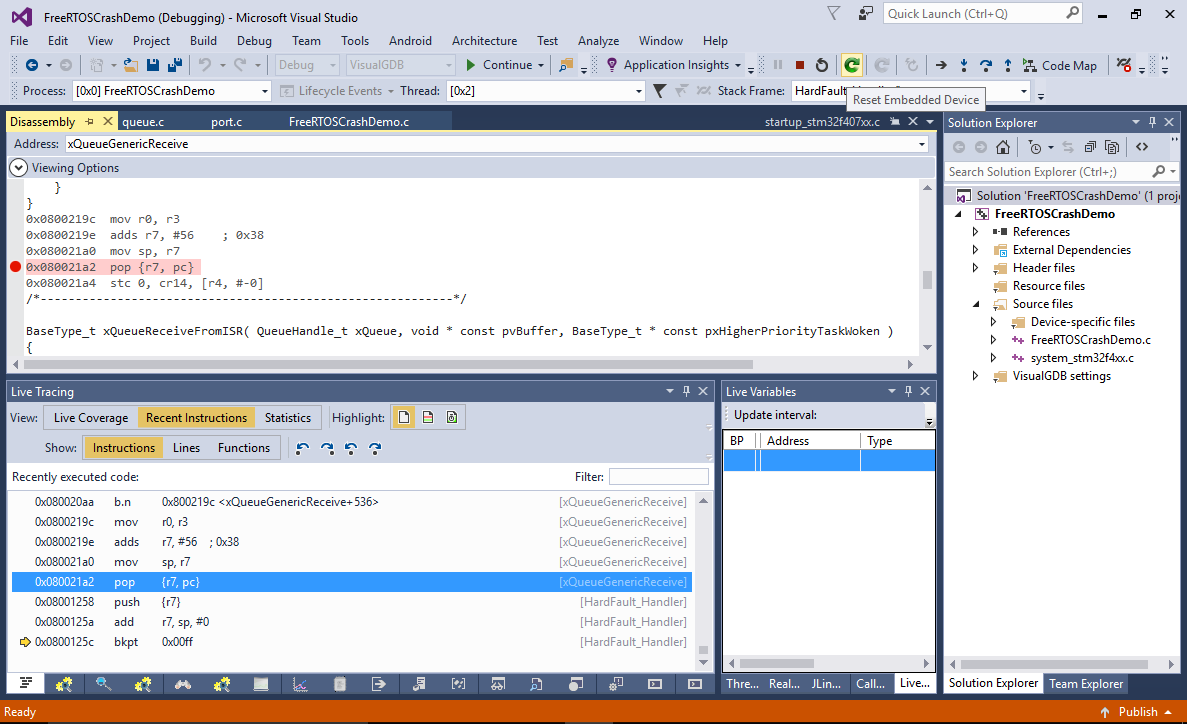
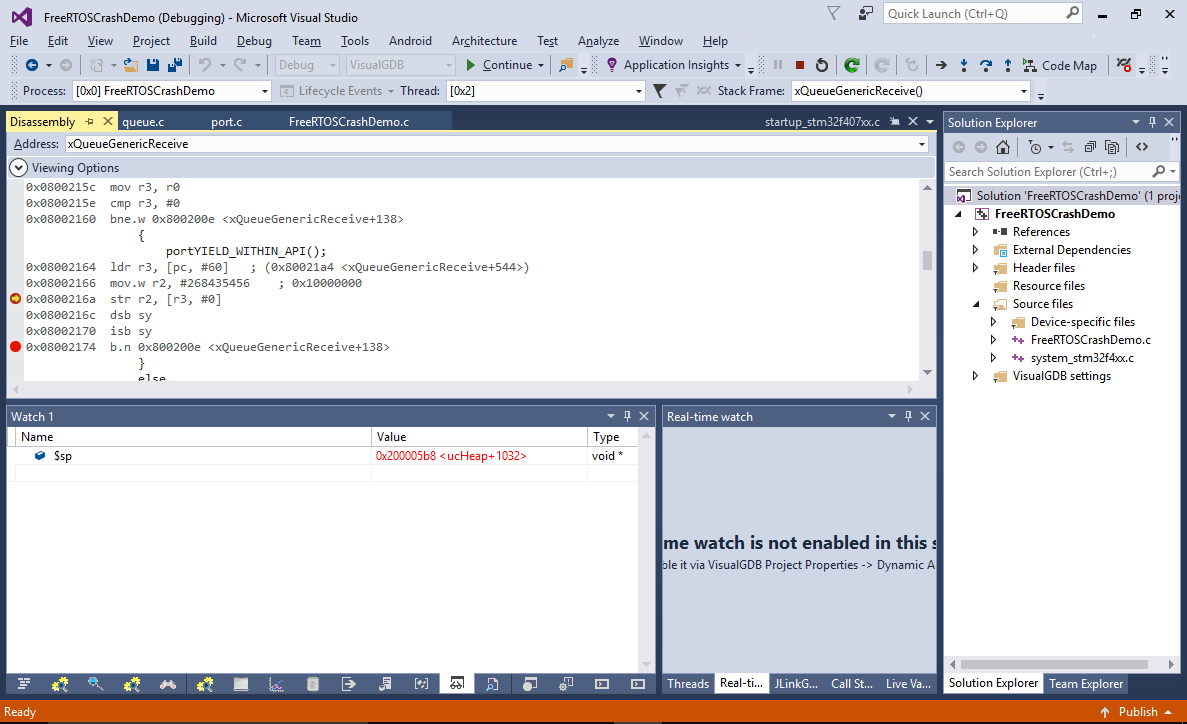
- Switch from the “Lines” subview to “Instructions” and look through the recent instructions. You will see that last function running before HardFault_Handler() was xQueueGenericReceive(). Although the ETM trace will show the previously executed instructions, it won’t reconstruct the register and memory values from the past, so we would still need to use conventional breakpoints to try stopping at the right moment in time and doing more analysis. Click on the last instruction of this function in the trace view and set a breakpoint there. Then press the “Reset Embedded Device” button and hit F5 to continue:
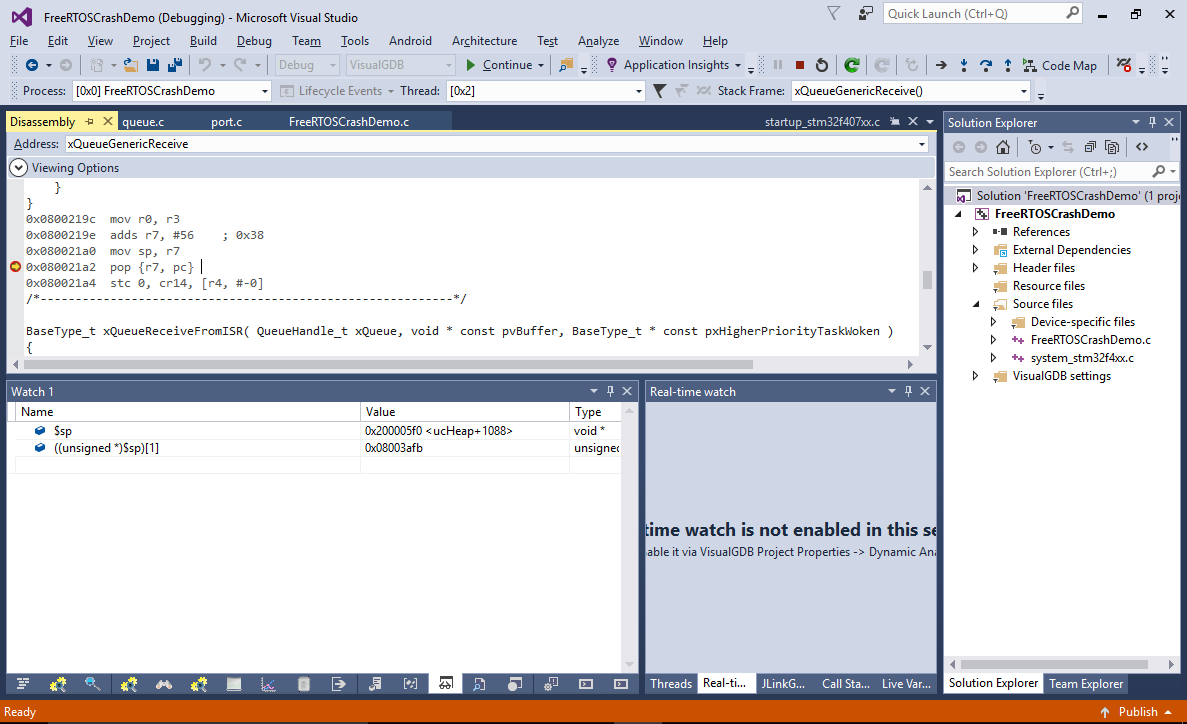
- Once the program restarts and the breakpoint triggers, check the value of the $sp register and the ((unsigned *)$sp)[1] memory slot (containing the return address). The current return address (0x08003afb in this example) looks like a valid FLASH memory address (you can check it by running “info symbol <address>” in the GDB Session window):
- To try catching the moment with the incorrect address, add the following condition to the breakpoint:
((unsigned *)$sp)[1] != <correct value shown currently>
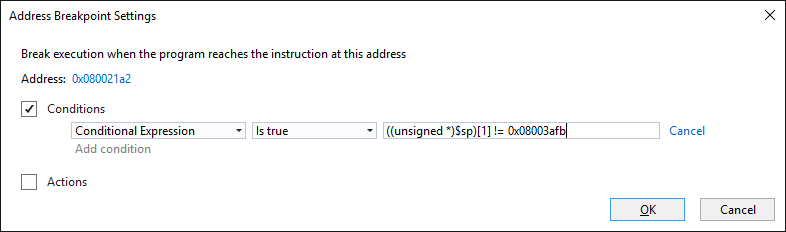
- Resume the program. The breakpoint will now hit, showing that the stack pointer is still the same, although the return value stored after it is wrong:

- We can easily identify the instruction responsible for setting this value by adding a data breakpoint (via the Breakpoints window). Set it on the address of the return address slot (add 4 to current $sp value) and make it conditional so it only breaks when the written value is actually incorrect:
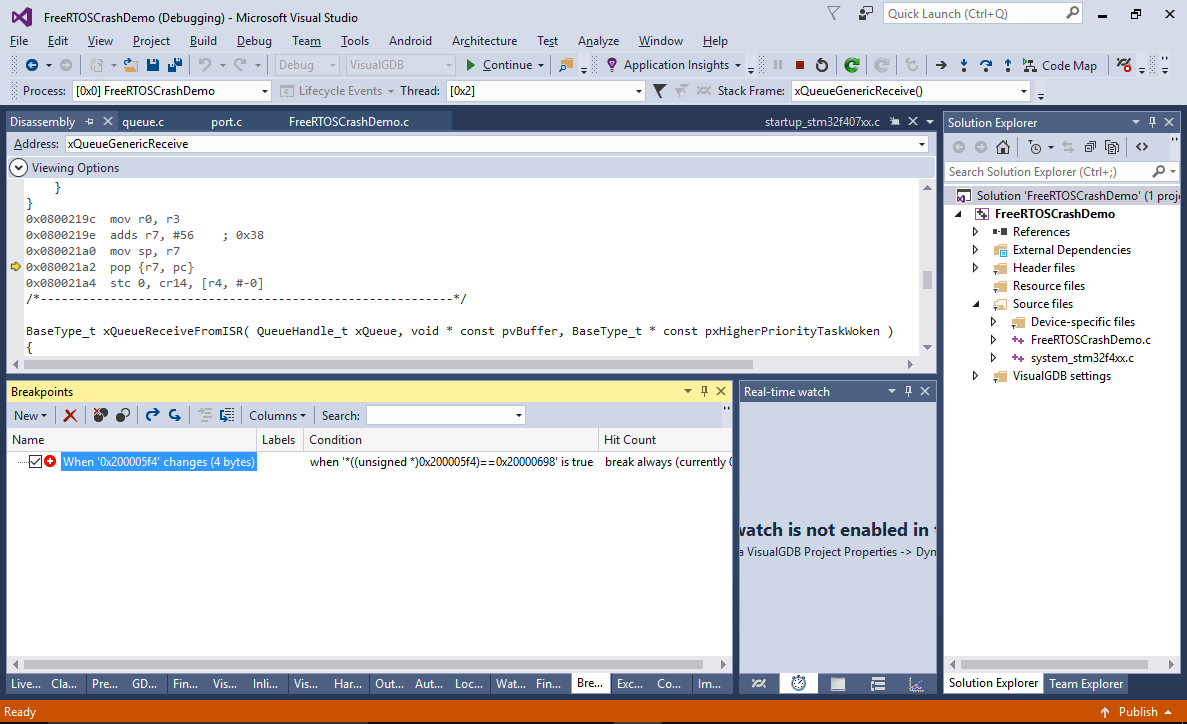
- Restart the program again. The breakpoint will now trigger in the prologue of the prbCopyDataFromQueue() function. Note that due to the internal logic of the ARM core, it will stop 2 instructions after the actual memory writing instruction:
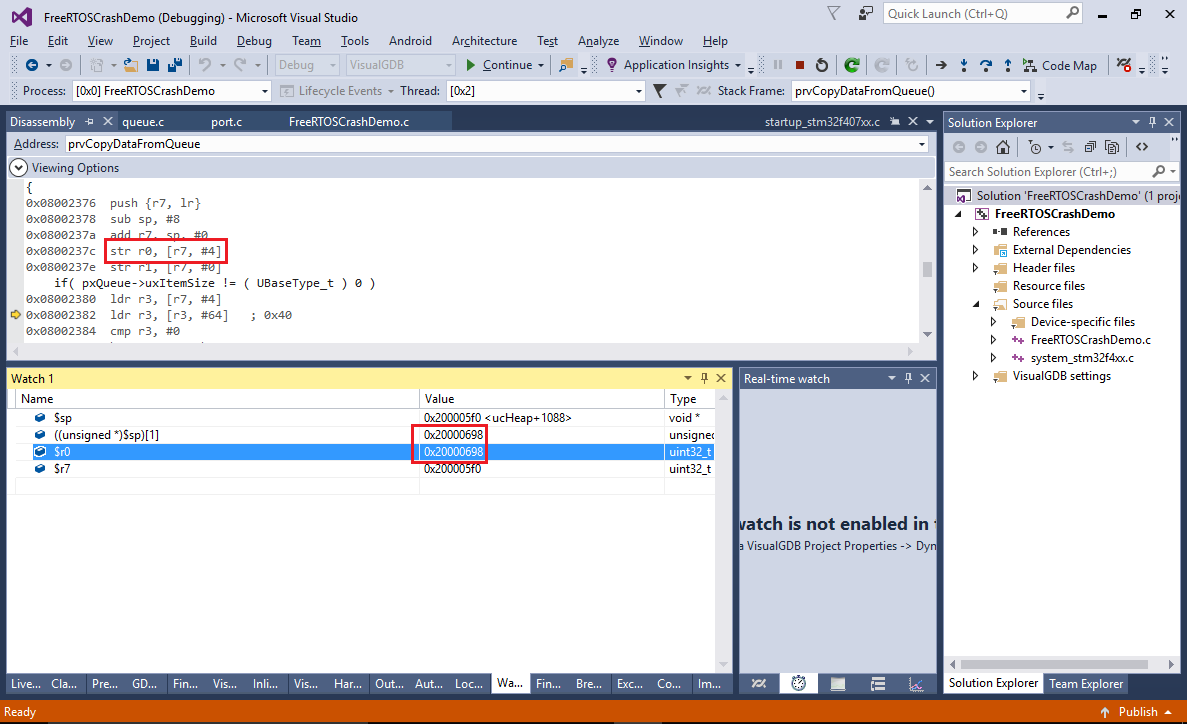
- The instruction is a part of the regular function prologue responsible for saving registers into the stack, so it would only overwrite the return address if the stack pointer was set incorrectly when the function was called. Using conventional debugging methods would require looking through the related code and trying to find parts responsible for stack pointer manipulation, however with the J-Trace you can simply see the list of recently executed functions or instructions and search there:
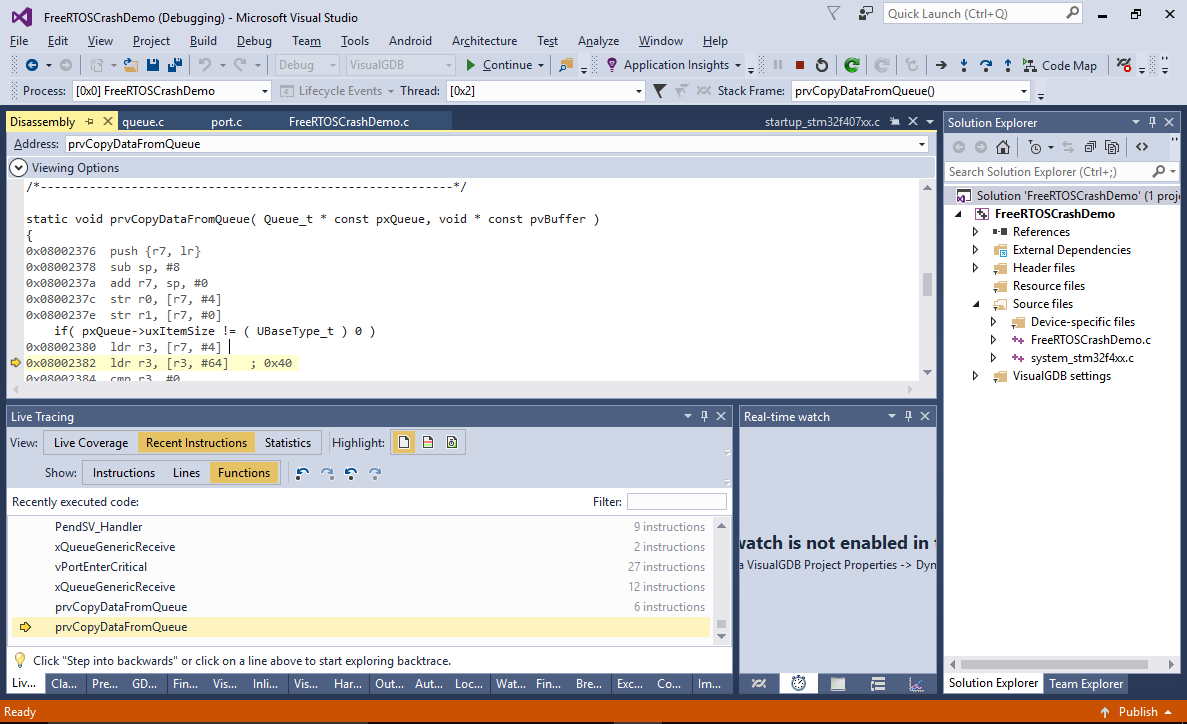
- The code after the PendSV_Handler() doesn’t do anything special with the stack pointer, however the PendSV_Handler() itself is responsible for restoring the stack pointer after a thread switch. Locate the first instruction called after the return from PendSV_Handler() and set a breakpoint there:
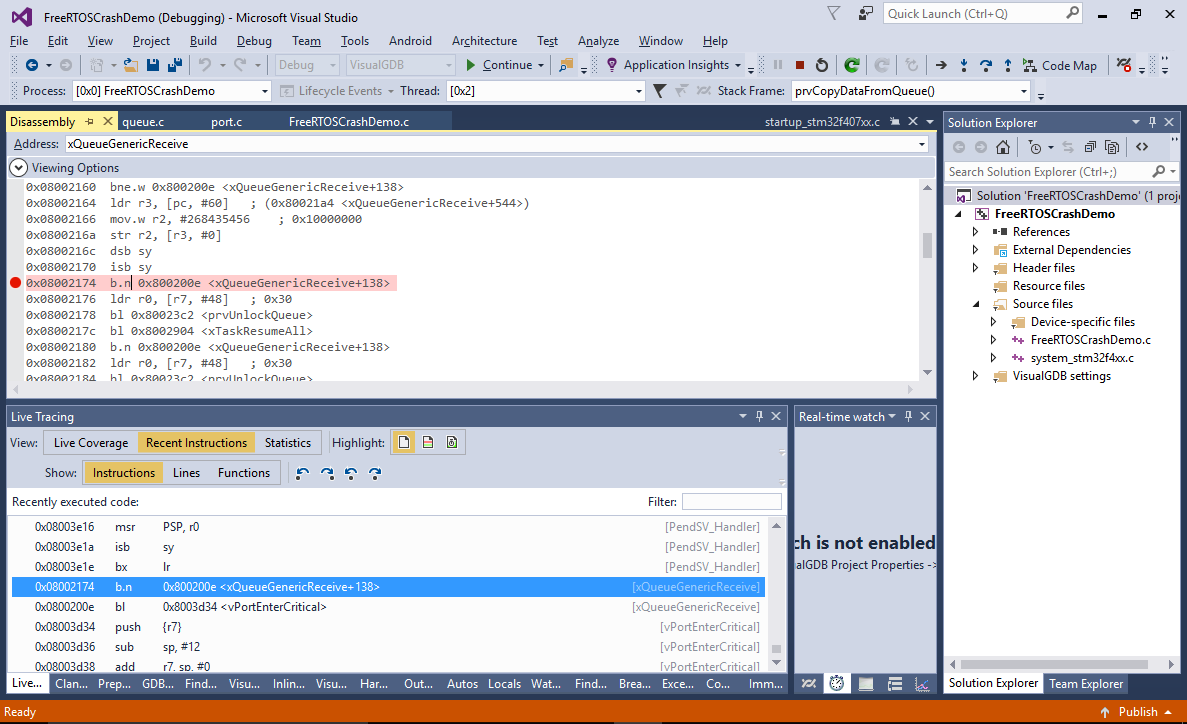 Also set a breakpoint on the instruction that requests a PendSV interrupt. The normal sequence of events should look as follows:
- xQueueGenericReceive (running in thread #2) requests a PendSV interrupt.
- The PendSV interrupt handler stores the current stack pointer and registers inside the thread object and switches the thread context to thread #1.
- Eventually the thread #1 enters a wait state (or is preempted).
- The PendSV handler would then restore the context of thread #2 and continue executing it.
- Once the first breakpoint hits, take a note of the $sp value. Normally it should stay the same once the thread context is restored:
- However in this case it doesn’t happen – the $sp value gets increased by 0x48 bytes after the return from PendSV_Handler(), making the subsequent code overwrite some of the stored values. Eventually the stack pointer is restored based on the frame pointer, but the damage done to the saved values triggers a crash later:

- The only remaining step for solving this puzzle is to understand why PendSV corrupts the stack pointer. Restart the program again and let the first breakpoint (with the correct stack value) hit. Then set a breakpoint inside the PendSV handler and press F5 (don’t use single-stepping as it would suppress interrupts):
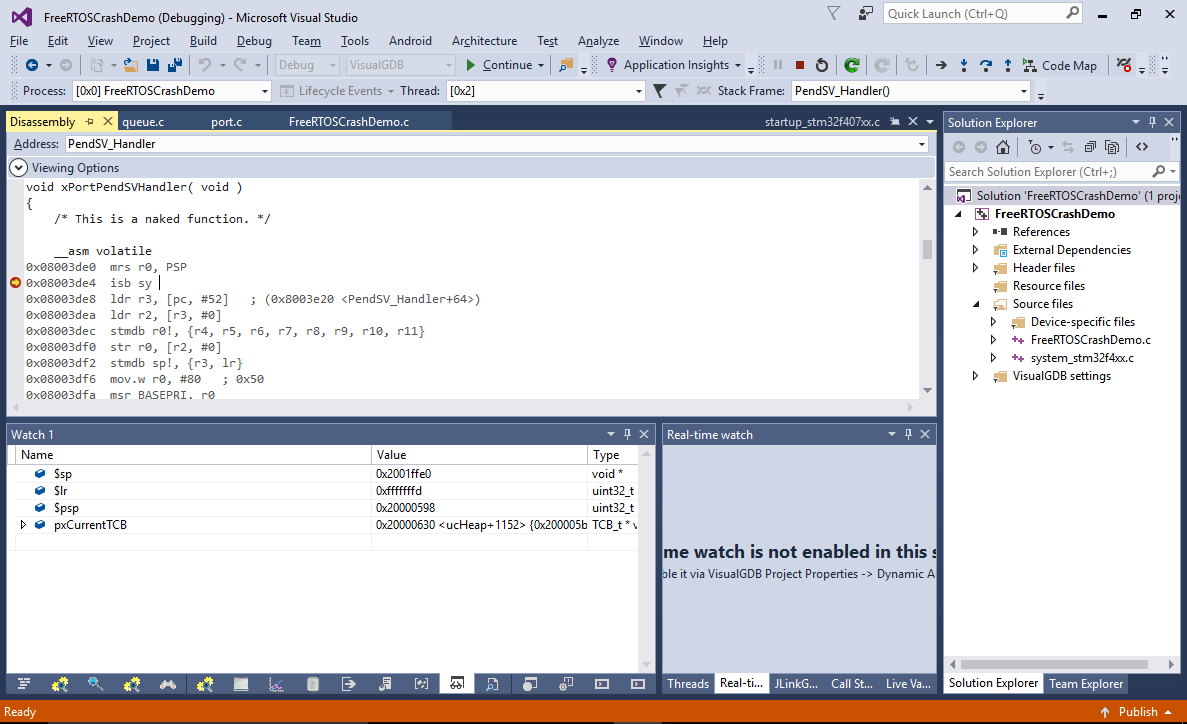 See how the $lr register contains a special value of 0xfffffd. This indicates the the processor automatically saved all registers to the stack and switched from the thread mode to the handler mode (that has its own stack). The “process mode” stack pointer can be observed via the $psp register (that is equal to the previously observed $sp value minus 0x20).
 - Take a note of the pxCurrentTCB value, set a breakpoint at the exit from PendSV_Handler() and continue the program. First time the breakpoint is hit, the pxCurrentTCB will point to a different thread:
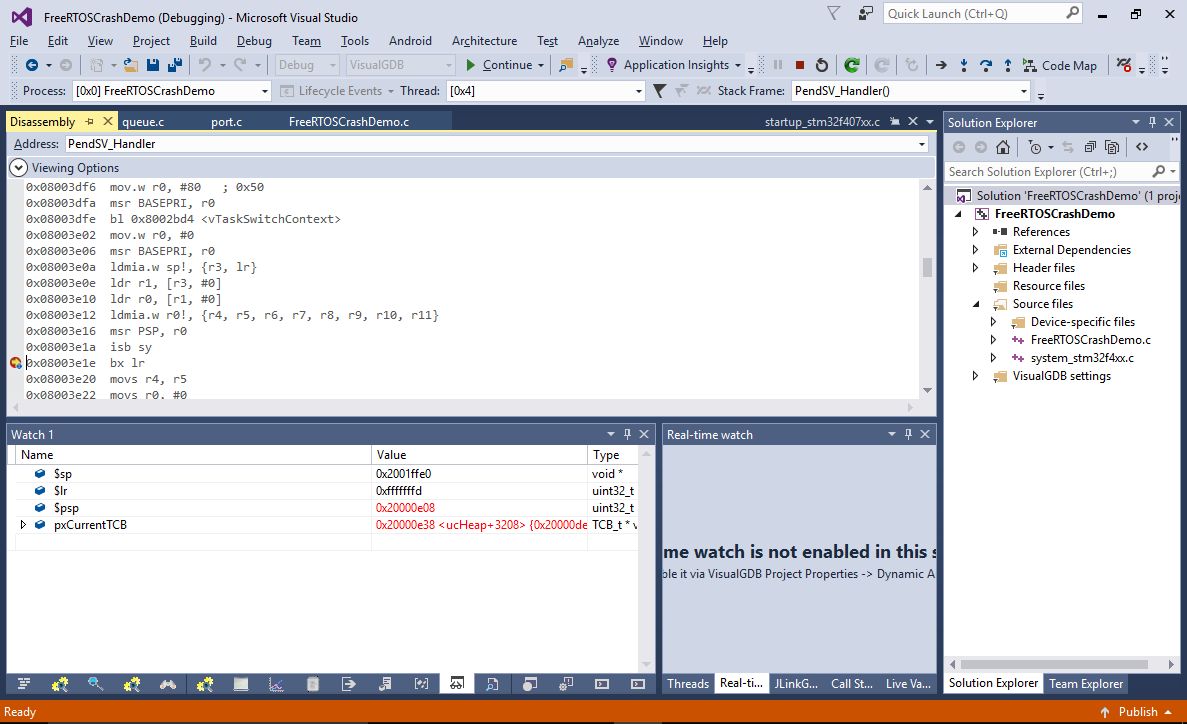
- As we are only interested in the thread #2, continue the program until you see the old pxCurrentTCB value again (you can set a breakpoint condition, or simply press F5 a couple of times):
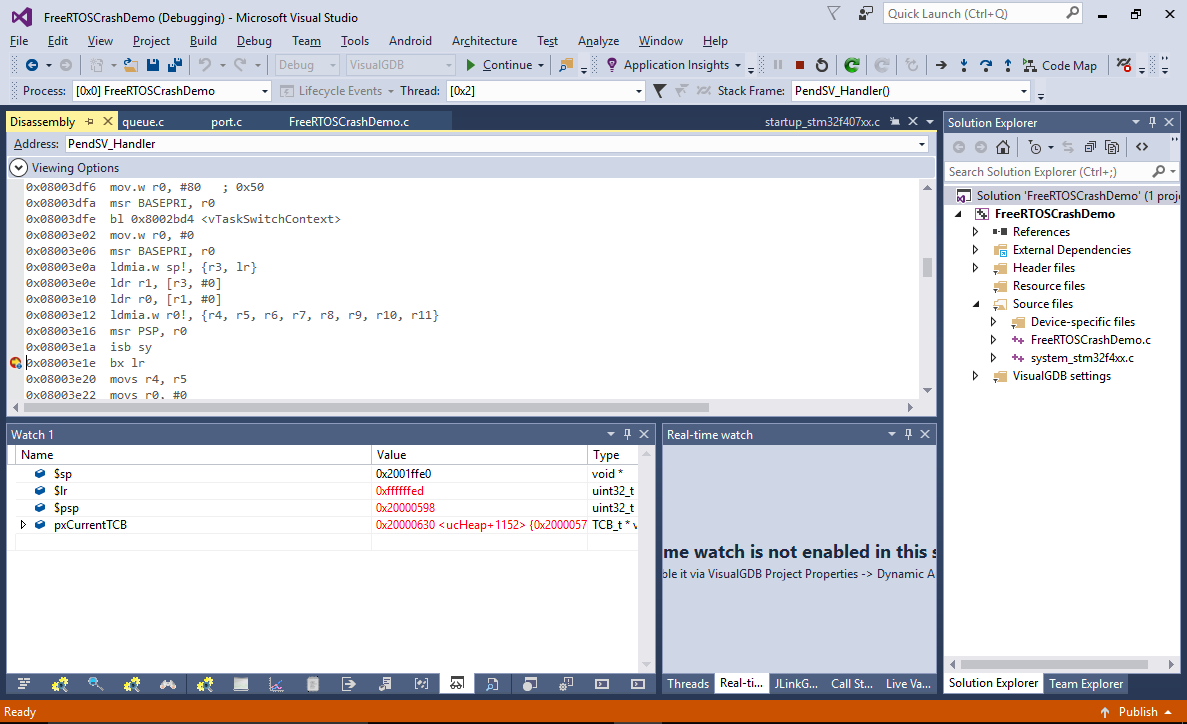 See how the $psp register got restored correctly (0x20000598 in this example), however the $lr register contains 0xffffffed that corresponds to a thread-to-handler mode switch with FP data preservation. If you let the “bx lr” instruction run now, it will “restore” the FP register values from the stack, that never contained them. As a result, it will free more space from the stack than it should, corrupting the stack pointer.
The reconstructed sequence of events looks like this:
- Before running any FP-related code, thread #2 triggers the PendSV interrupt that saves the non-FP registers on the stack and invokes PendSV_Handler().
- The PendSV handler switches the context to thread #1 and returns.
- Thread #1 invokes the sinf() function that uses some FP registers and then triggers the PendSV interrupt again.
- As the FP registers have non-zero values, the ARM processor saves them to the stack and sets $lr to a special value of 0xffffffed that indicates the presence of the FP registers on the stack.
- The PendSV handler restores the context of thread #2 (that has not saved any FP registers).
- The PendSV returns using the 0xffffffed value, causing the ARM CPU to free more stack than was originally used for saving the non-FP registers.
- Subsequent code overwrites the return address stored in the stack before the context switch.
- Eventually the stack pointer is restored to the correct value, but the return address stored in the stack is already wrong.
- When xQueueGenericReceive() returns, it uses the incorrect return address, triggering the HardFault exception.
The problem can be easily solved by switching back to an FP-aware port of FreeRTOS that will handle this case correctly, however as the problem involved several instances of register/memory corruption before the final crash took place, finding the root cause of the crash was not easy and was greatly simplified by using Segger J-Trace that allowed reconstructing the preceding events despite the fact that any evidence on the stack was long gone.