Measuring the Relative Performance of the STM32H7 Devices
In this tutorial we will create a basic FreeRTOS-based project for the ultra high-speed STM32H7-Nucleo board and will then measure the performance of several critical paths comparing it to the STM32F4-Discovery and the STM32F7-Nucleo boards. We will measure and compare the performance of 4 different actions:
- The time to compute a sine value of a hardcoded argument (using the hardware floating point).
- The time between one thread releasing a FreeRTOS semaphore and a higher-priority thread that was waiting for it executing some meaningful code.
- The time to sort a list of 100 elements using the std::list::sort() function. Although this is not the optimal way sort small lists on embedded devices, comparing relative performance of the sorting gives a basic idea about the performance of memory-intense algorithms.
- Finally we will measure the run time of an empty function in order to estimate the overhead of profiling the embedded code.
Before you begin, install VisualGDB 5.3 or later and ensure you have the latest version of the STM32 package and OpenOCD.
- Start Visual Studio and launch the VisualGDB Embedded Project Wizard:
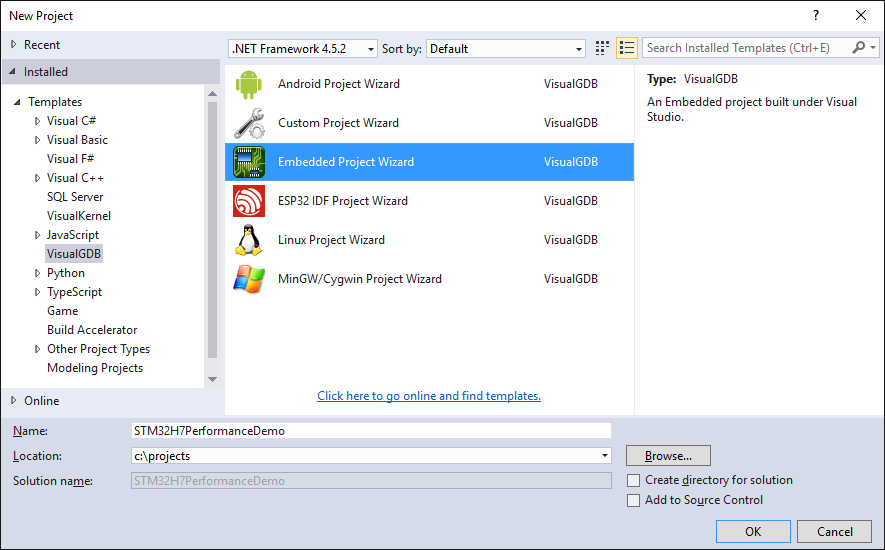
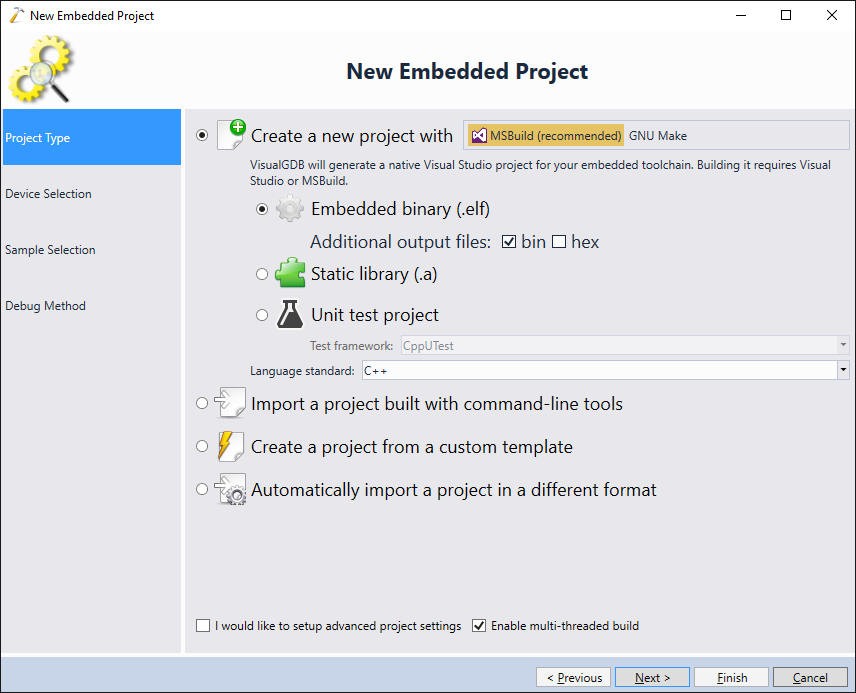
- Select “New Project -> Embedded Binary” and click “Next”:
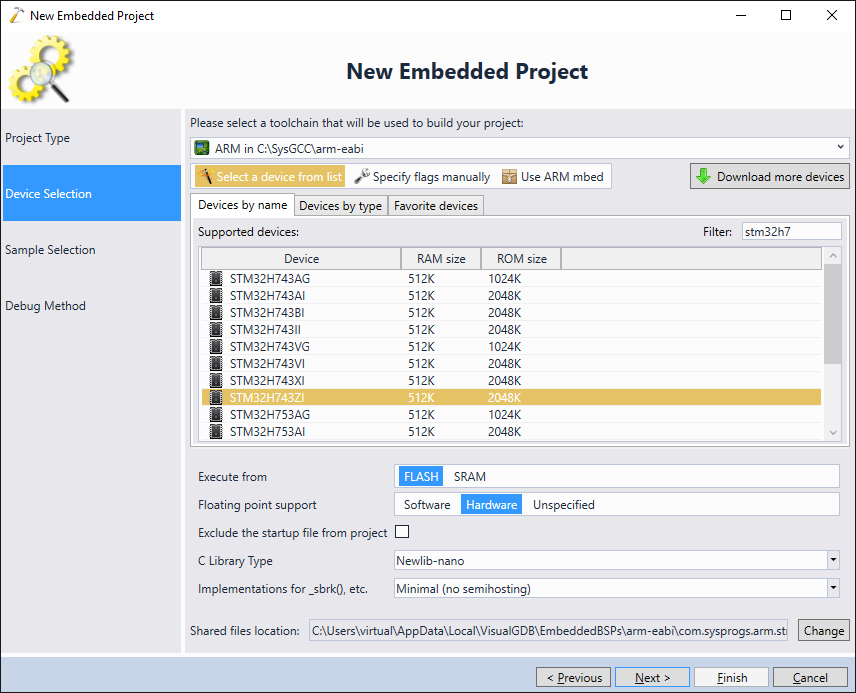
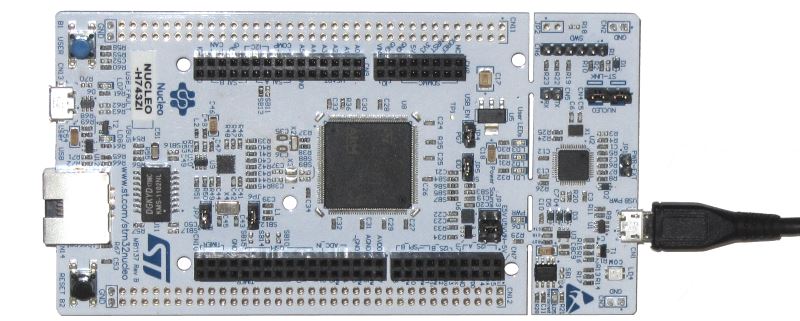
- On the next page choose an ARM toolchain and select the device you want to target. In this tutorial we will use the STM32H7-Nucleo board that features the STM32H743ZI microcontroller:
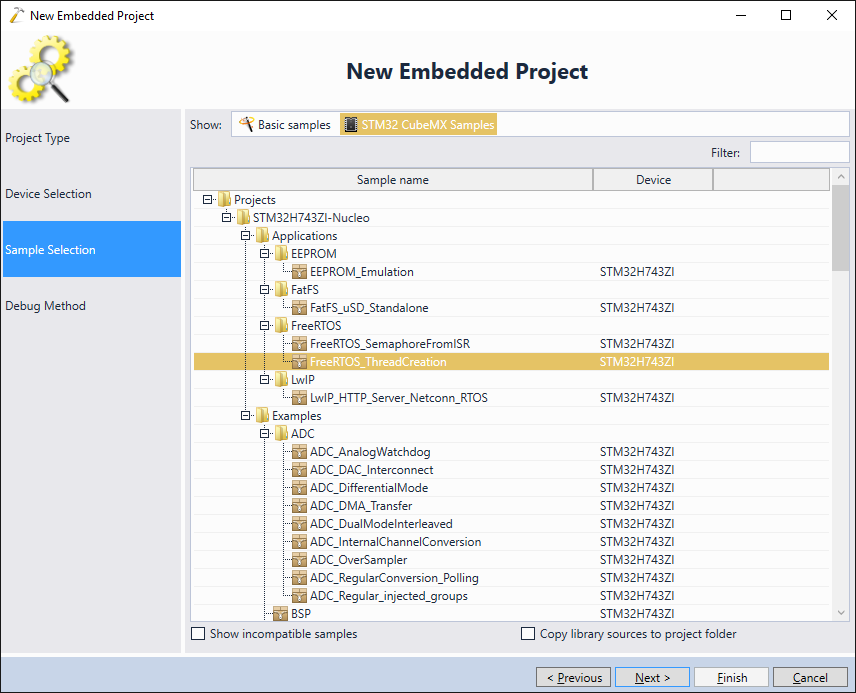
- On the next page select “STM32CubeMX Samples -> FreeRTOS_ThreadCreation”:
- Connect your STM32H7-Discovery board to your computer via USB:
- VisualGDB should automatically recognize the on-board ST-Link programmer and display it in the “Debug using” selector:
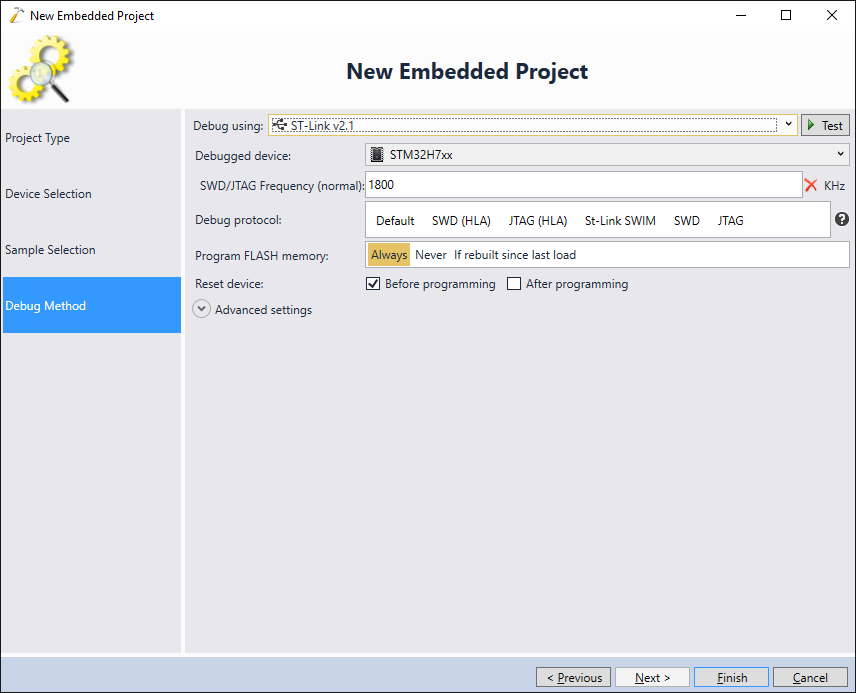 Once the ST-Link is selected, press “Finish” to create the project.
 - As of v1.2.0, the STM32H7 SDK from ST contains incorrect clock initialization code in the FreeRTOS example. To fix it, replace the SystemClock_Config() function with the following one taken from the HTTP Server example:
static void SystemClock_Config(void)
{
    RCC_ClkInitTypeDef RCC_ClkInitStruct;
    RCC_OscInitTypeDef RCC_OscInitStruct;
    HAL_StatusTypeDef ret = HAL_OK;

    /*!< Supply configuration update enable */
    MODIFY_REG(PWR->CR3, PWR_CR3_SCUEN, 0);

    /* The voltage scaling allows optimizing the power consumption when the device is
    clocked below the maximum system frequency, to update the voltage scaling value
    regarding system frequency refer to product datasheet. */
    __HAL_PWR_VOLTAGESCALING_CONFIG(PWR_REGULATOR_VOLTAGE_SCALE1);

    while (!__HAL_PWR_GET_FLAG(PWR_FLAG_VOSRDY)) {}

    /* Enable HSE Oscillator and activate PLL with HSE as source */
    RCC_OscInitStruct.OscillatorType = RCC_OSCILLATORTYPE_HSE;
    RCC_OscInitStruct.HSEState = RCC_HSE_BYPASS;
    RCC_OscInitStruct.HSIState = RCC_HSI_OFF;
    RCC_OscInitStruct.CSIState = RCC_CSI_OFF;
    RCC_OscInitStruct.PLL.PLLState = RCC_PLL_ON;
    RCC_OscInitStruct.PLL.PLLSource = RCC_PLLSOURCE_HSE;

    RCC_OscInitStruct.PLL.PLLM = 4;
    RCC_OscInitStruct.PLL.PLLN = 400;
    RCC_OscInitStruct.PLL.PLLP = 2;
    RCC_OscInitStruct.PLL.PLLR = 2;
    RCC_OscInitStruct.PLL.PLLQ = 4;

    RCC_OscInitStruct.PLL.PLLVCOSEL = RCC_PLL1VCOWIDE;
    RCC_OscInitStruct.PLL.PLLRGE = RCC_PLL1VCIRANGE_2;
    ret = HAL_RCC_OscConfig(&RCC_OscInitStruct);
    if (ret != HAL_OK)
    {
         asm("bkpt 255");
    }

    /* Select PLL as system clock source and configure bus clocks dividers */
    RCC_ClkInitStruct.ClockType = (RCC_CLOCKTYPE_SYSCLK | RCC_CLOCKTYPE_HCLK | RCC_CLOCKTYPE_D1PCLK1 | RCC_CLOCKTYPE_PCLK1 | \
    RCC_CLOCKTYPE_PCLK2 | RCC_CLOCKTYPE_D3PCLK1);

    RCC_ClkInitStruct.SYSCLKSource = RCC_SYSCLKSOURCE_PLLCLK;
    RCC_ClkInitStruct.SYSCLKDivider = RCC_SYSCLK_DIV1;
    RCC_ClkInitStruct.AHBCLKDivider = RCC_HCLK_DIV2;
    RCC_ClkInitStruct.APB3CLKDivider = RCC_APB3_DIV2;
    RCC_ClkInitStruct.APB1CLKDivider = RCC_APB1_DIV2;
    RCC_ClkInitStruct.APB2CLKDivider = RCC_APB2_DIV2;
    RCC_ClkInitStruct.APB4CLKDivider = RCC_APB4_DIV2;
    ret = HAL_RCC_ClockConfig(&RCC_ClkInitStruct, FLASH_LATENCY_4);
    if (ret != HAL_OK)
    {
        asm("bkpt 255");
    }

    /*activate CSI clock mondatory for I/O Compensation Cell*/
    __HAL_RCC_CSI_ENABLE();

    /* Enable SYSCFG clock mondatory for I/O Compensation Cell */
    __HAL_RCC_SYSCFG_CLK_ENABLE();

    /* Enables the I/O Compensation Cell */
    HAL_EnableCompensationCell();
}
- Switch the project to the Release configuration and enable both RTOS tracing and function tracing via VisualGDB Project Properties -> Dynamic Analysis:
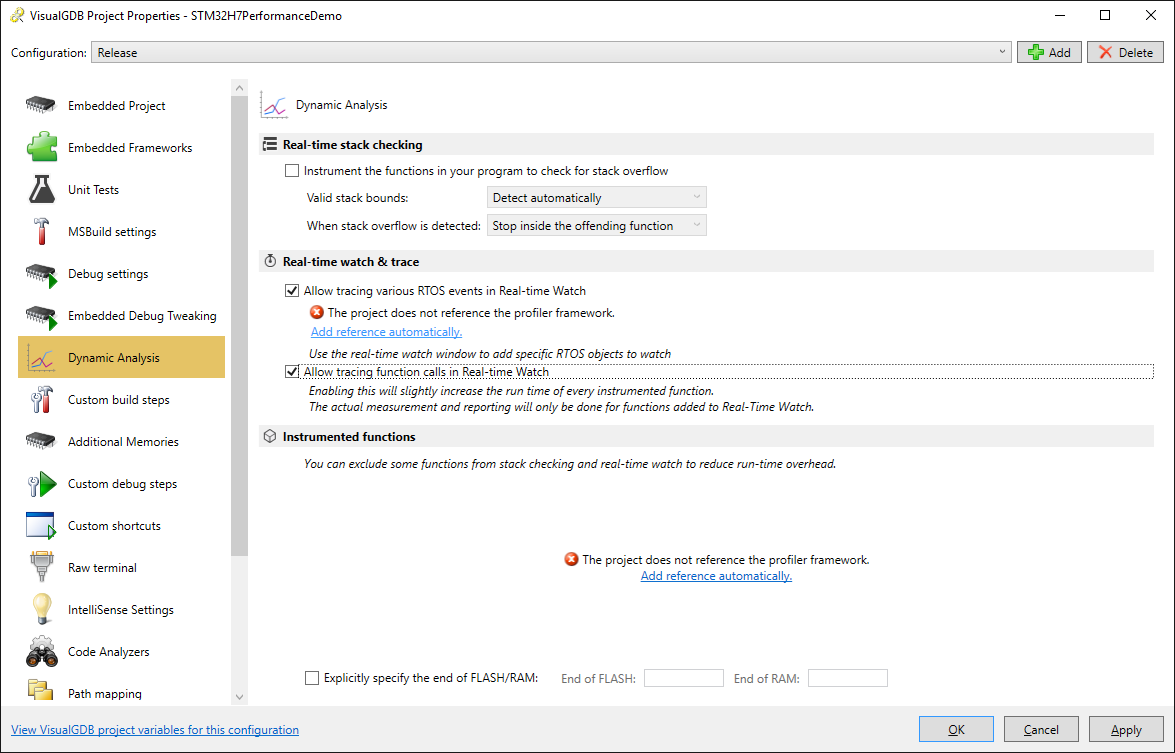 Proceed with referencing the profiler framework as VisualGDB suggests.
 - If you try building the project now, the profiler framework will report a missing USE_FREERTOS macro. This happens because the sample project we used in this tutorial comes directly from the ST samples and does not contain VisualGDB-specific macros:
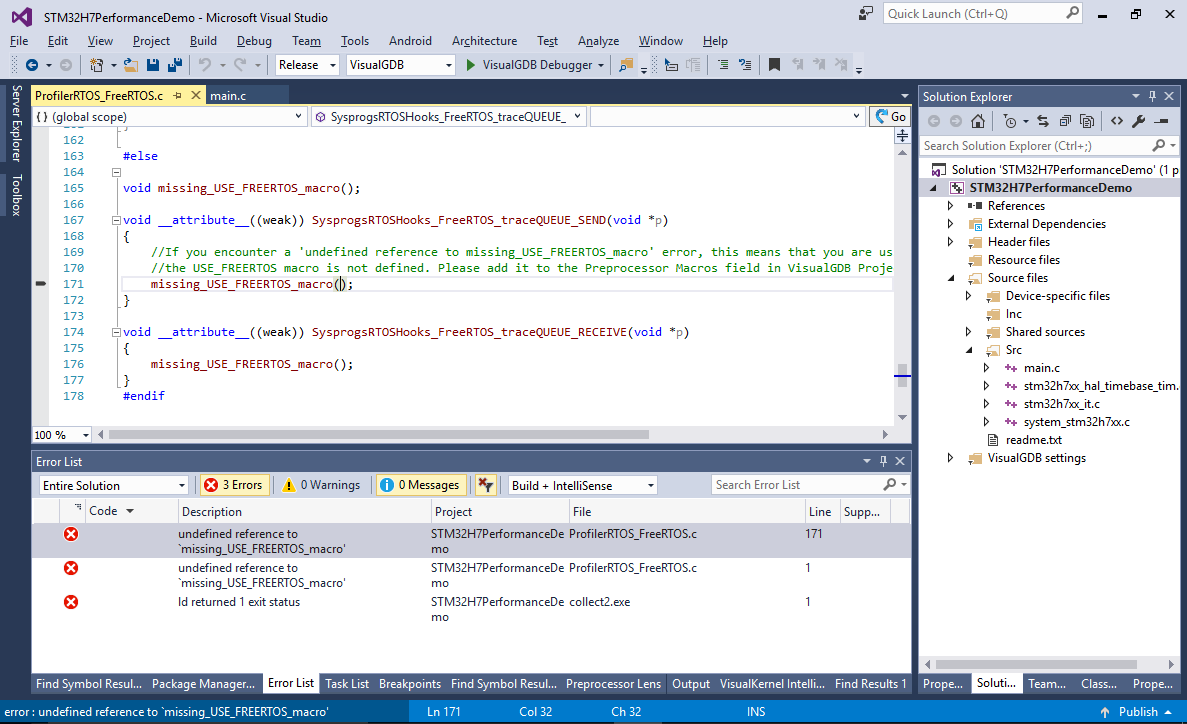
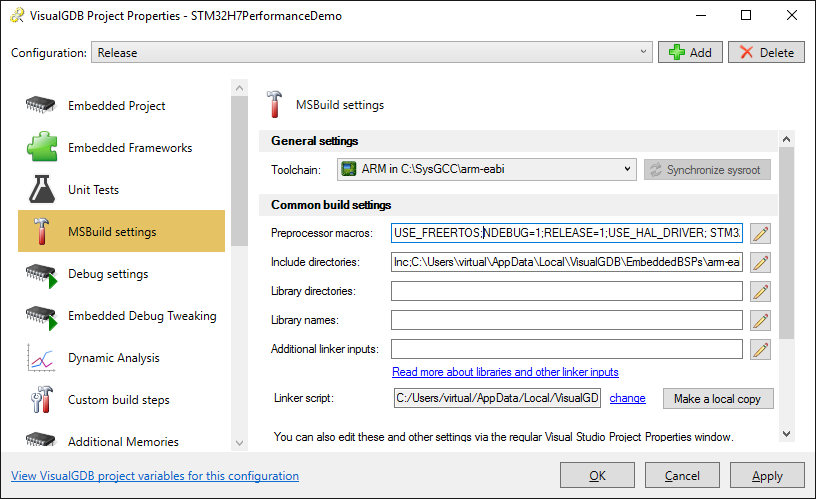
- Add the USE_FREERTOS macro via VisualGDB Project Properties -> MSBuild and the project will build successfully:
- Finally replace the main() function and the 2 thread functions with the following code:
#include "main.h"
#include "cmsis_os.h"
#include <math.h>

osThreadId LEDThread1Handle, LEDThread2Handle;
static void SenderThread(void const *argument);
static void ReceiverThread(void const *argument);
static void SystemClock_Config(void);
static void CPU_CACHE_Enable(void);

osSemaphoreDef(s_Semaphore);
osSemaphoreId(s_SemaphoreId);

int main(void)
{
    /* Enable the CPU Cache */
    CPU_CACHE_Enable();

    HAL_Init();
    SystemClock_Config();

    osThreadDef(LED1, SenderThread, osPriorityNormal, 0, configMINIMAL_STACK_SIZE);
    osThreadDef(LED2, ReceiverThread, osPriorityHigh, 0, configMINIMAL_STACK_SIZE);

    LEDThread1Handle = osThreadCreate(osThread(LED1), NULL);
    LEDThread2Handle = osThreadCreate(osThread(LED2), NULL);

    s_SemaphoreId = osSemaphoreCreate(osSemaphore(s_Semaphore), 32);
    osKernelStart();
}

void __attribute__((noinline)) TestSinf()
{
    volatile float in = 0.1234F, out;
    for (int i = 0; i < 100; i++)
        out = sinf(in);
}

void __attribute__((noinline)) EmptyFunction()
{
    asm("nop");
}

static void SenderThread(void const *argument)
{
    uint32_t count = 0;

    for (;;)
    {
        TestSinf();

        osSemaphoreRelease(s_SemaphoreId);
        osDelay(100);
    }
}

static void ReceiverThread(void const *argument)
{
    for (;;)
    {
        osSemaphoreWait(s_SemaphoreId, osWaitForever);
        EmptyFunction();
    }
}
The code above creates 2 threads:
- The sender thread will call the TestSinf() function that calls sinf() 100 times and returns. Then it will release a semaphore and sleep for 100 milliseconds. We will measure the time taken by the TestSinf() function on different devices to do a basic comparison of their floating-point performance.
- The receiver thread will wait on the semaphore released by the sender thread and then will immediately call EmptyFunction(). We will measure the time before the call to osSemaphoreWait() and the subsequent invocation of EmptyFunction() to estimate the FreeRTOS thread switching latency.
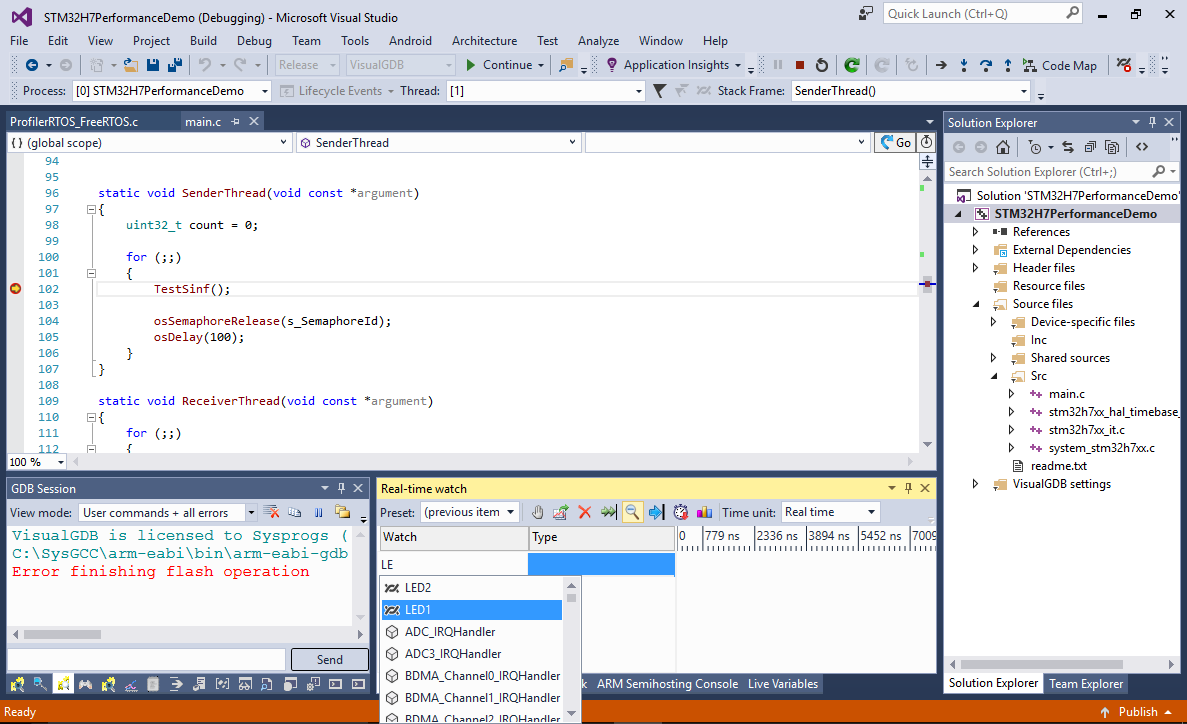
- Build the code, set a breakpoint inside SenderThread() and start debugging by pressing F5. Once the breakpoint hits, open the Debug->Windows->Real-time Watch window:
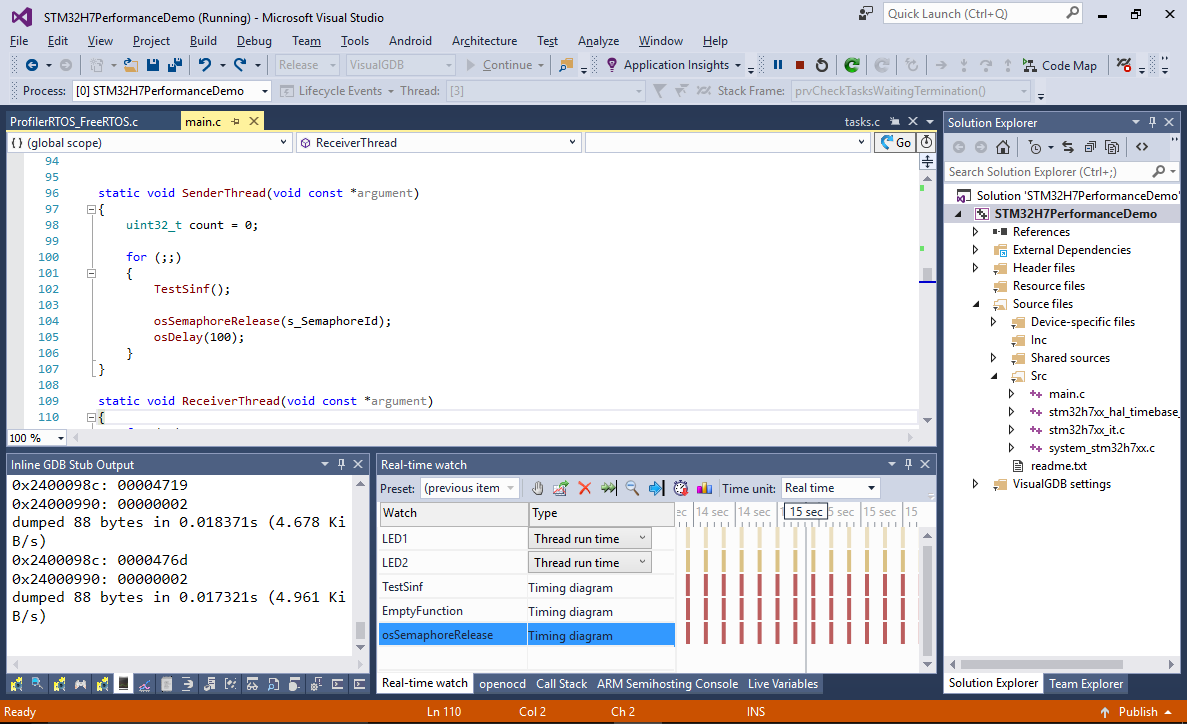
- Add both threads (LED1 and LED2) and the TestSinf(), EmptyFunction() and osSemaphoreRelease() functions to real-time watch, then press F5 to continue debugging. VisualGDB will display short bursts of activity every 100 milliseconds corresponding to the thread activity:
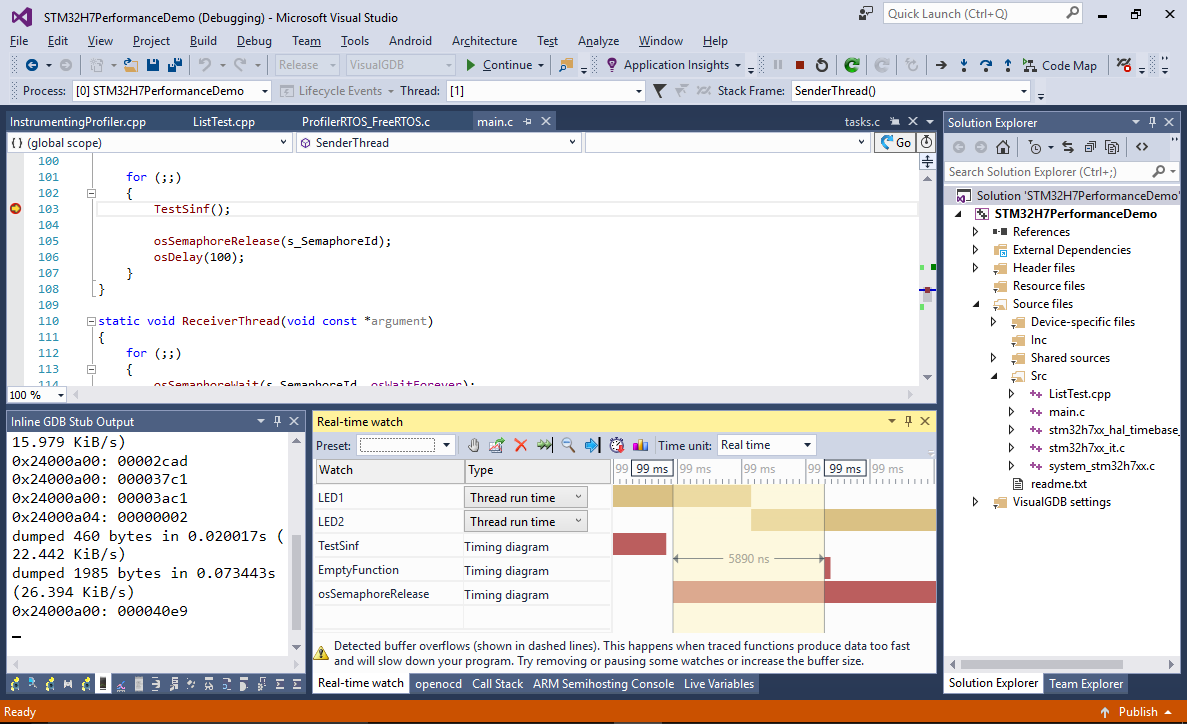
- Zoom into one of the bursts. Hover the mouse over the TestSinf() call to see its run time:

- Similarly check the runtime of EmptyFunction():
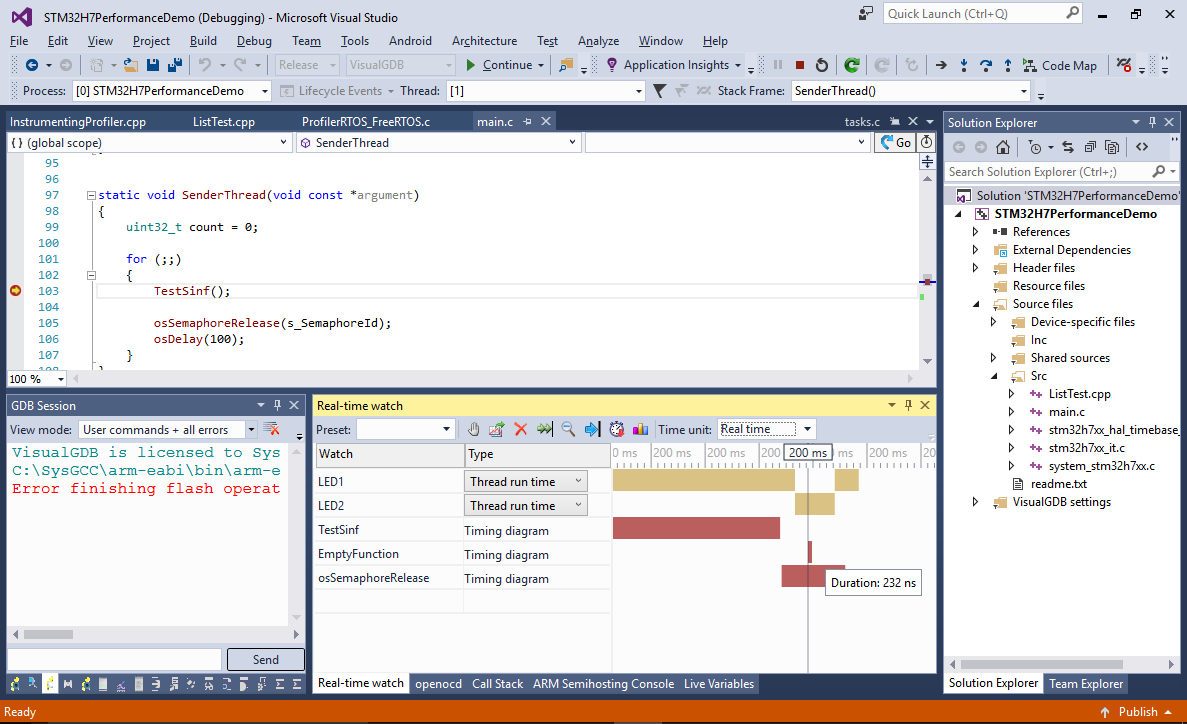
- Select the time between the call to osSemaphoreRelease and the invocation of EmptyFunction() in the second thread. This represents the time required for the threads to switch (that includes changing the thread state, selecting the next thread to run, etc):
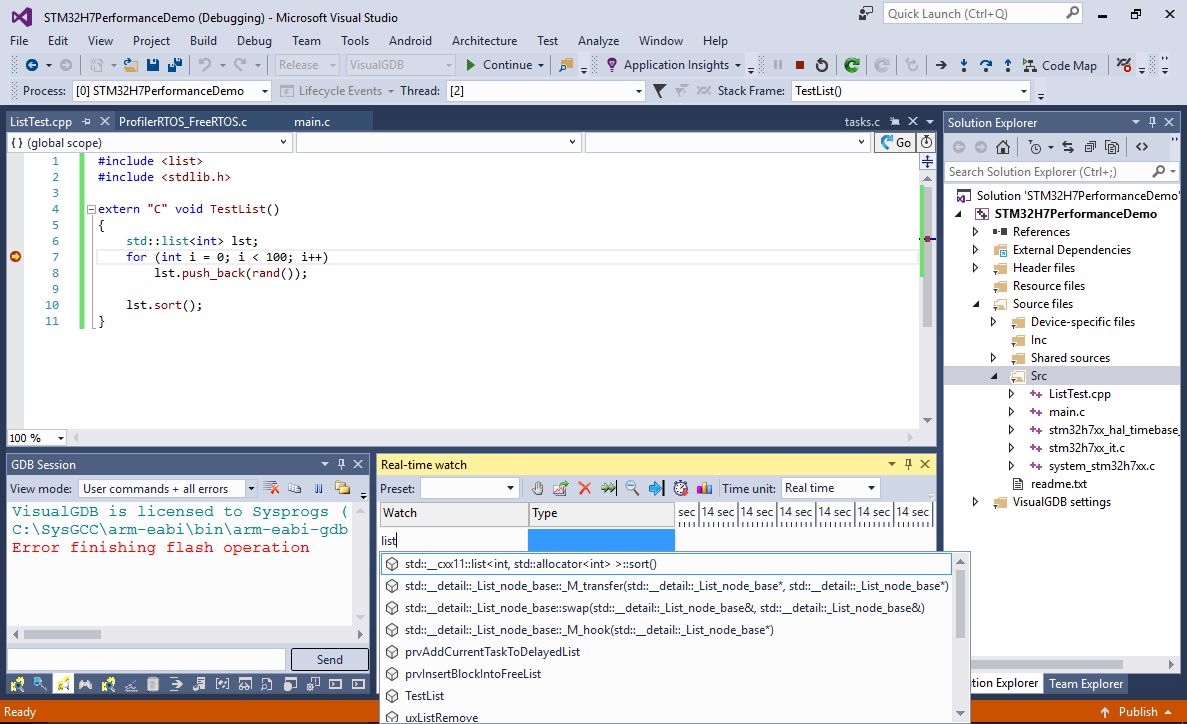
- Finally add a new C++ source file to the project with the following contents:
#include <list>
#include <stdlib.h>

extern "C" void TestList()
{
    std::list<int> lst;
    for (int i = 0; i < 100; i++)
        lst.push_back(rand());

    lst.sort();
}
Then call TestList() from main().
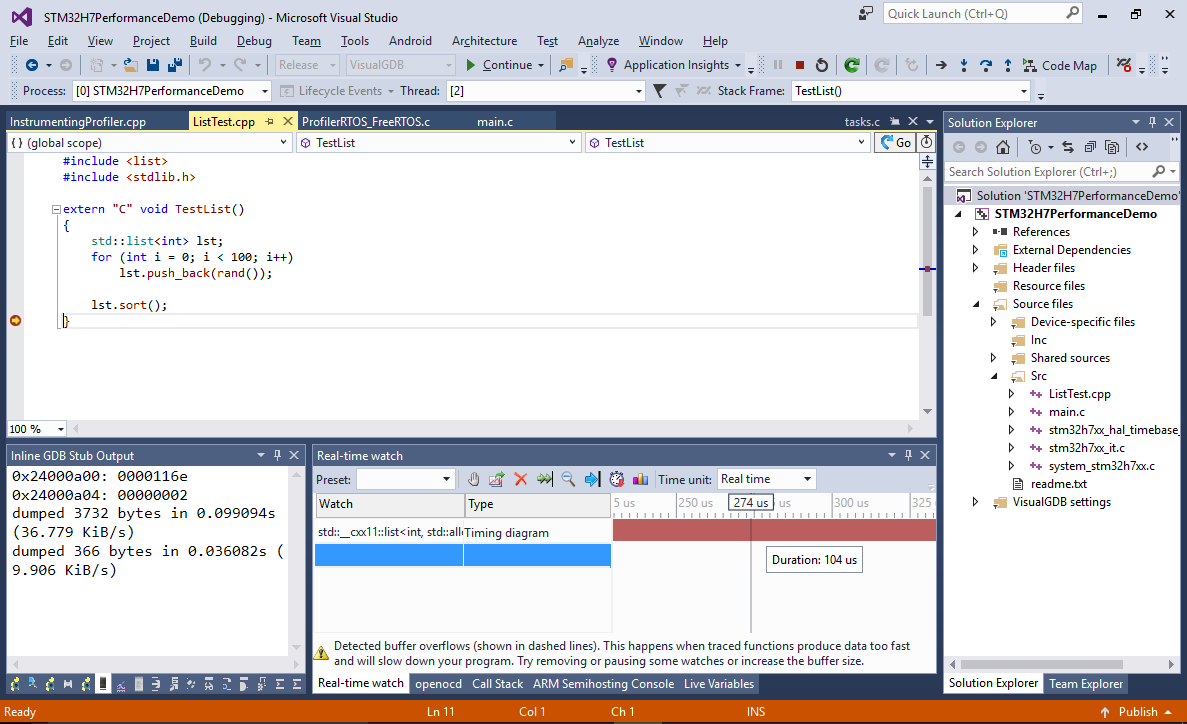
- Set a breakpoint in TestList() and once it hits, add the list::sort() method to real-time watch:
- Once the sort method finishes running, check its runtime in Real-time watch:
- You can repeat those measurements on other boards to compare their relative performance. Below are the figures we measured:
Device SystemCoreClock 100x sinf() Empty function Latency list<int>::sort() of 100 elements STM32H746ZI 400 MHz 32 uS (12.6K cycles) 232 ns (93 cycles) 5.9 uS (2359 cycles) 104 uS (41.5K cycles) STM32F746NG 216 MHz 69 uS (13K cycles) 741 ns (160 cycles) 9.3 uS (2010 cycles) 192 uS (41.5K cycles) STM32F407VG 168 MHz 105 uS (17.6K cycles) 756 ns (127 cycles) 17 uS (2876 cycles) 431 uS (72.8K cycles) The high-speed STMH746ZI device shows a significant improvement to the older STM32F407VG device in terms of clock cycles due to a much more capable ARM Cortex-M7 core (compared to Cortex-M4). Combined with a 2.3x increase of the system clock this yields 3x-4x speedup.
Compared to the same-core STM32F46NG device, the performance in terms of cycles stays relatively the same, although the 1.85x clock frequency increase still provides a consistent performance boost in all tests. - If you would like to compare the performance of your code on different devices, you can either use the real-time watch mechanism shown in this tutorial, or try the zero-overhead Chronometer feature that will measure the clock cycle counts between breakpoints, steps and other debug events.