Debugging ESP32-S2-Kaluga-1 Board with Visual Studio
This tutorial shows how to create a basic project for the ESP32-S2-Kaluga-1 board using Visual Studio and VisualGDB. We will show the supported tool versions and the setup necessary to begin debugging the board.
Before you begin, install VisualGDB 5.5 or later and upgrade to the latest ESP32 toolchain and OpenOCD package via VisualGDB Package Manager.
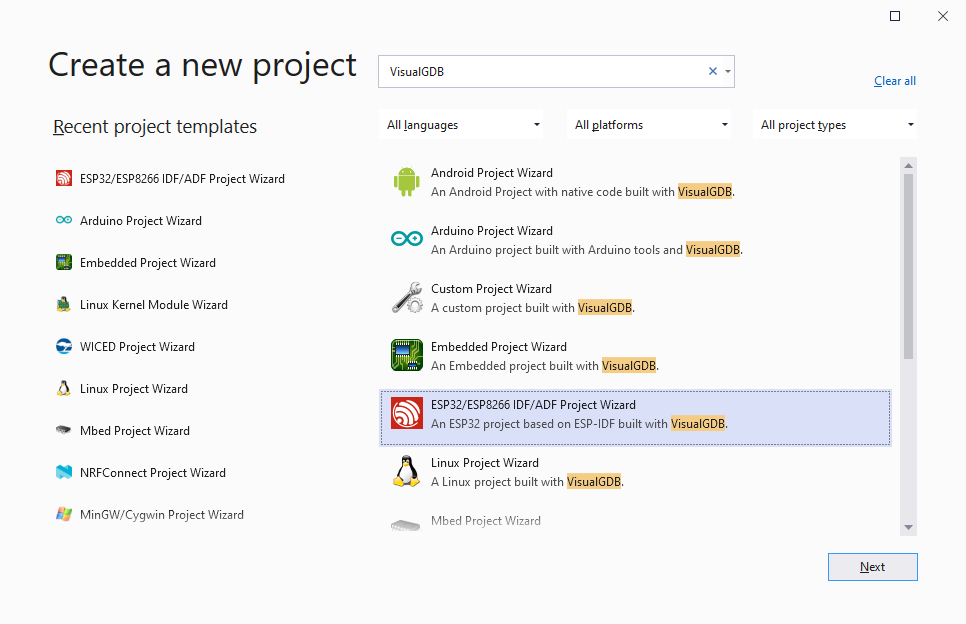
- Start Visual Studio and begin creating a new project using VisualGDB’s ESP-IDF Project Wizard:
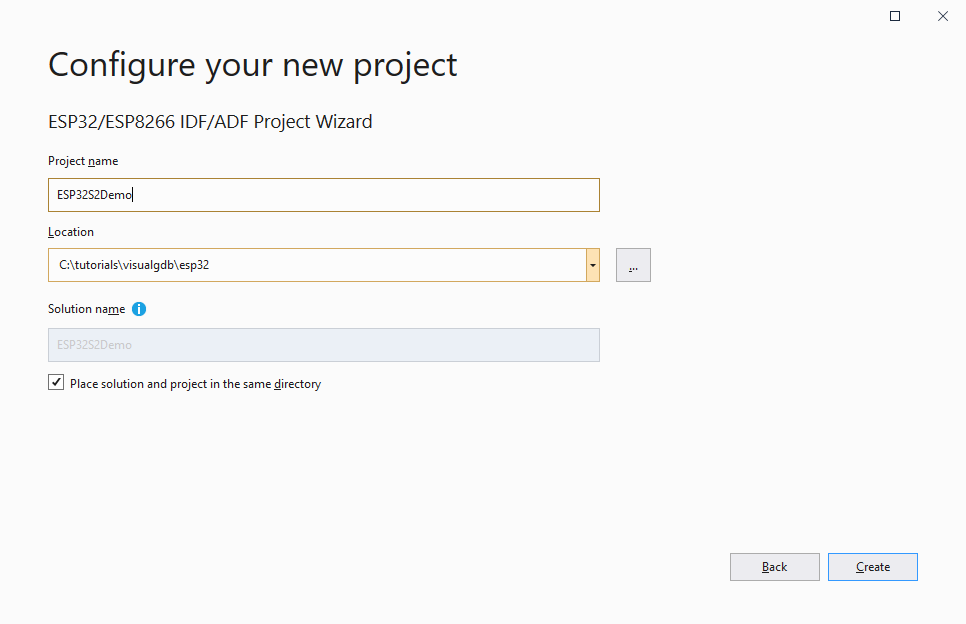
- Enter the name and location for your project:
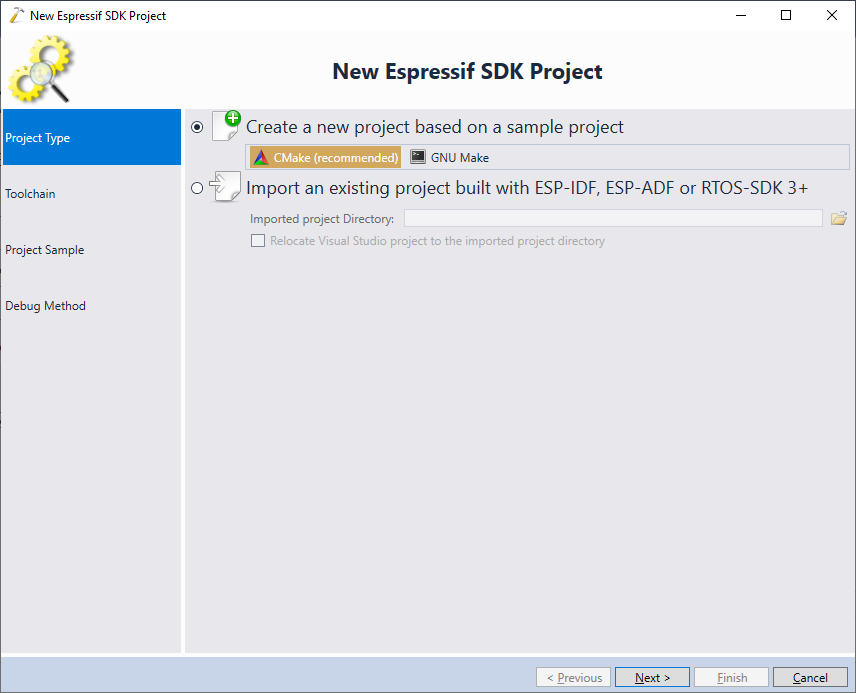
- The ESP32-S2 device is only supported by CMake-based build setup, so select CMake on the first page and click “Next”:
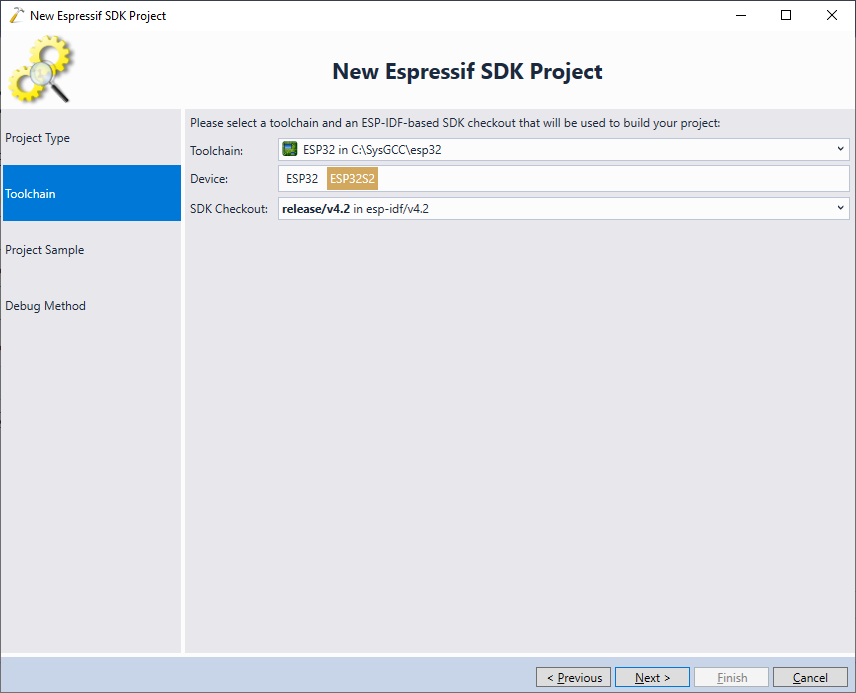
- Select the latest ESP32 toolchain and pick the ESP32-S2 device. Note that not all ESP-IDF versions support the ESP32-S2 device. The table below provides an overview of compatible versions:
ESP-IDF Version Status (as of July 2020) ESP32-S2 (Beta) ESP32-S2 (Final Version) 4.0 Stable – – 4.1 Unstable Supported – 4.2 Unstable – Supported Note that the beta version of the ESP32-S2 chip is not compatible with the final ESP32-S2 chip. In this tutorial we will use the final ESP32-S2 chip version, hence we select ESP-IDF 4.2:
 Update: For better compatibility with the latest ESP32 tools, we recommend selecting the consolidated toolchain instead.
 - On the next page select the hello_world sample and click “Next” again:

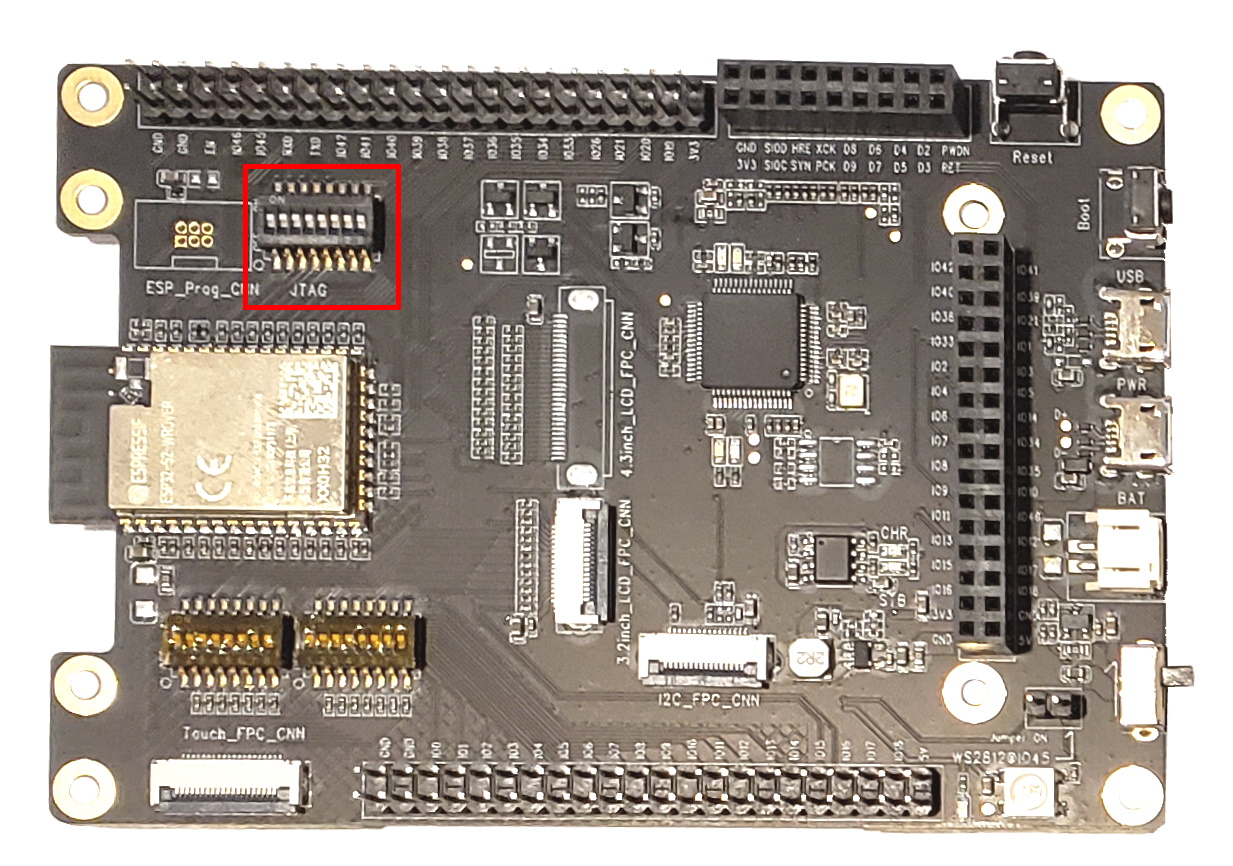
- Before you can proceed with debugging the board, unscrew the screws at the bottom of it, removing the top 2 boards, and switch all JTAG jumpers to “ON”:
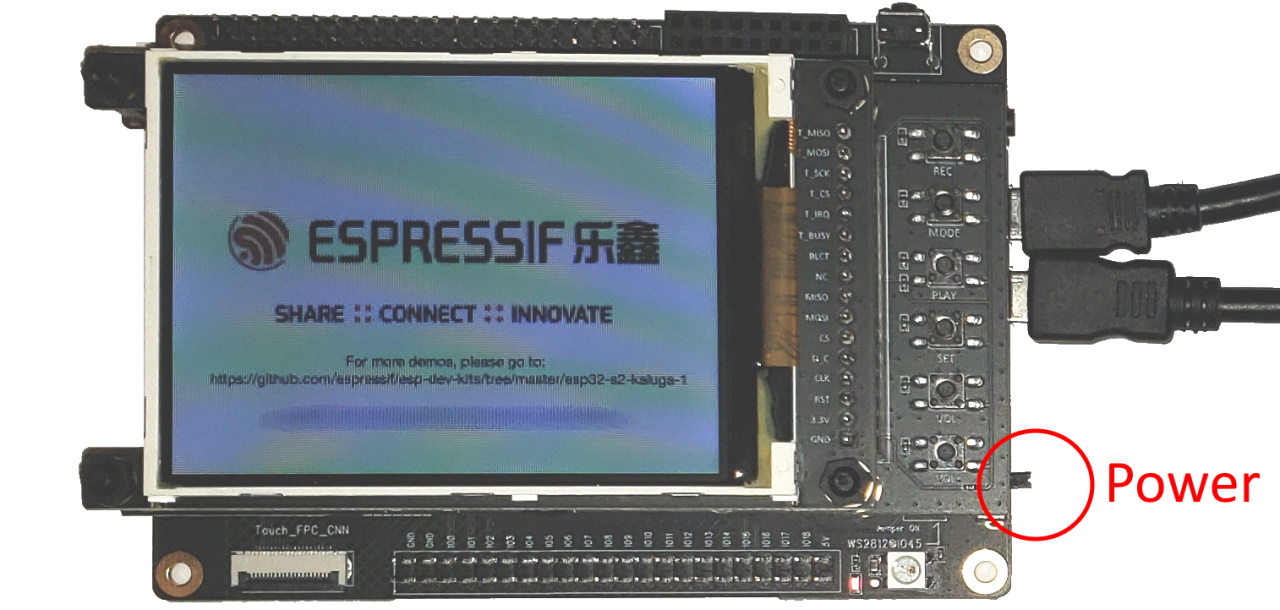
- Connect connect both Power and JTAG USB connectors and wait for the board to start. If it doesn’t start in a couple of seconds, try turning the power on and off:
- Now you can select the ESP32 Devkit on the Debug Method page of the VisualGDB Project Wizard. Make sure the ESP32S2 chip is selected and click “Test” to verify the connection:
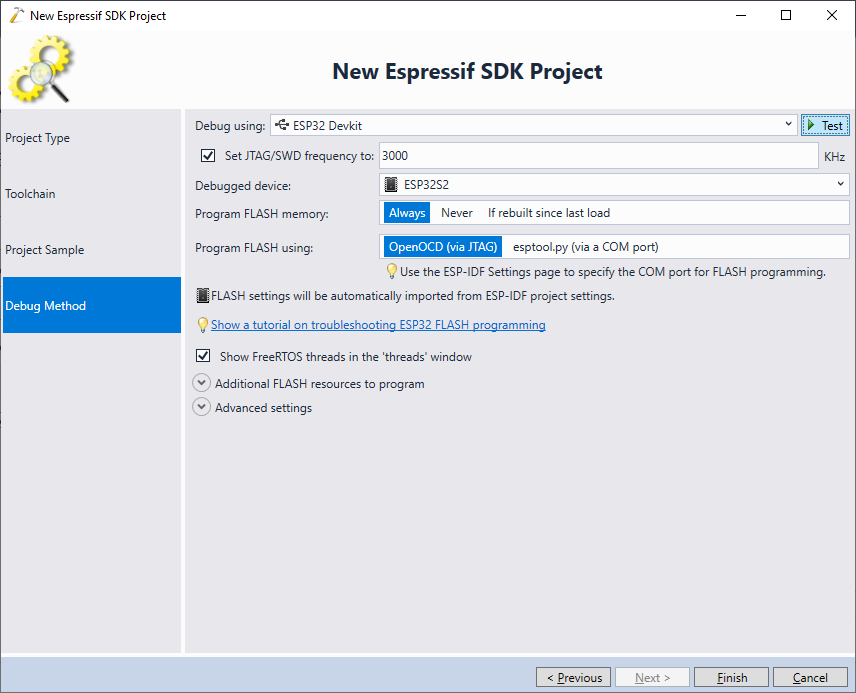
- If the connection is successful, VisualGDB will be able to connect to the device:
 If you have recently erased the ESP32 FLASH memory, you may get the “All Device Registers are zero” message, that can be safely ignored.
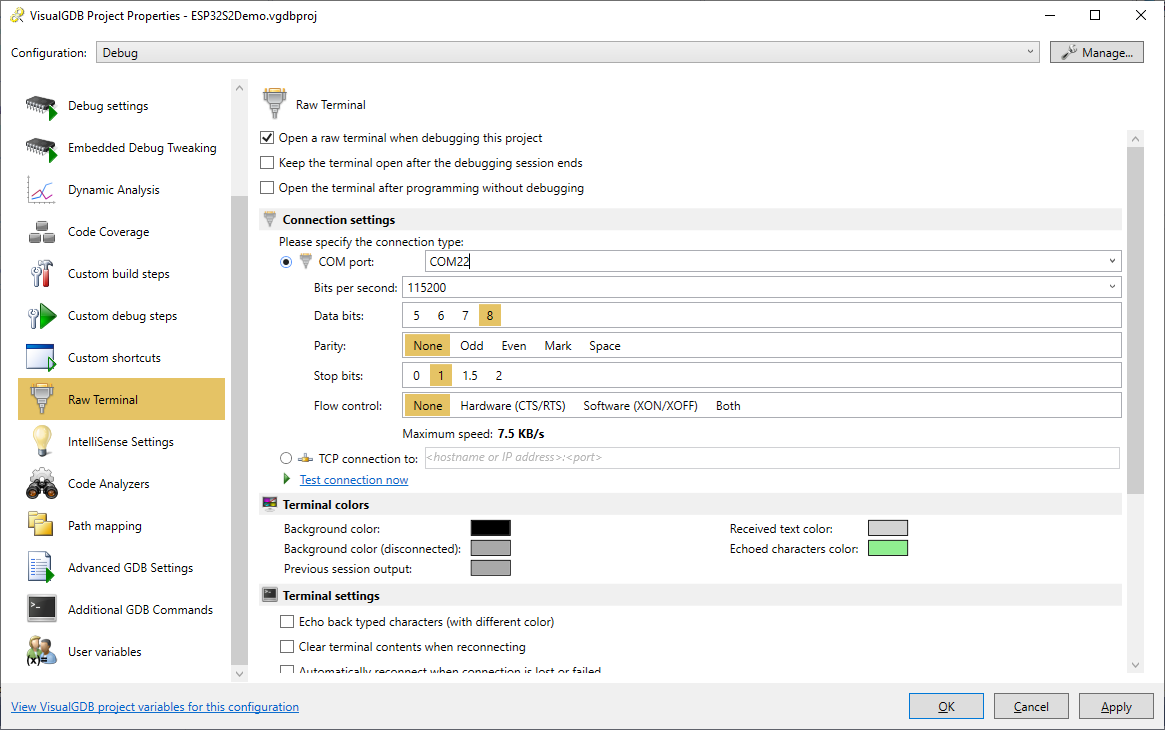
 - If you are using the Custom edition of VisualGDB or higher, you can enable the Raw Terminal via VisualGDB Project Properties to see the output from the board. If not, try using SmarTTY or any other terminal program:
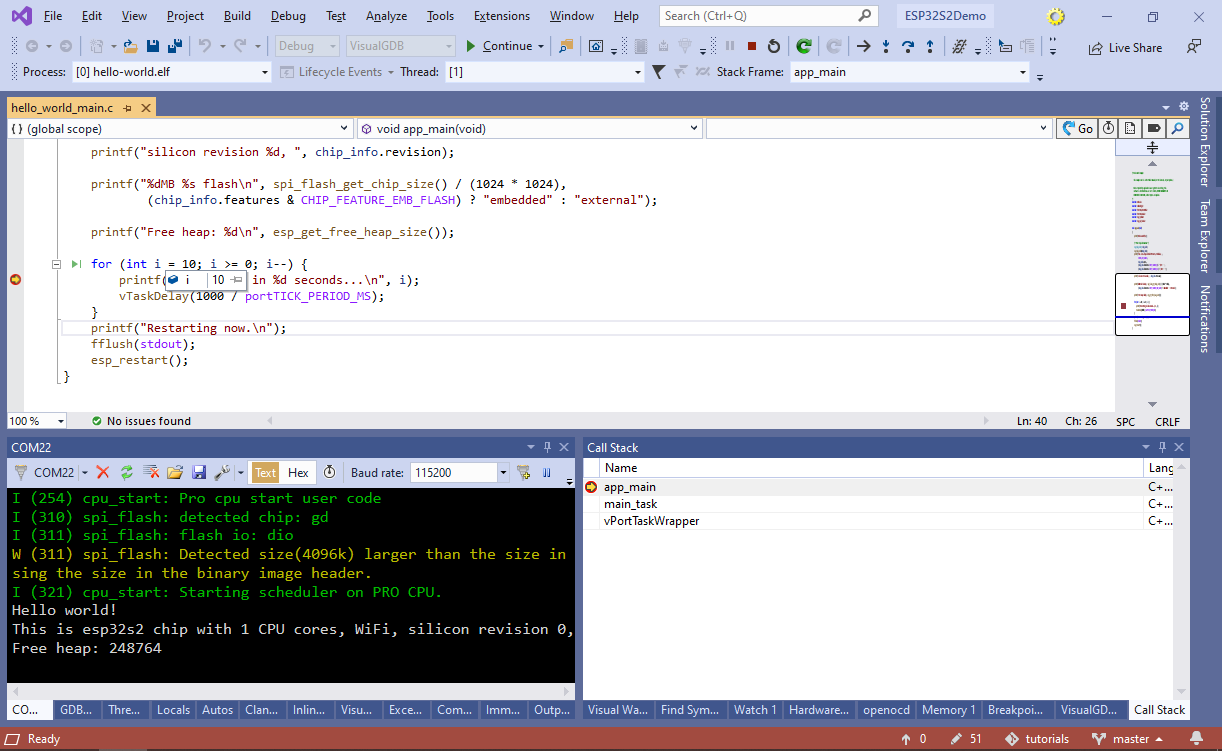
- Set a breakpoint in the for() loop and press F5 to begin debugging. VisualGDB will automatically program the FLASH memory and the breakpoint will trigger. The output from the chip will be shown in the raw terminal:
- You can use the regular Visual Studio functionality to edit and debug the project. VisualGDB will automatically translate any changes you make in Solution Explorer to ESP-IDF-specific constructs, so you won’t need to edit any files manually. You can always change various project settings (including KConfig configuration) via the VisualGDB Project Properties window:
