Debugging ESP8266 firmware with Olimex ARM-USB-OCD-H
This tutorial shows how to use the inexpensive Olimex ARM-USB-OCD-H adapter to debug ESP8266 firmware using VisualGDB and Visual Studio. Before you begin, install VisualGDB 5.0 or later.
Update: our latest ESP8266 toolchain includes an improved OpenOCD port for ESP8266 that is more stable than the xt-ocd tool described here. Please follow this tutorial for detailed instructions on using it.
- Setup your JTAG connection as described in the basic ESP8266 tutorial, however leave the reset pin unconnected:
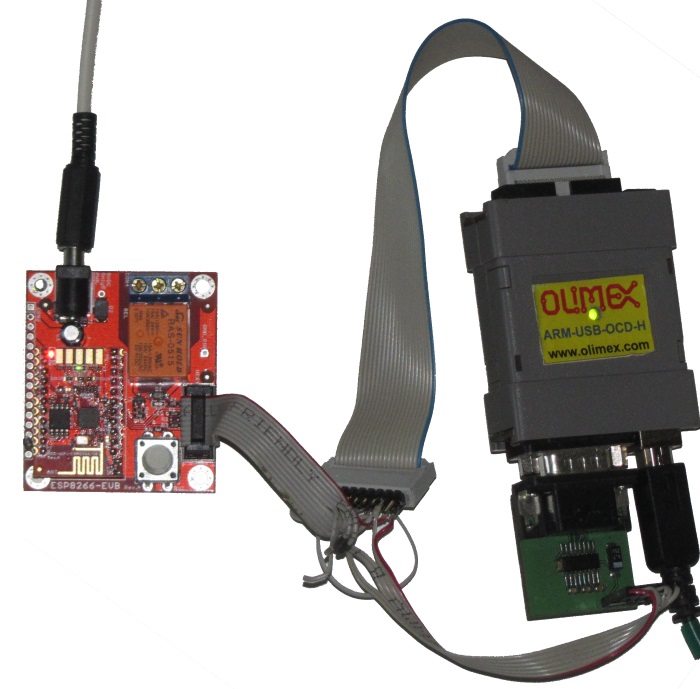 If you connect the reset pin, the ESP8266 GDB stub will not be able to recognize the core correctly and the debugging won’t work. In order to work around this bug, the reset should be left unconnected and the device should be reset manually (e.g. by plugging it out and back in) before each debugging session.
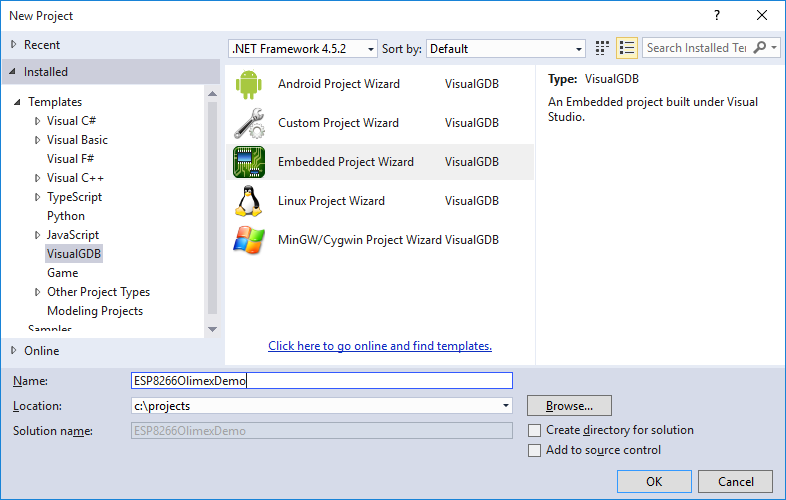
 - Start Visual Studio and launch the VisualGDB Embedded Project Wizard:
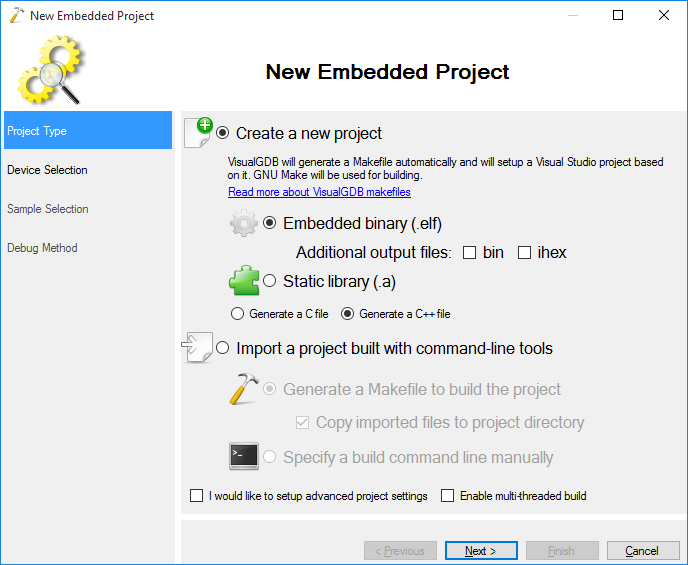
- Uncheck the “bin” checkbox to avoid generating an extra .bin file (ESP8266 debugging plugin will generate a set of .bin files automatically):
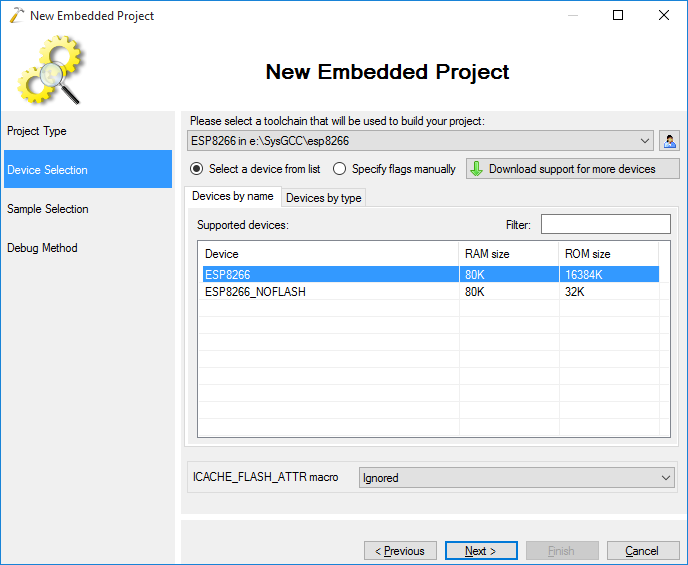
- Select the ESP8266 toolchain and the device from the list:
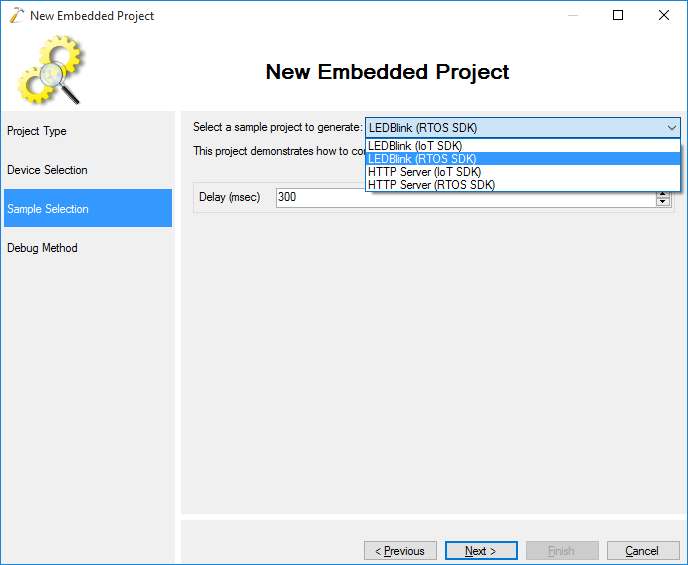
- In order to keep things simple while testing the JTAG functionality we will use the basic LEDBlink sample that does not involve any WiFi functionality:
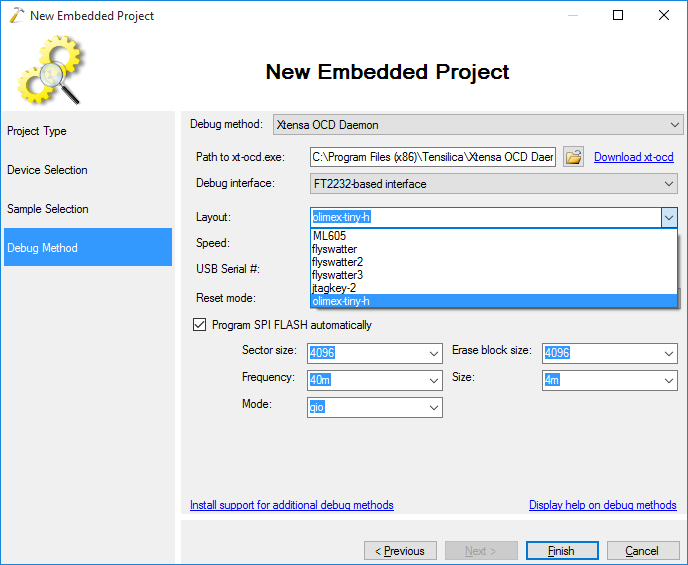
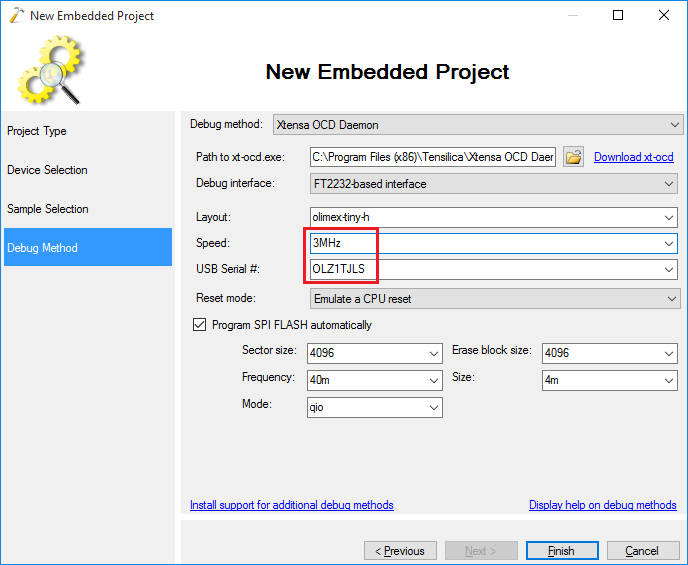
- On the last page of the wizard select the FT2232-based interface and pick the olimex-tiny-h layout:
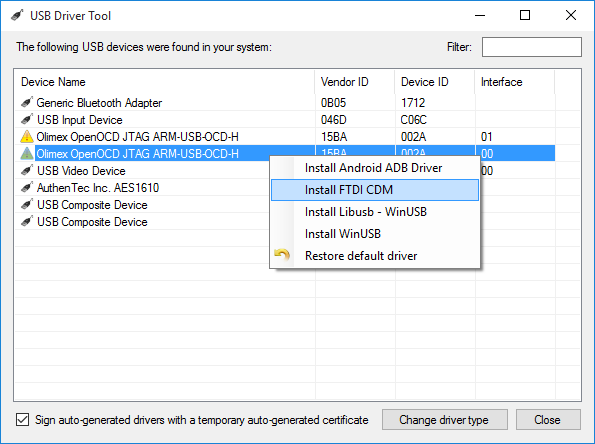
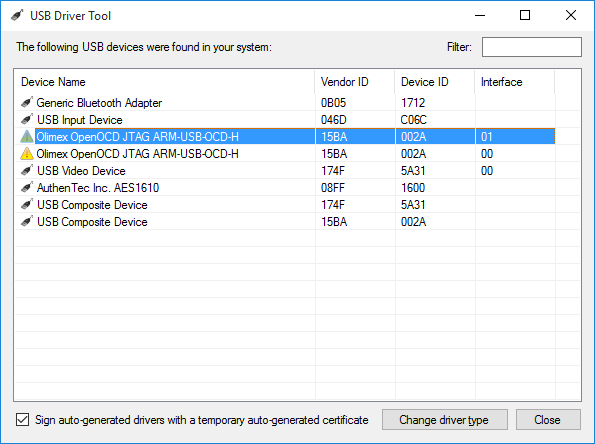
- The Xtensa OCD Daemon does not support the ARM-USB-OCD-H programmer, however it supports a similar olimex-tiny-h programmer, that has identical hardware, but a different ID. We will now show how to change the ID of the ARM-USB-OCD-H programmer to make it compatible with the Xtensa OCD Daemon. Download and launch USBDriverTool, connect your Olimex programmer and install the FTDI CDM driver for both interfaces:
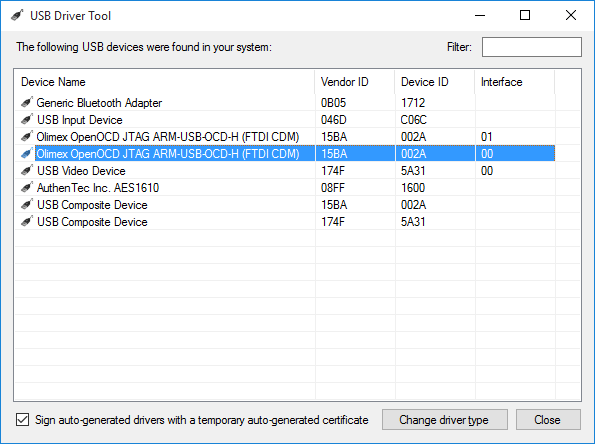
- Ensure that the driver is installed successfully for both interface 00 and 01:
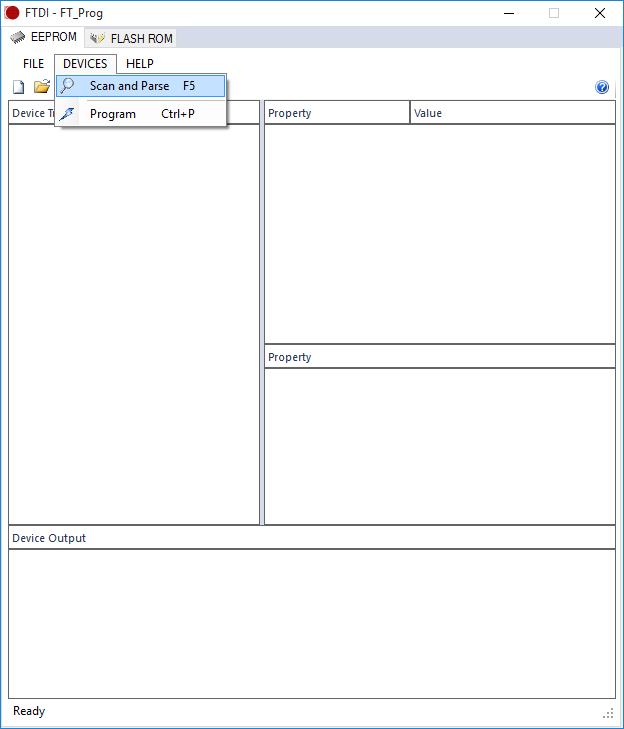
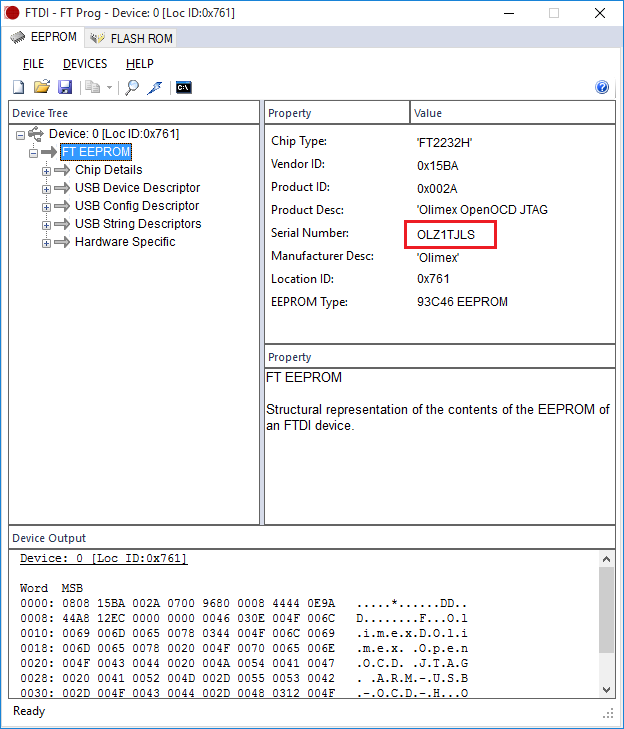
- Download, install and launch FT_Prog. Then select “Scan and Parse” to populate the device list:
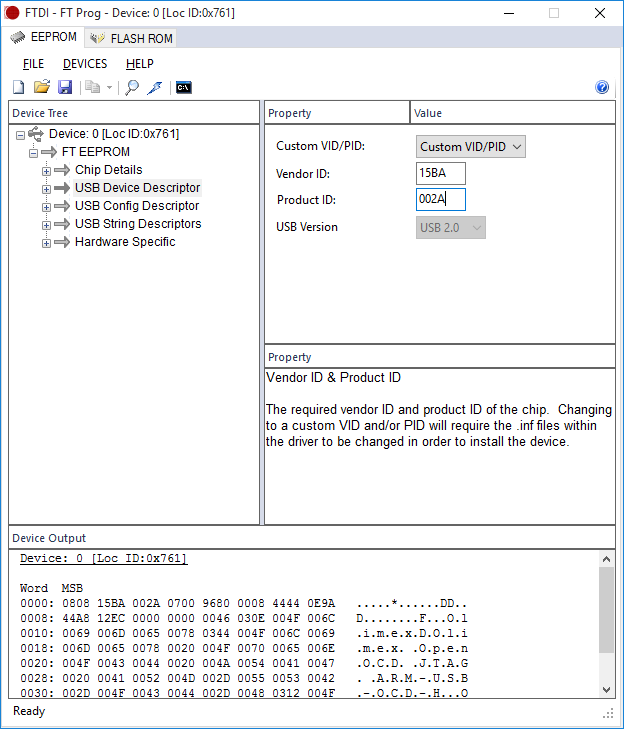
- We will now use FT_Prog to change the product ID of the Olimex USB-OCD-H device. Ensure that the vendor ID is set to 15BA and set the product ID to 002A:
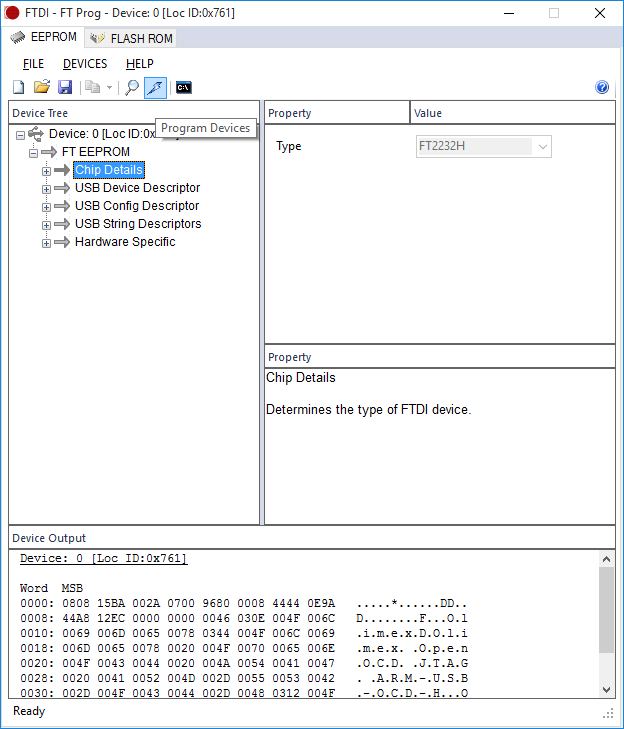
- Click the “Program Devices” button:
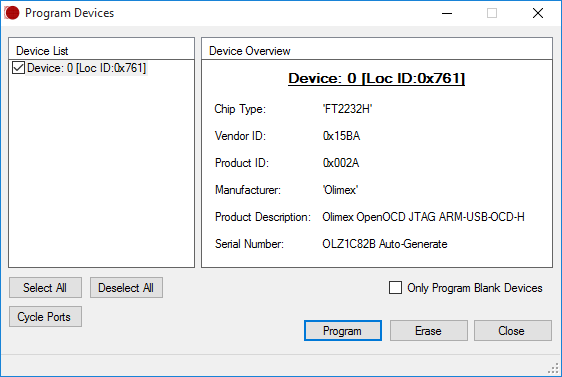
- Finally press the “Program” button to apply the changes:
- Once the programming is complete, reconnect the device. As the ID has been changed, the drivers won’t be installed anymore:
- Install the FTDI CDM driver for both interfaces and use the FT_Prog tool to find the serial number of the device:
- Go back to VisualGDB Embedded Project Wizard and enter the serial number observed in FT_Prog. Also lower the speed to 3MHz:
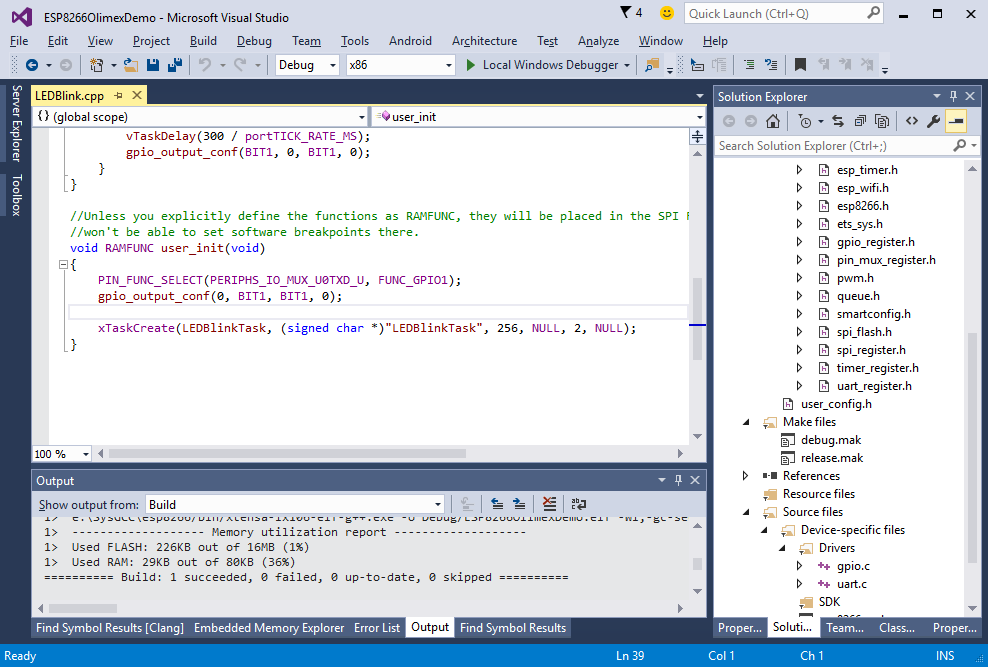
- Press “Finish” to generate the project. Build it with Ctrl-Shift-B:
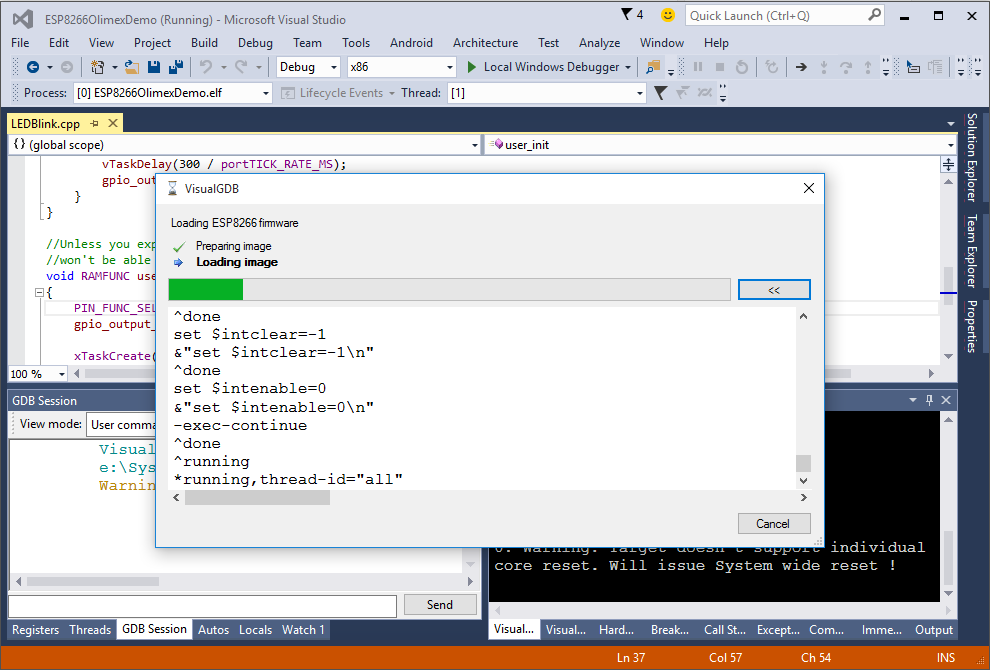
- Now you can start debugging by pressing F5. Observe how VisualGDB programs the SPI FLASH:
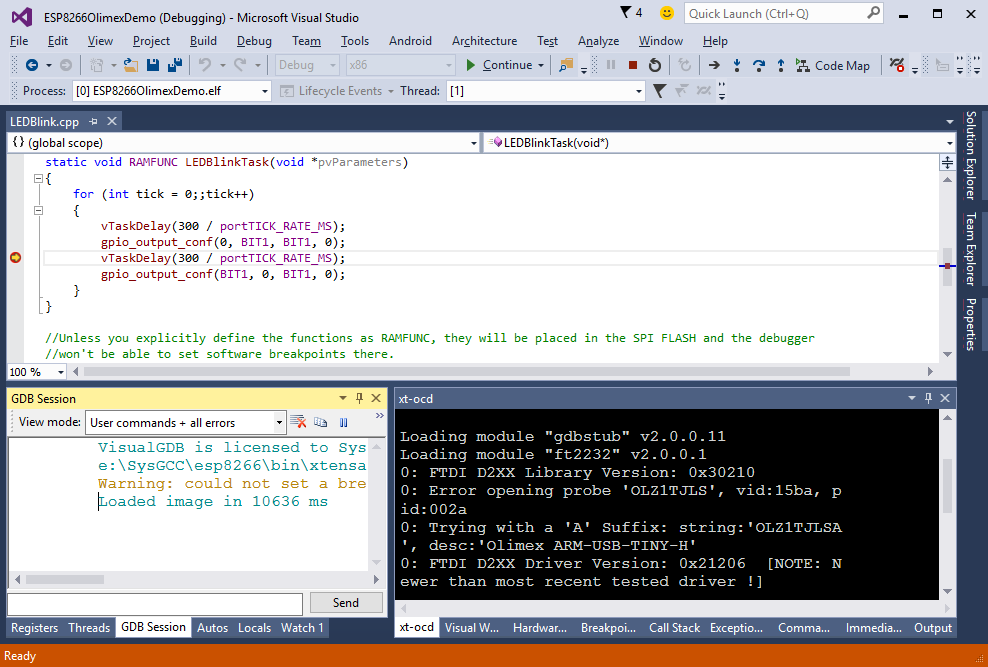
- Now you can try setting breakpoints in your code. If the debugging does not work, observe the xt-ocd output for information about the encountered problems. Note that the “Error opening probe … trying with ‘A’ suffix” message is normal:
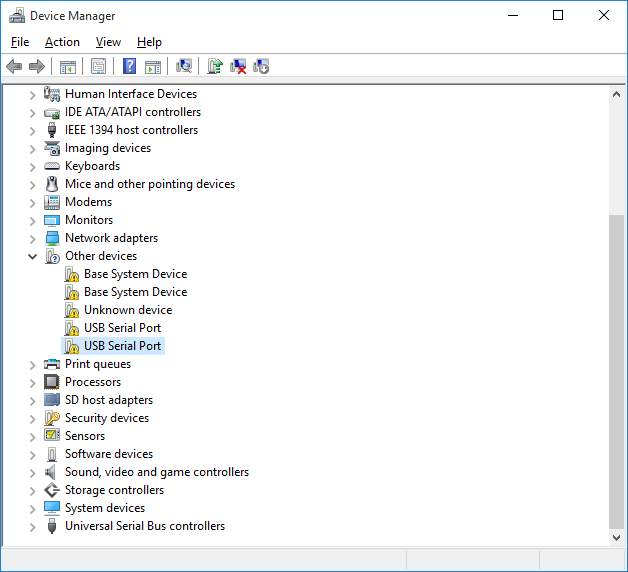
- If you have connected the serial port on the ESP8266 device to the serial port of the Olimex ARM-USB-OCD-H like described in this tutorial, you need to install the USB serial port driver in order to view the output from the COM port. Locate the serial port in Device Manager:
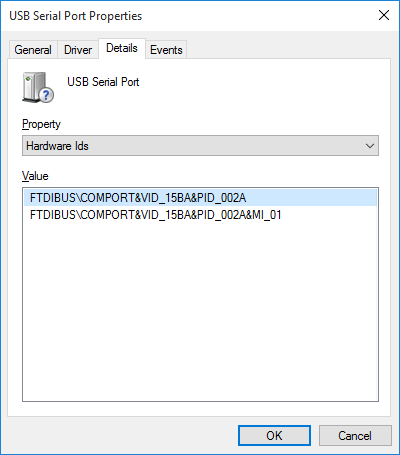
- Check device properties to find the serial port corresponding to interface 01 (it will have &MI_01 at the end of the last hardware ID):
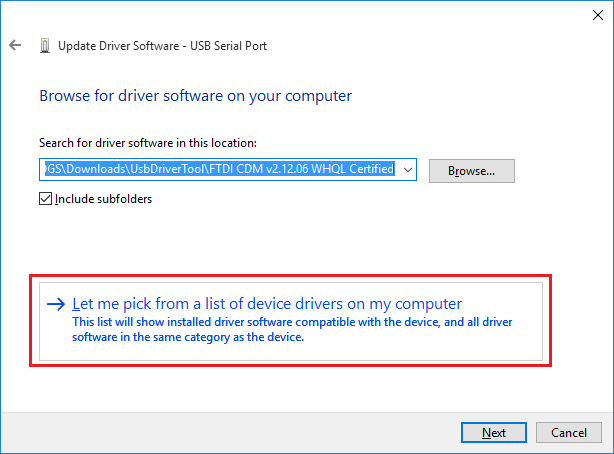
- Start updating the drivers for that COM port and select “Let me pick a list of device drivers”:
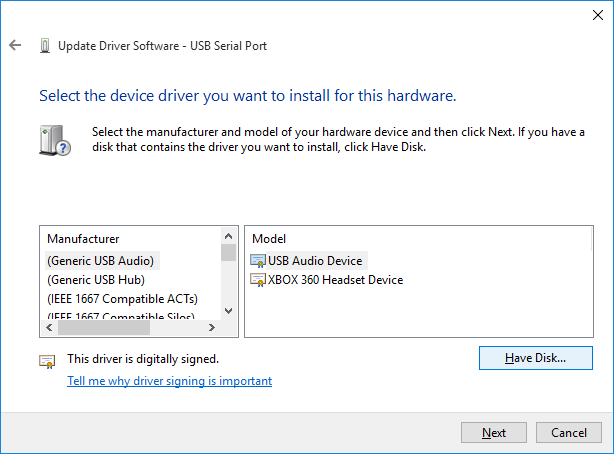
- Click “Have disk” and specify the FTDI CDM driver directory under the directory where you have extracted USBDriverTool:
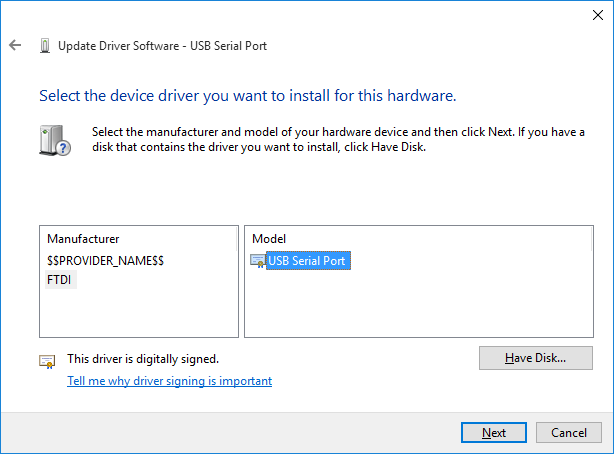
- Select the USB Serial Port driver from the list:
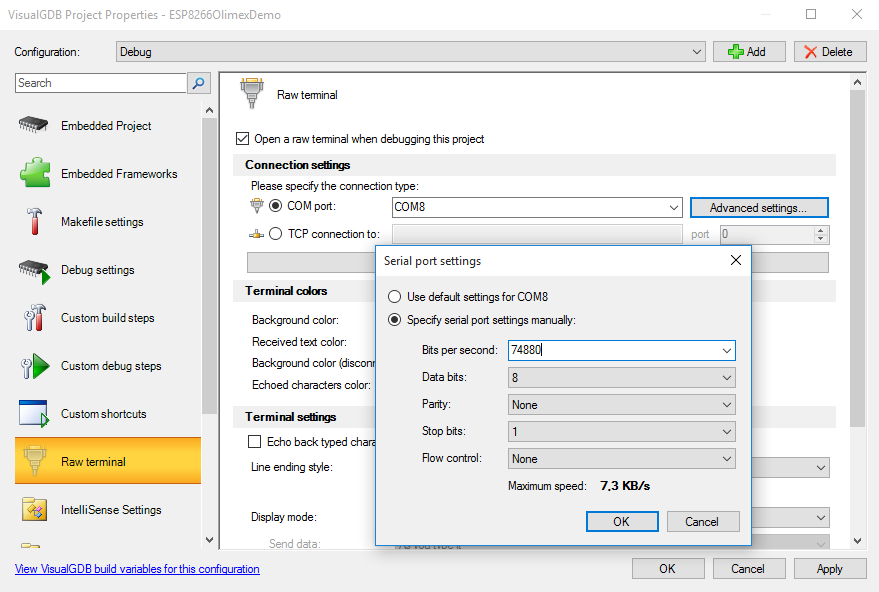
- Finally go to VisualGDB Project Properties and enable the Raw Terminal on the newly installed COM port. Ensure you specify the correct baud rate:
- Once the Raw Terminal is enabled, you will see the output from the COM port inside Visual Studio once you start debugging. See this tutorial for an example of reading the output from the COM port.


