Debugging ESP8266 projects built with RTOS SDK 3.x
This tutorial shows how to debug ESP8266 projects that are using the new RTOS SDK 3.x. The new SDK introduces multiple improvements compared to the 2.x branch and is based on a highly configurable ESP-IDF framework used for the ESP32 chip, however getting a reliable debugging experience with it requires a few configuration steps and this tutorial provides a detailed overview of them.
Before you begin, install Visual Studio and VisualGDB 5.4 or later.
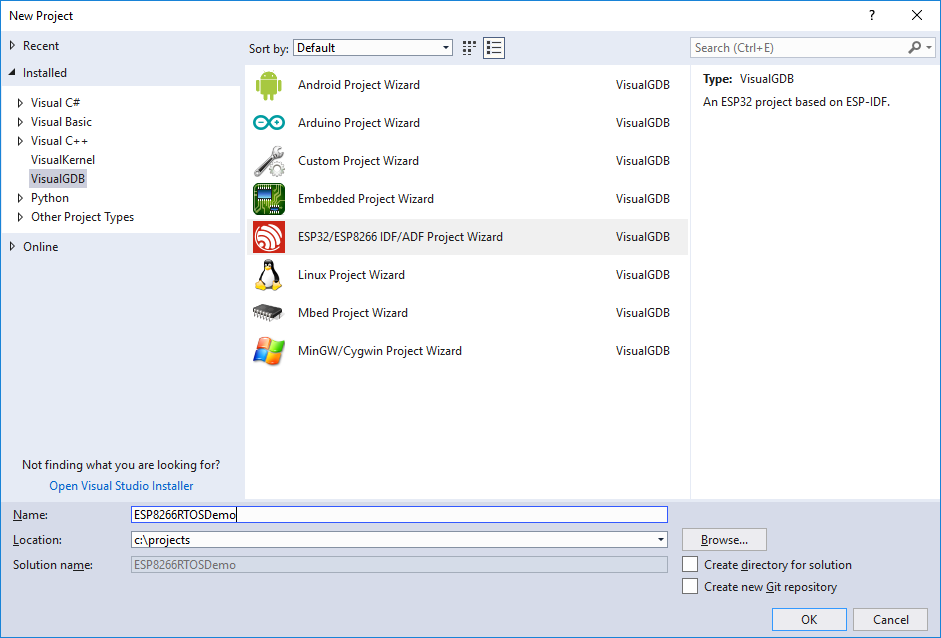
- Start Visual Studio and launch the VisualGDB ESP-IDF Project Wizard:
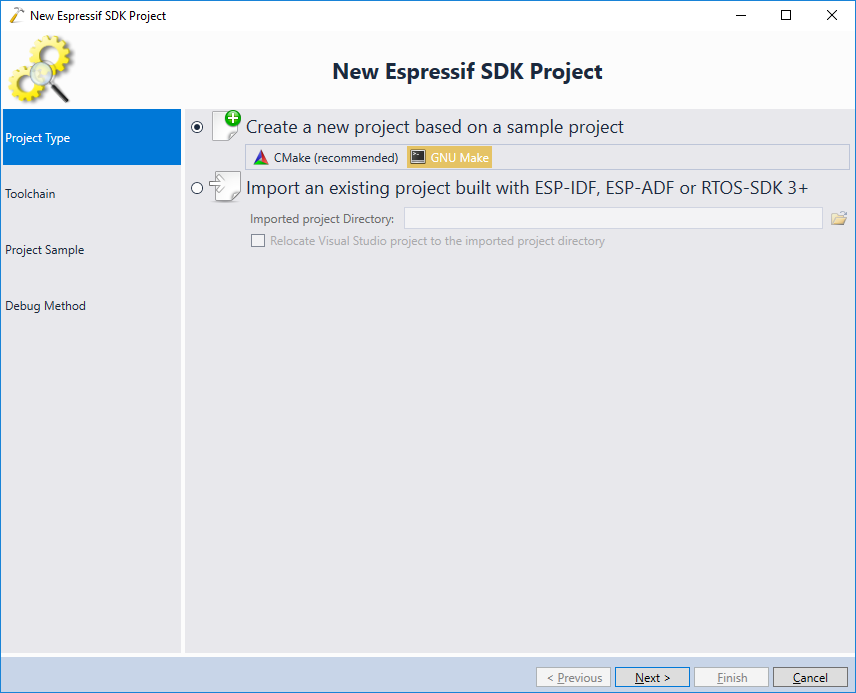
- As of June 2019, the ESP8266 RTOS SDK does not support CMake yet, so select “GNU Make” on the first page of the wizard:
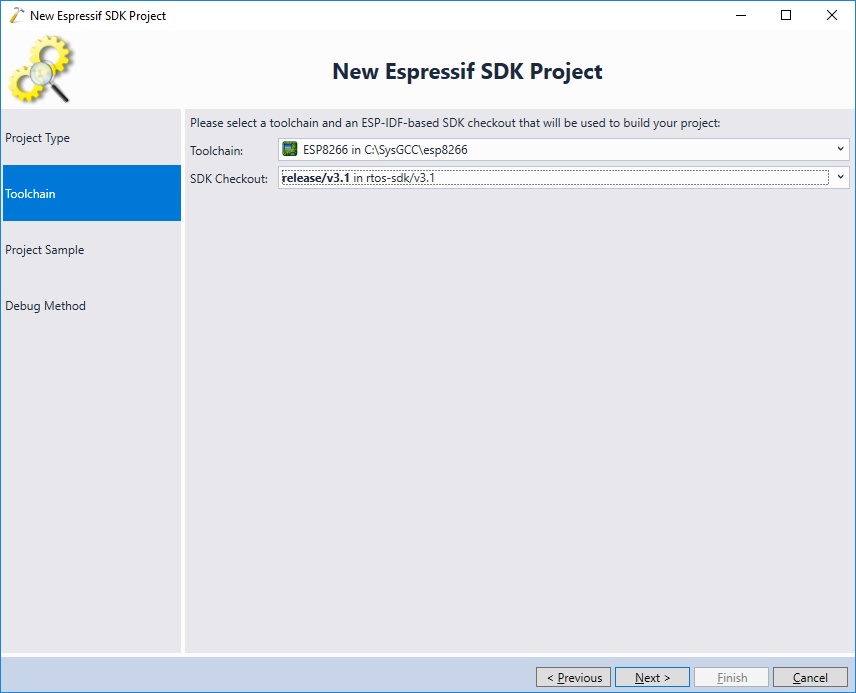
- On the next page, choose your toolchain and the SDK checkout. We recommend using the latest stable SDK release, i.e. 3.1:
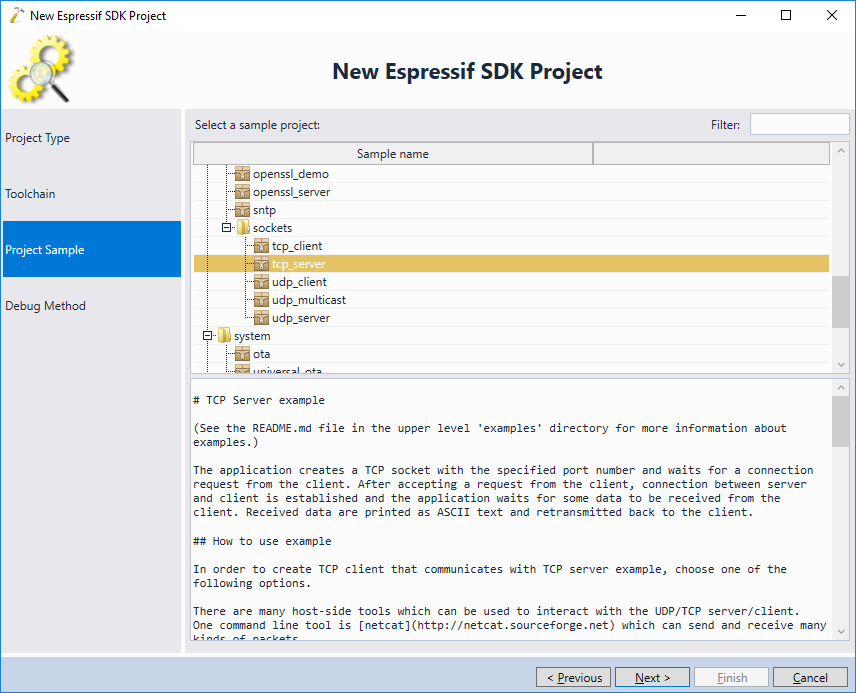
- On the next page select a sample project you would like to clone. In this tutorial we will use the tcp_server project that connects to a Wi-Fi network and creates a basic TCP server:
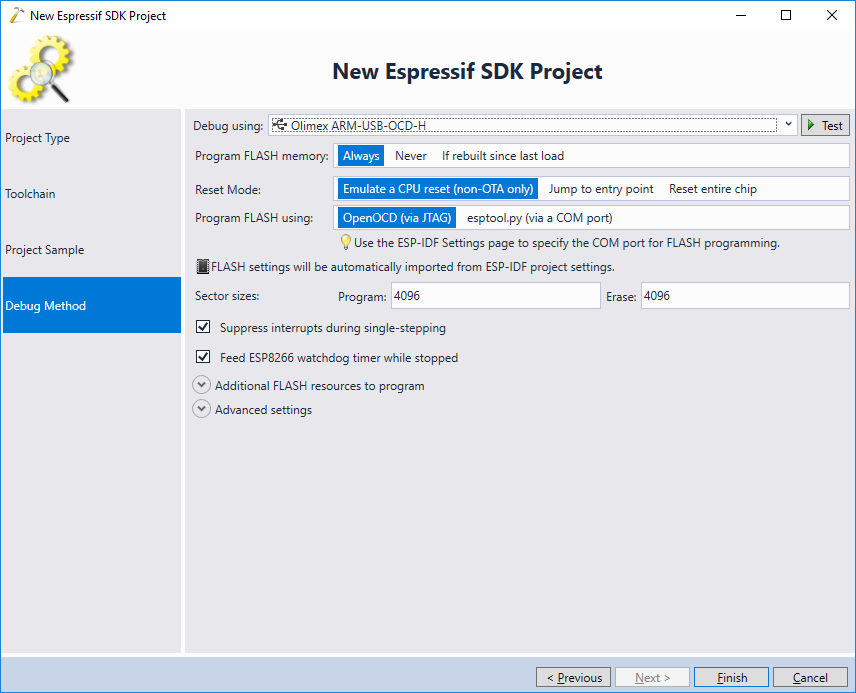
- Finally, choose a debug method compatible with your device. You can find out the JTAG wiring examples for popular ESP8266 boards by looking through other ESP8266 tutorials:
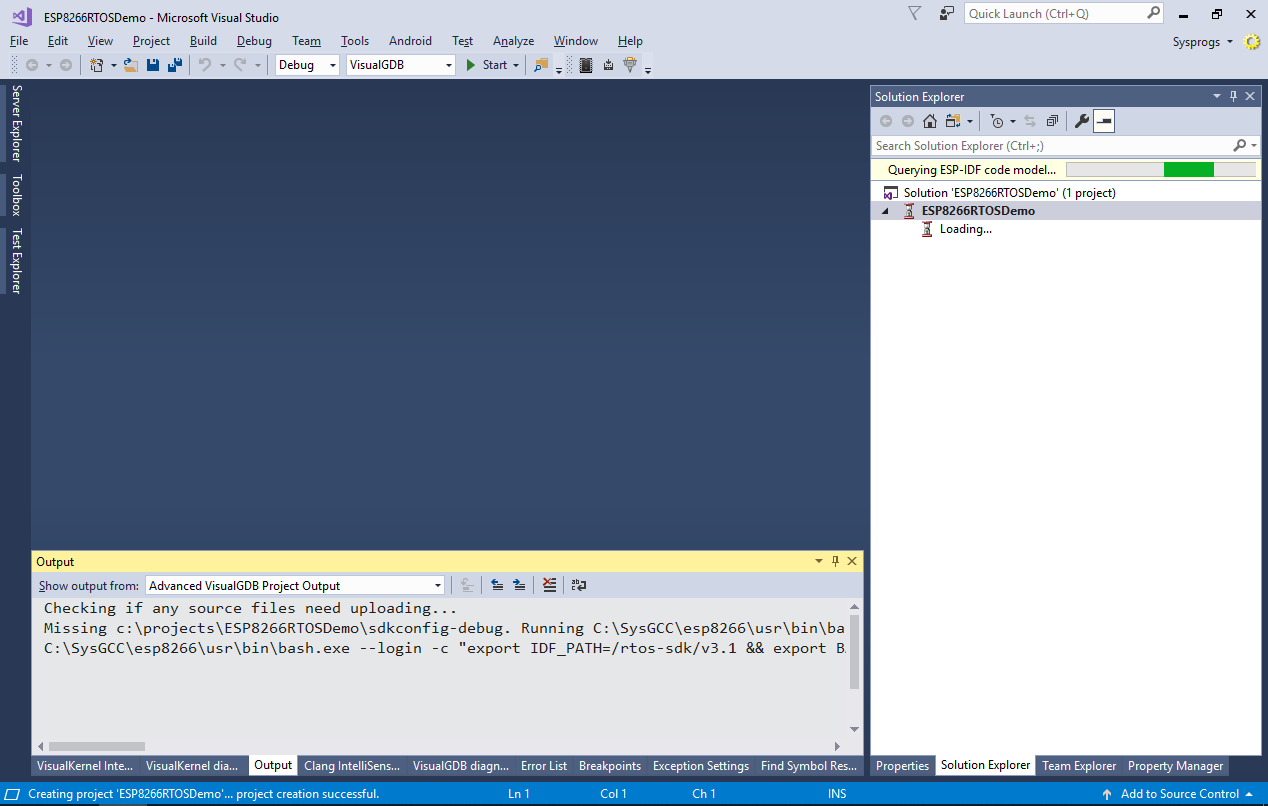
- Press “Finish” to generate the project. VisualGDB will clone the selected sample and will start querying the precise project structure from the RTOS SDK build scripts:
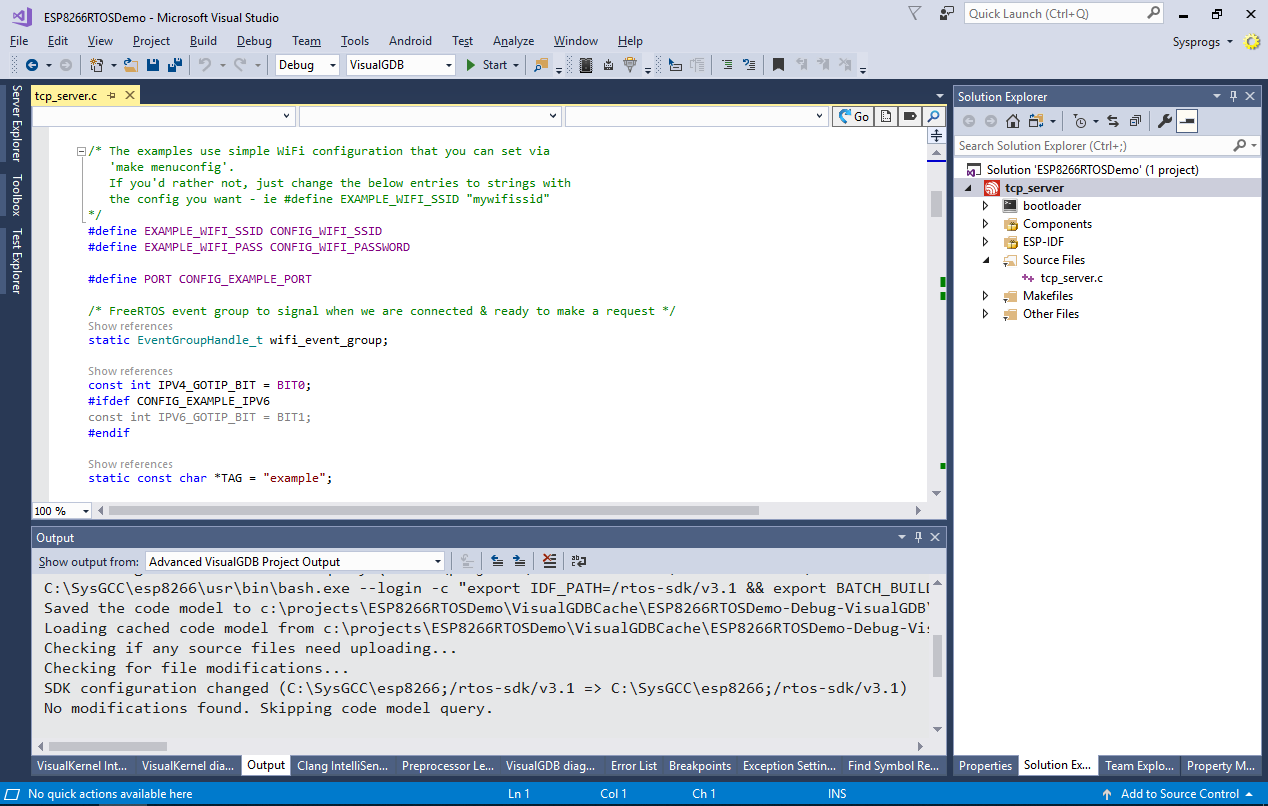
- Once the project structure is queried, VisualGDB will display it in Solution Explorer. Open the main source file and go to the beginning of it to see how the Wi-Fi SSID and password used by the example are defined:
- The example takes the SSID and password from the CONFIG_WIFI_SSID and CONFIG_WIFI_PASSWORD macros that are provided by the KConfig tools. You can edit them via VisualGDB Project Properties -> ESP-IDF Project -> ESP-IDF Configuration -> Example Configuration:
 Press OK to save your changes and then hit F5 to build the project and start debugging it.
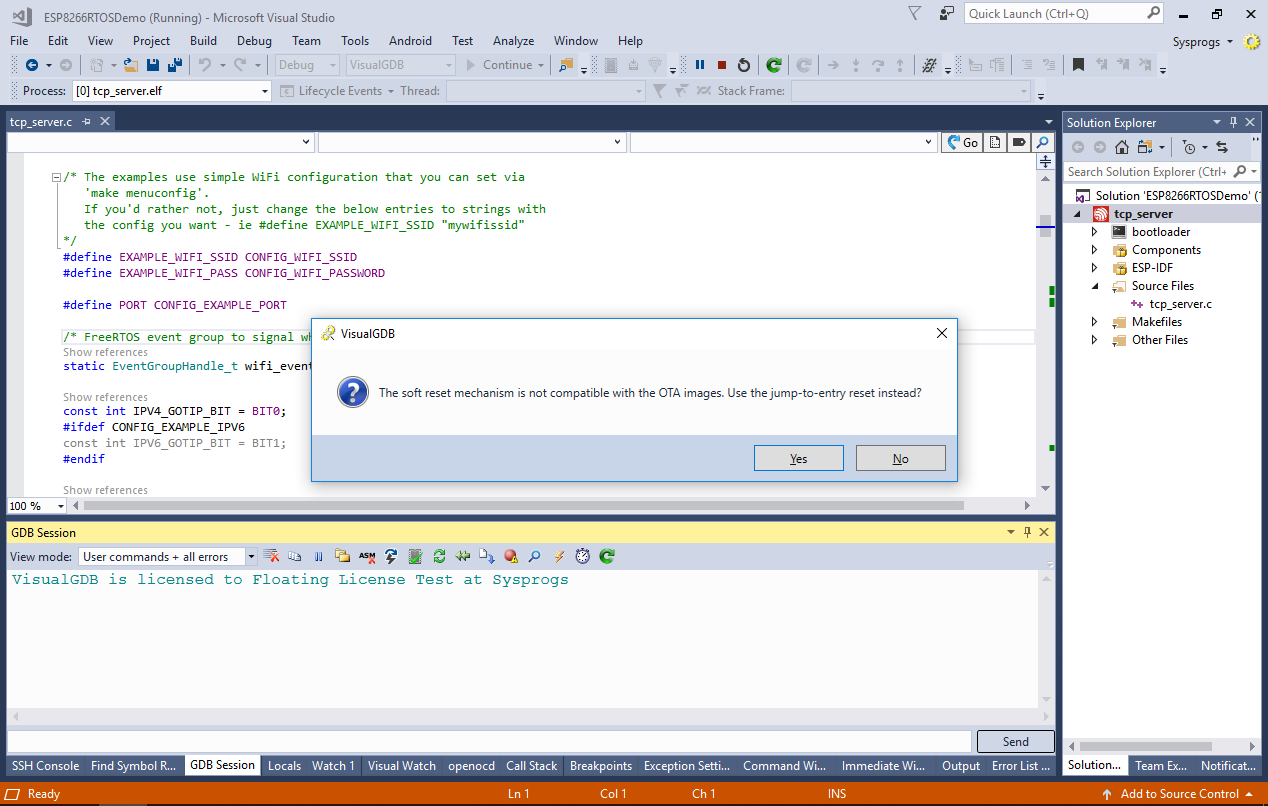
 - Normally, VisualGDB will use the soft reset mechanism for ESP8266 devices (manually jumping to the entry point) so that the breakpoints it sets will not be overwritten, however due to the internal logic of the RTOS SDK 3.0, this will not work and VisualGDB will show a warning about it:
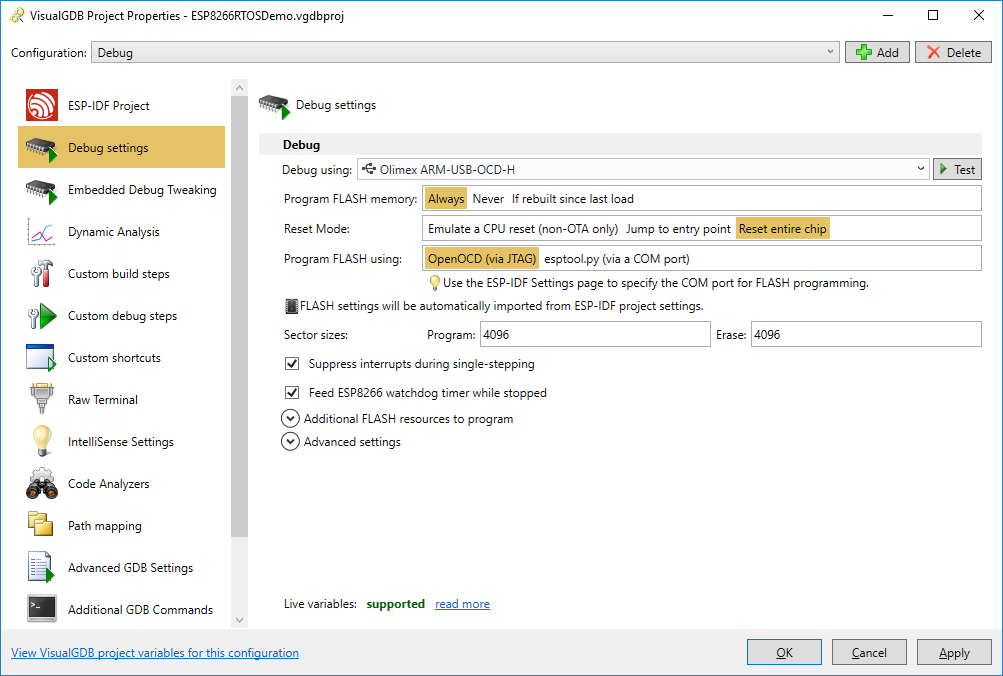
- In order to get debugging to work, change the Reset Mode on the Debug Settings page of VisualGDB Project Properties to “Reset entire chip”:
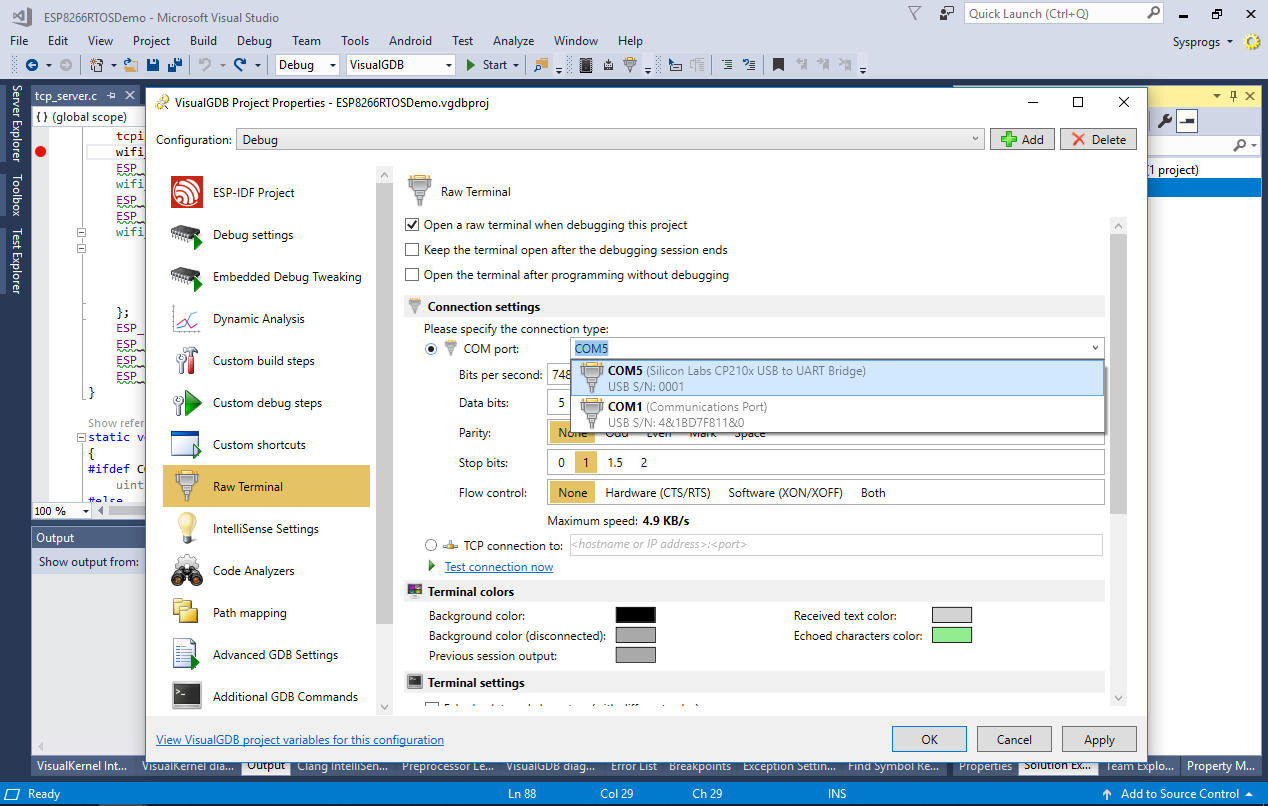
- If you are using VisualGDB Custom Edition or higher, open the Raw Terminal page of VisualGDB Project Properties and configure VisualGDB to connect to your board’s COM port (use the baud rate of 74880). If not, use any other terminal application instead:
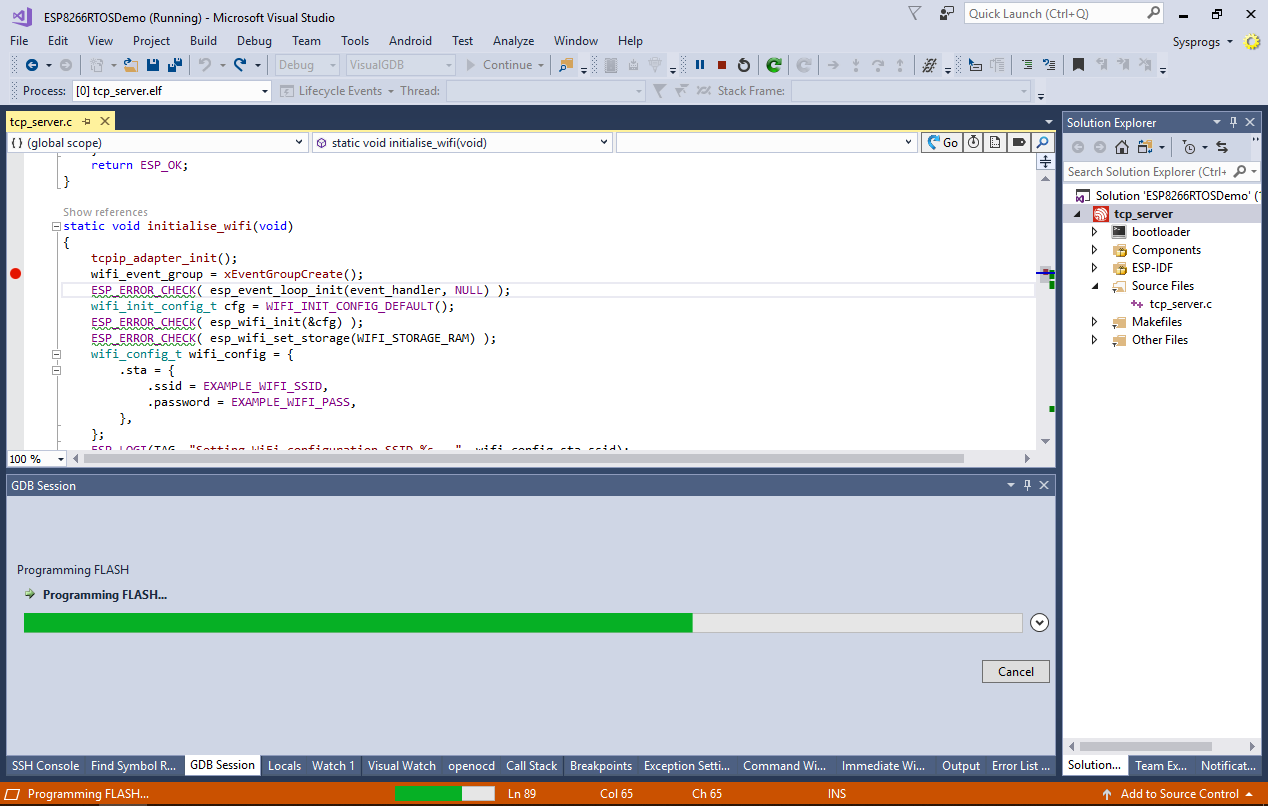
- Set a breakpoint in the initialise_wifi() function and press F5 to start debugging. VisualGDB will automatically program the FLASH memory via JTAG and will then start your program:
- Once the program is started, the breakpoint will hit:

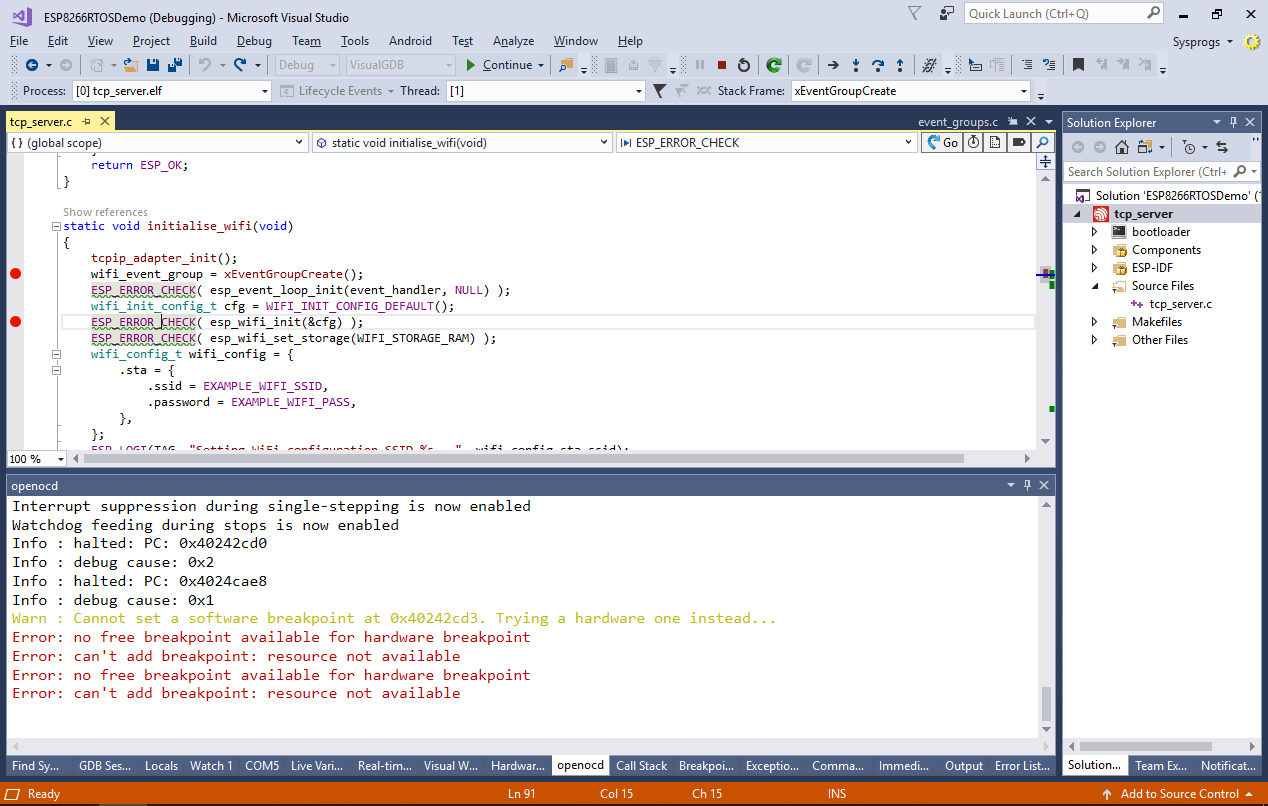
- The ESP8266 chip has considerably fewer debugging resources than the newer ESP32 chip. E.g., it only supports 1 hardware breakpoint. Hence setting more than one breakpoint inside the FLASH memory will not work:
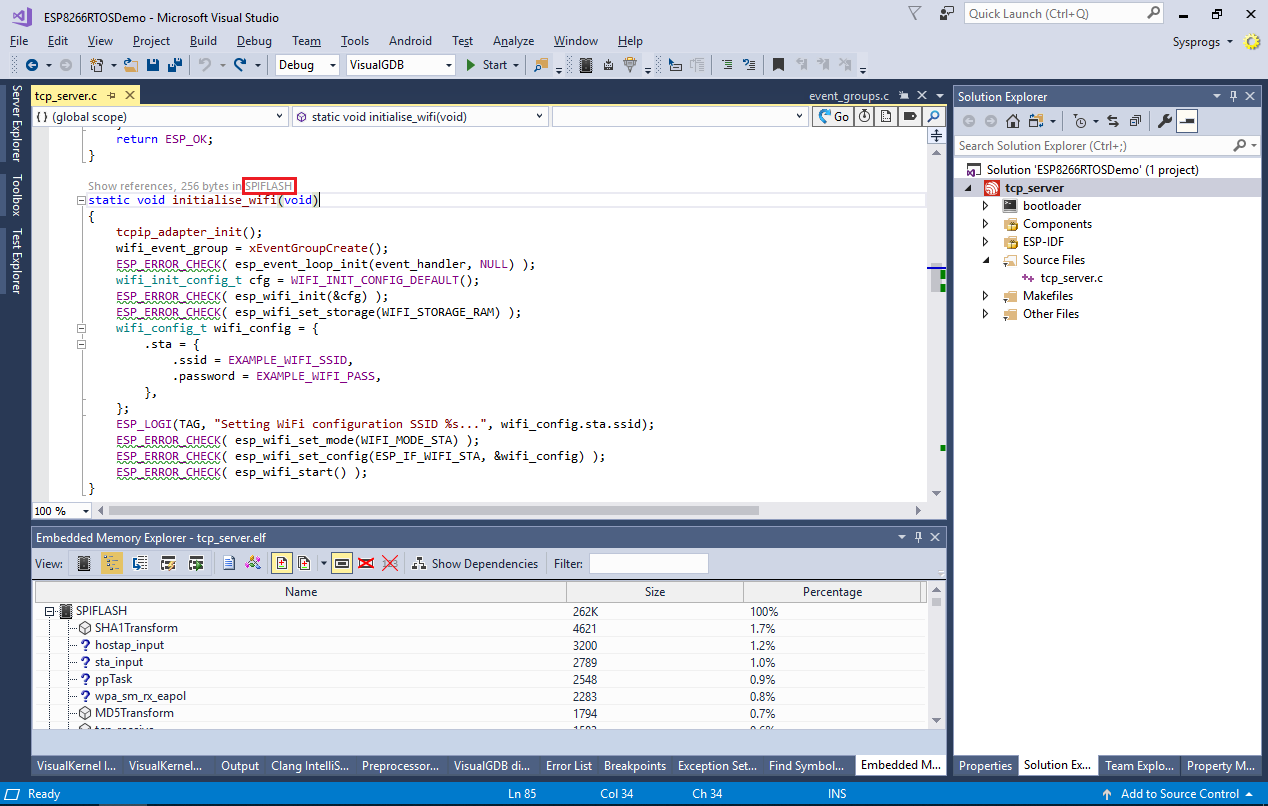
- To work around this, you can mark the functions you would like to debug with the IRAM_ATTR macro to move them to instruction RAM. Before we proceed with that, open the View->Embedded Memory Explorer window and switch it to the detailed view to confirm that the initialise_wifi() function is placed into the FLASH memory:
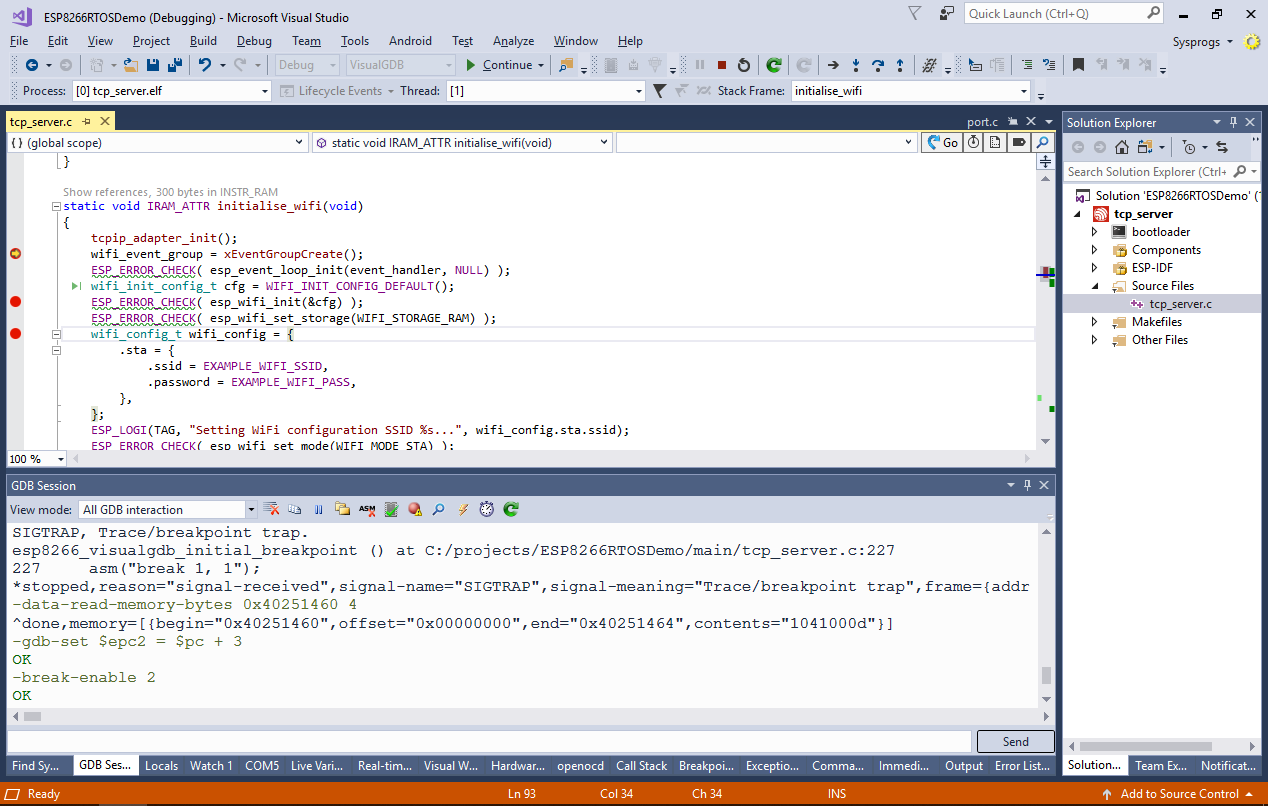
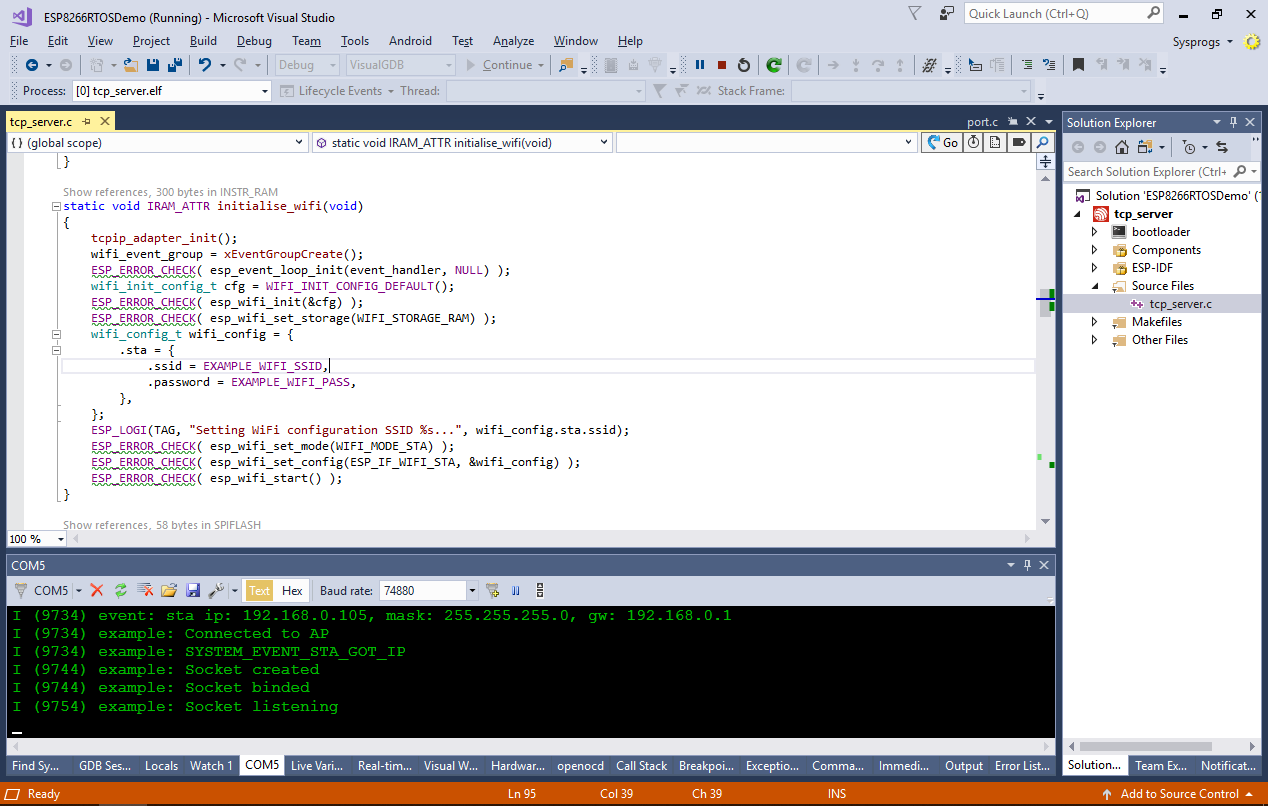
- Add the IRAM_ATTR macro to the function definition and build the project again. Confirm that the function got moved into the instruction RAM:

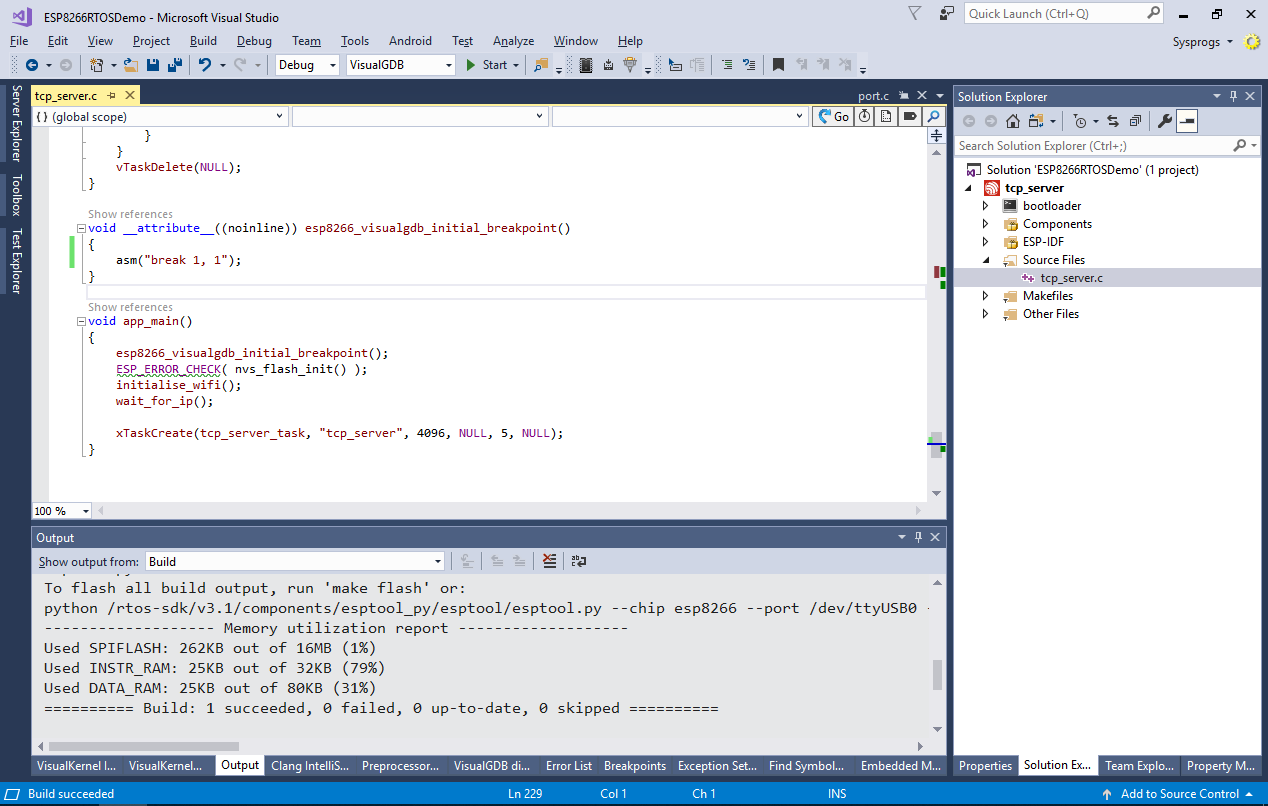
- The ESP8266 chip does not provide a reliable mechanism for stopping it after a reset, hence normally VisualGDB would not be able to insert the breakpoints into the RAM before the initialization code gets executed. To work around this, add the following function to your code and call it from main():
void __attribute__((noinline)) esp8266_visualgdb_initial_breakpoint()
{
    asm("break 1, 1");
}
- This function will trigger a manual breakpoint when the program is initialized. The esp8266_visualgdb_initial_breakpoint name will get recognized by VisualGDB, so it will update all breakpoints and automatically continue executing the program. Press F5 to start another debugging session and confirm that the breakpoints in initialise_wifi() now work:
- Once the Wi-Fi logic is initialized, check the output from the ESP8266’s COM port for the IP address assigned to the device:
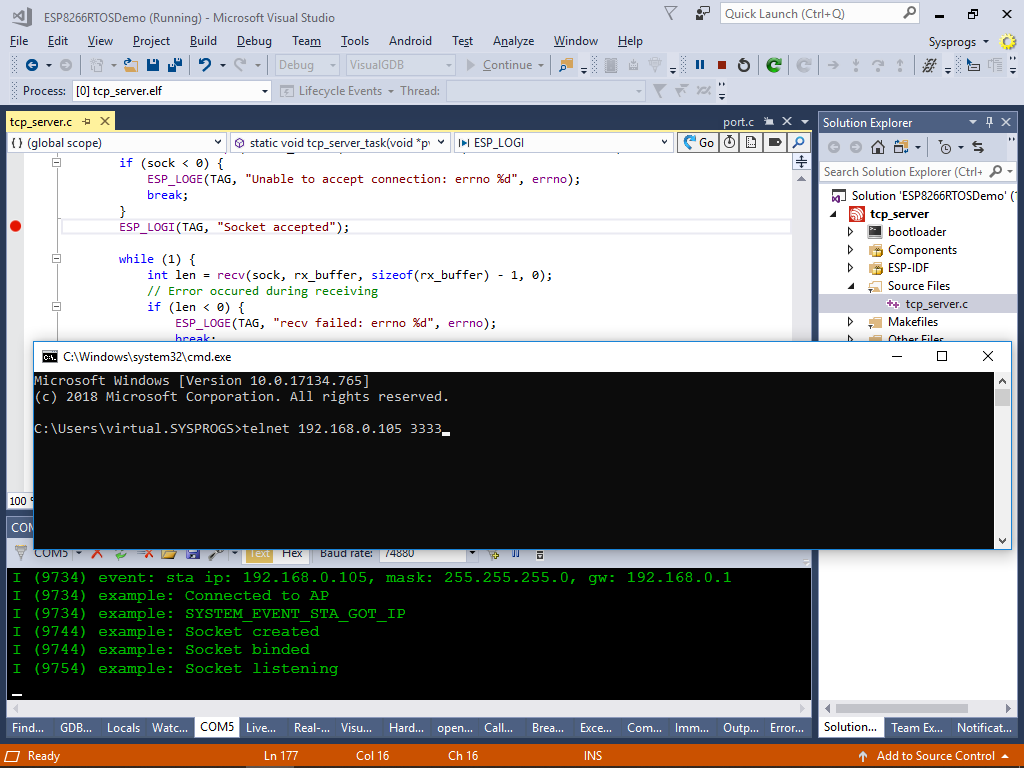
- Set a breakpoint inside the tcp_server_task() function just before it starts the recv() loop and connect to port 3333 of the IP address reported by the board:
- The breakpoint will now trigger and you will be able to debug your program. Remember to mark the function as IRAM_ATTR if you are intending to put more than one breakpoint in it:

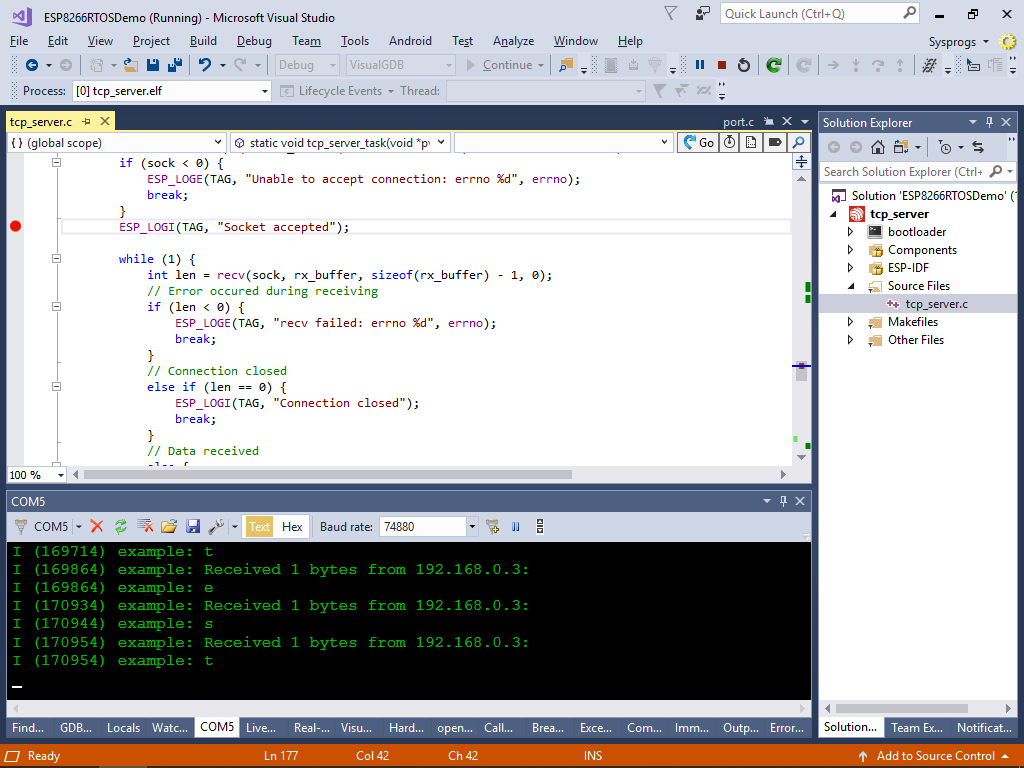
- Enter some text in the telnet window and check that the board reports it in the debug output via the COM port:
 When you are done debugging, press Shift-F5 to end the session.
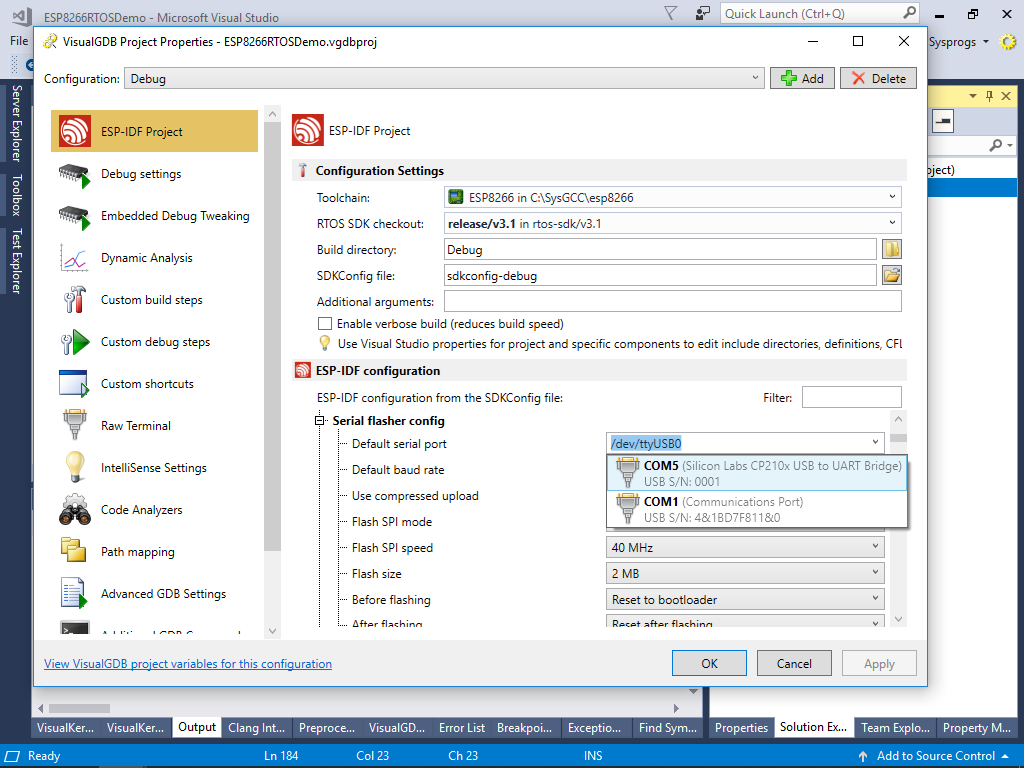
 - Normally, VisualGDB will automatically program the FLASH memory on your ESP8266 board via JTAG, however if this doesn’t work reliably, you can configure it to use the Espressi’f esptool.py script to program the memory via a COM port. This can be done by selecting the COM port of the board via VisualGDB Project Properties -> ESP-IDF Project -> ESP-IDF Configuration -> Serial flasher config -> Default serial port:
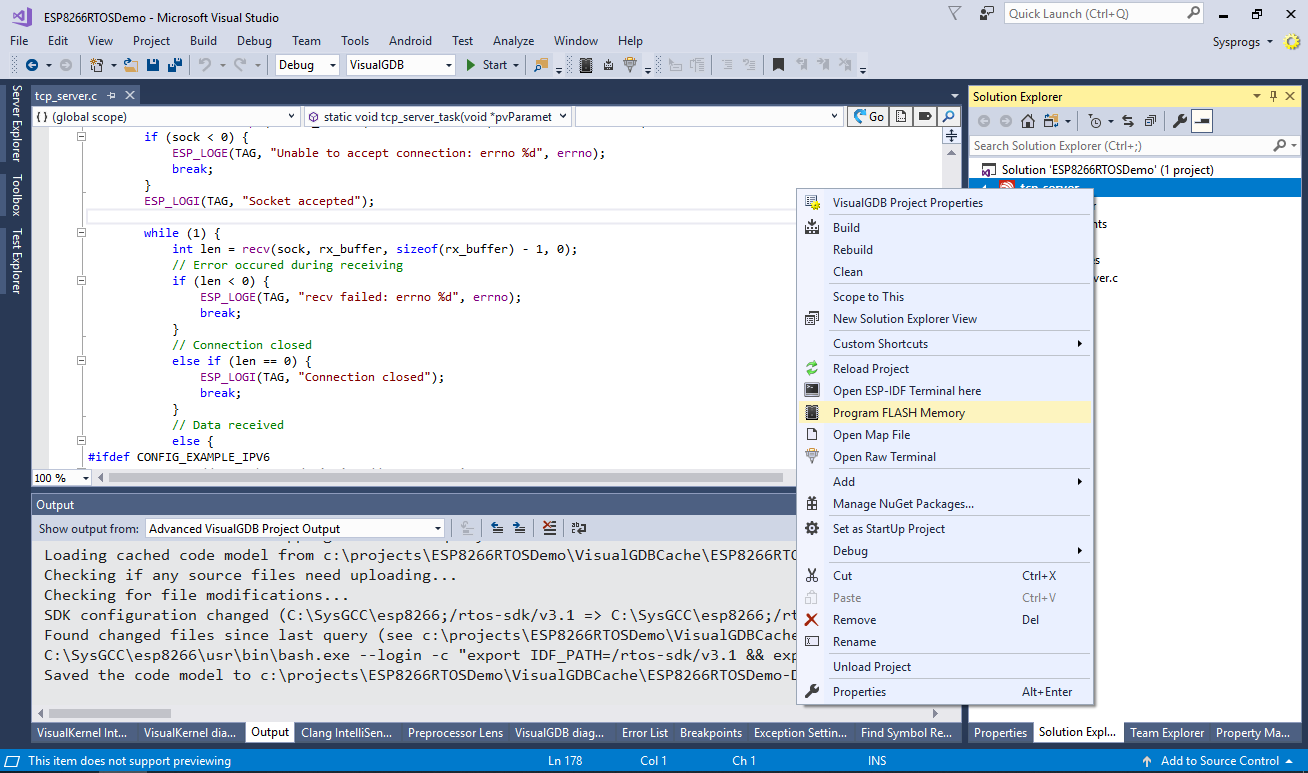
- Then right-click on the project in Solution Explorer and select “Program FLASH memory” to launch the esptool.py script automatically: