Configuring Symbol Loading Behavior for Linux Projects
This tutorial shows how to speed up debugging of Linux projects by controlling which of the shared library symbols will get loaded automatically. We will also show how to automatically strip debug symbols from the deployed binaries in order to reduce the space used on the target. Before you begin, install VisualGDB 5.5 or later and ensure you are using the Custom edition or higher.
In this tutorial we will target Raspberry Pi with a Windows-based cross-toolchain using a CMake-based project, however most of the steps shown below will also apply to other project types.
- Start Visual Studio and select the VisualGDB Linux Project Wizard under File->New->Project:

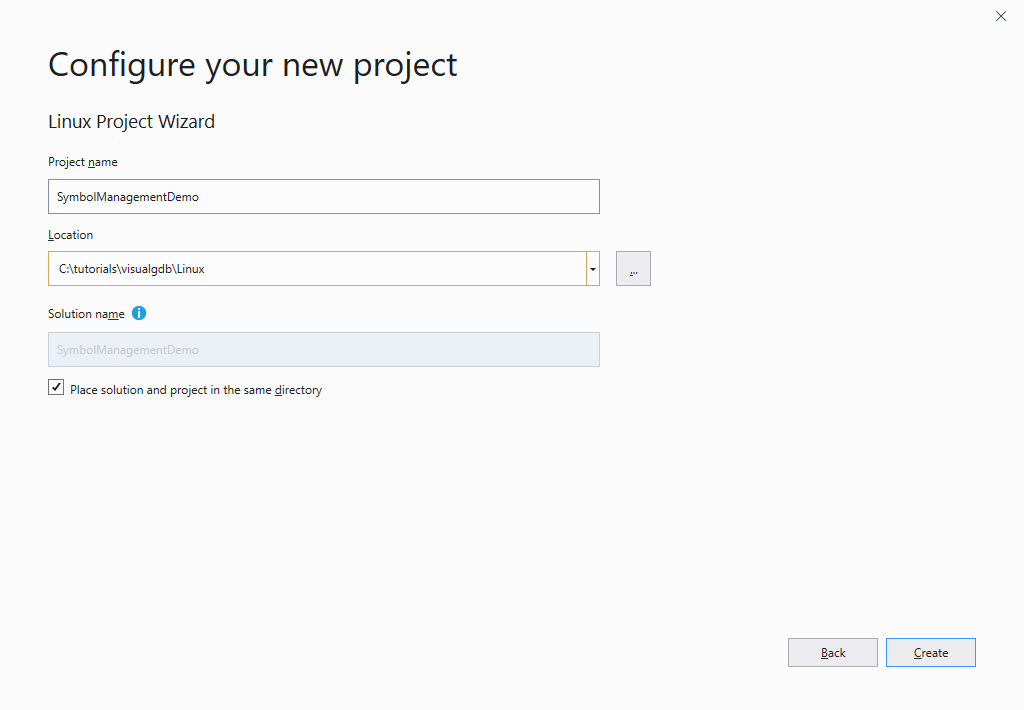
- Enter the name and location where you would like to create the project:
- On the first page of the VisualGDB Linux Project Wizard select “Create a new project -> Application -> CMake” and check the “Advanced CMake Project Subsystem” page:
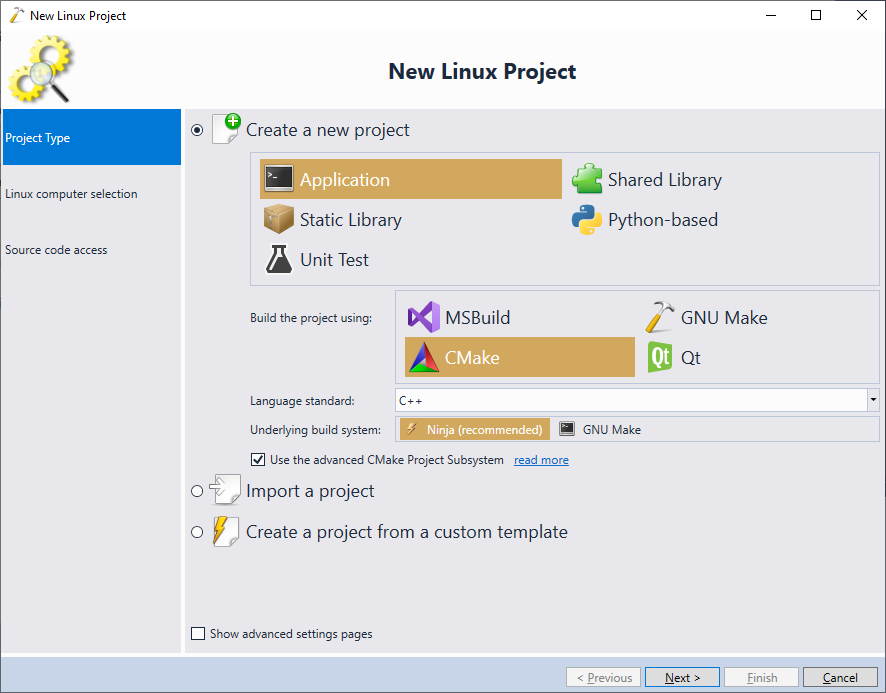 We will use the Advanced CMake Project Subsystem as it is the easiest way to create a single project containing multiple targets (main executable and several libraries), however the configuration steps shown below will also work for Make-based, MSBuild-based and Qt-based projects.
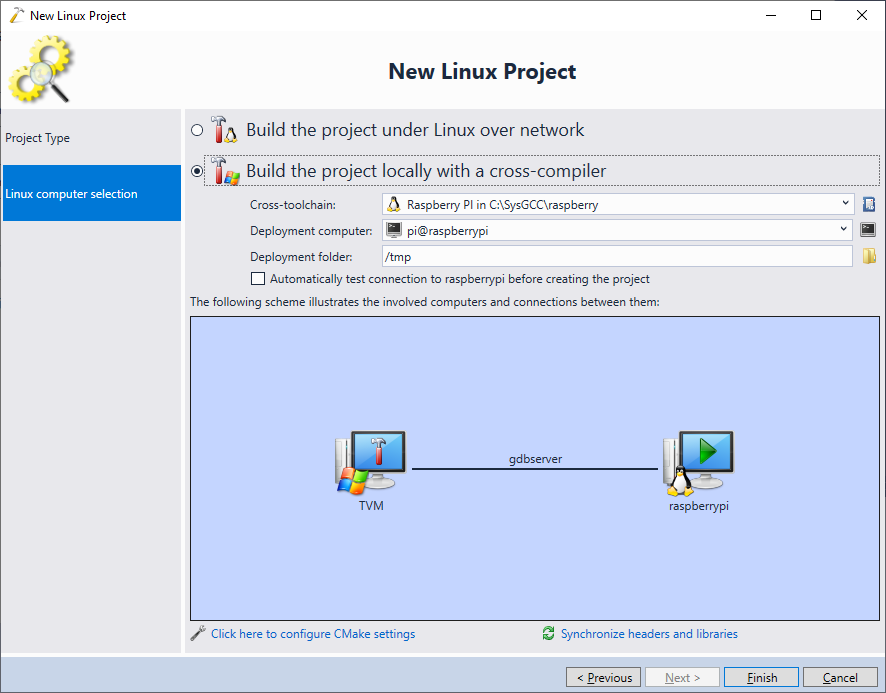
 - In this tutorial we will use the Raspberry Pi cross-compiler to build the code on the Windows machine and deploy it to the target. However, the rest of the tutorial (except automatic symbol stripping) will also work for projects built directly on the target:
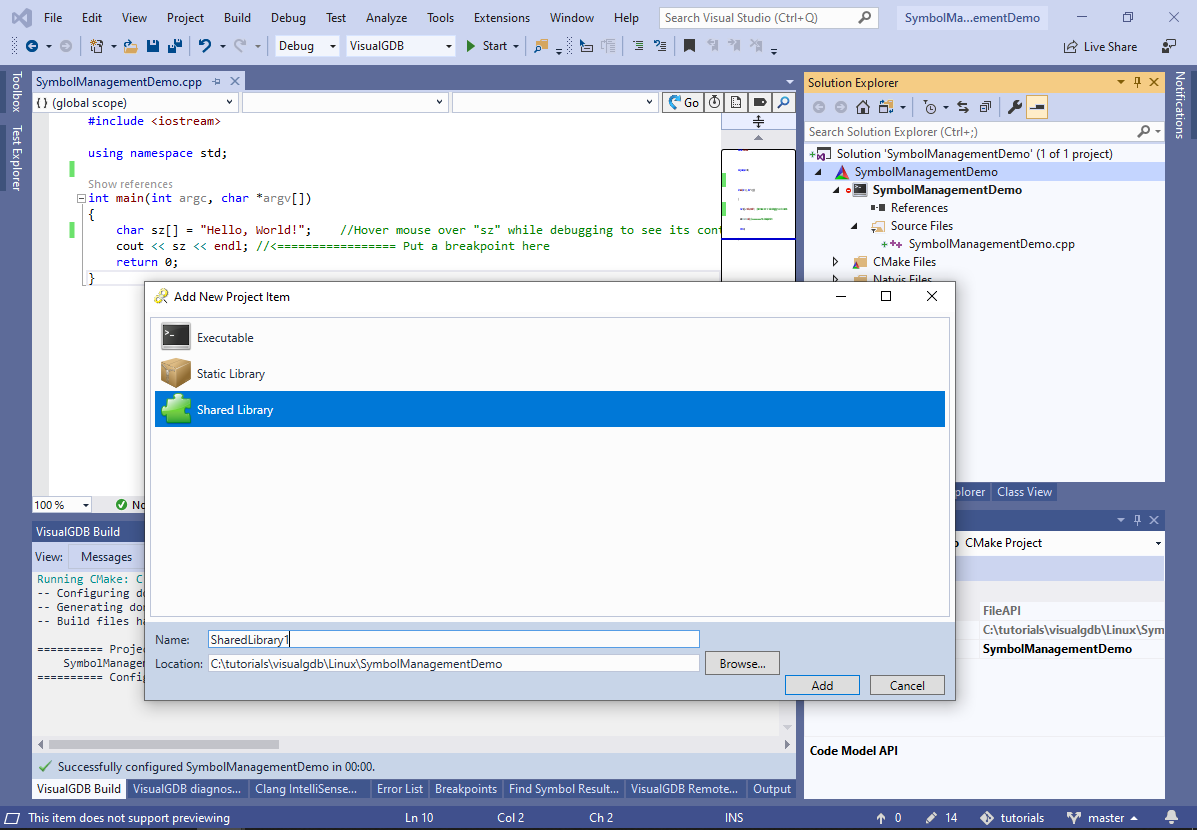
- Press “Finish” to complete the wizard. VisualGDB will generate a CMake-based project consisting of the main executable. Right-click on the project node in Solution Explorer and select Add->New Item:
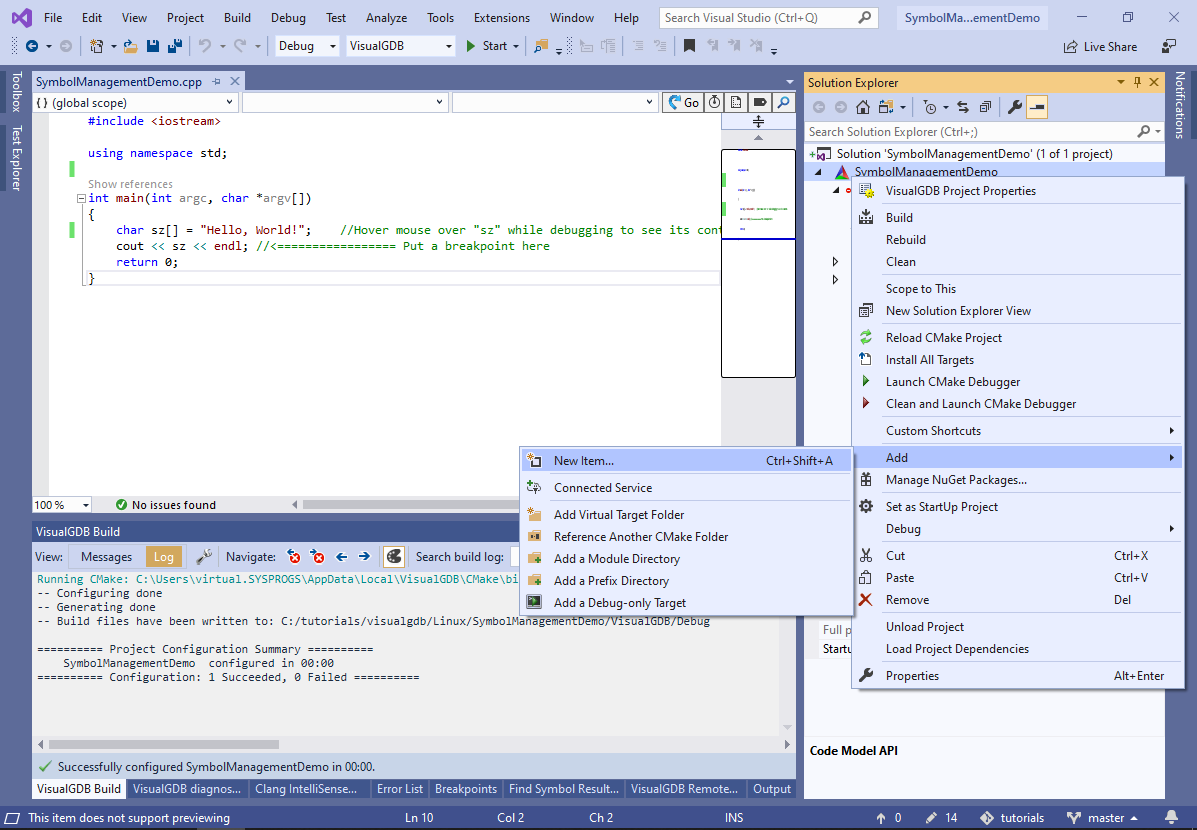
- Select “Shared Library” in the “Add New Project Item” dialog, enter “SharedLibrary1” in the Name field and press Add to proceed with creating it:
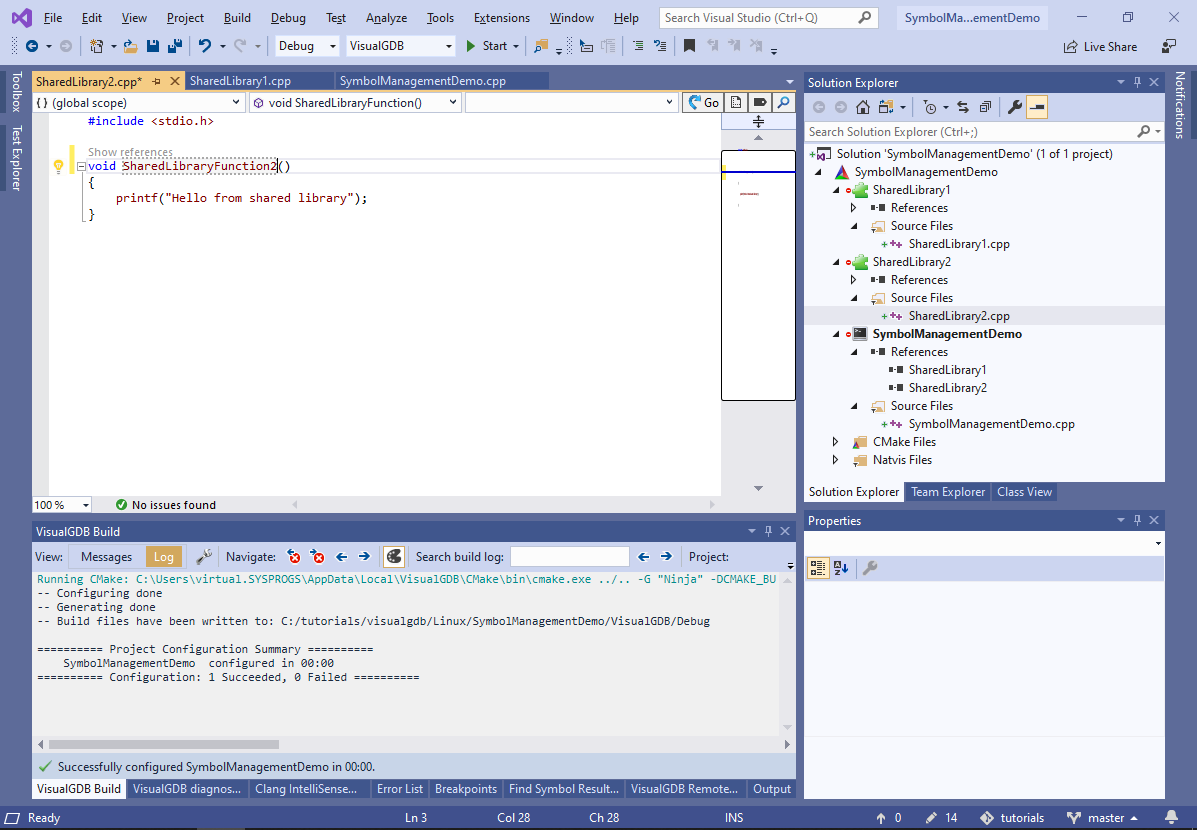
- Repeat the previous step to create another library called SharedLibrary2. Then open the source files for both SharedLibrary1 and SharedLibrary2 and rename the functions defined in them accordingly:
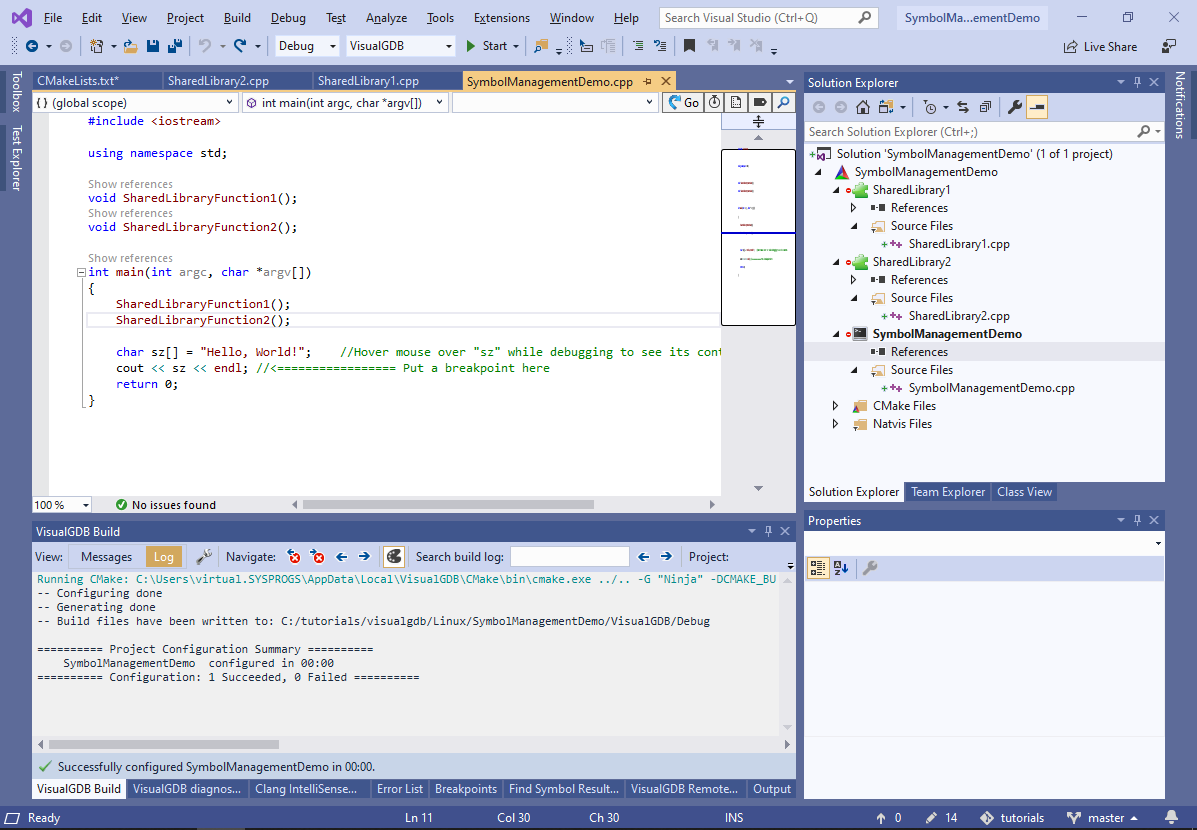
- Update the main source file to call the shared library functions:
void SharedLibraryFunction1();
void SharedLibraryFunction2();

int main(int argc, char *argv[])
{
    SharedLibraryFunction1();
    SharedLibraryFunction2();

    char sz[] = "Hello, World!";	//Hover mouse over "sz" while debugging to see its contents
	cout << sz << endl;	//<================= Put a breakpoint here
	return 0;
}
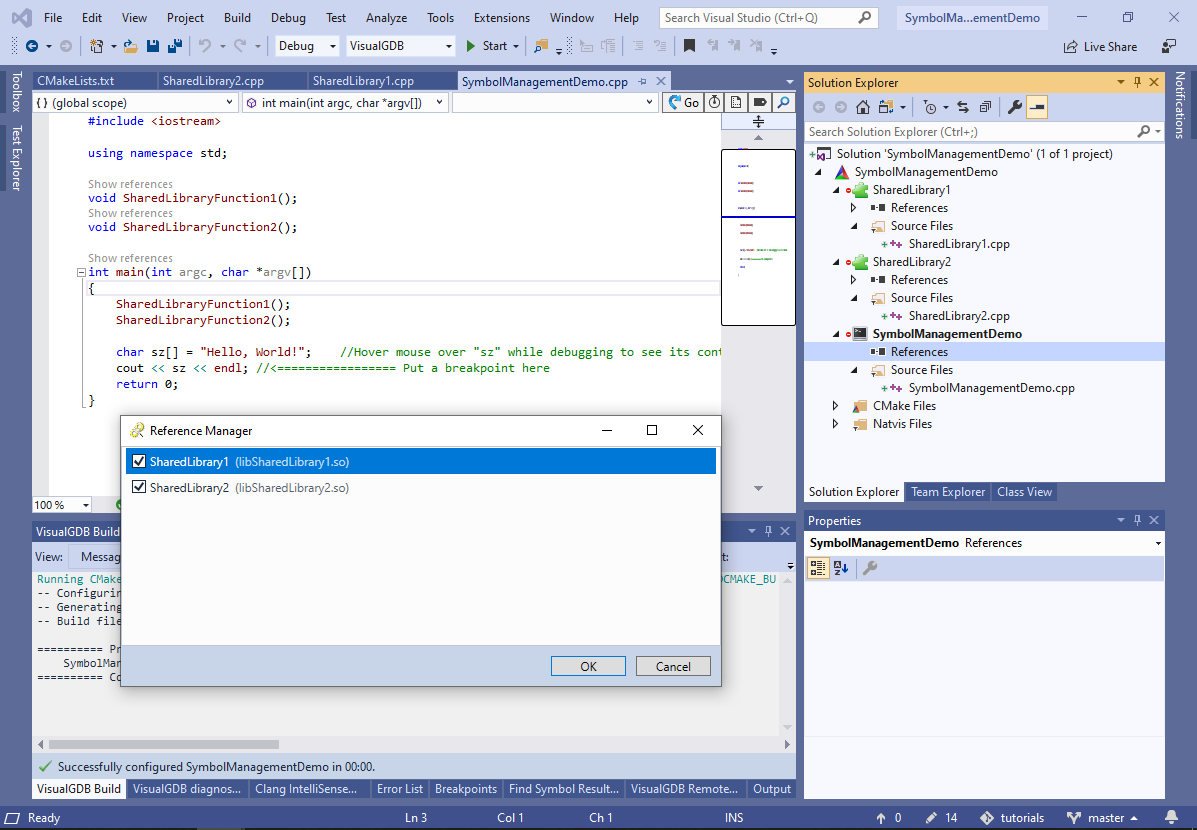
- Finally, add references to the shared libraries to the main executable:
- Press F5 to build the project and start debugging it. VisualGDB will automatically deploy the built files and load their symbols, allowing you to step through the code:

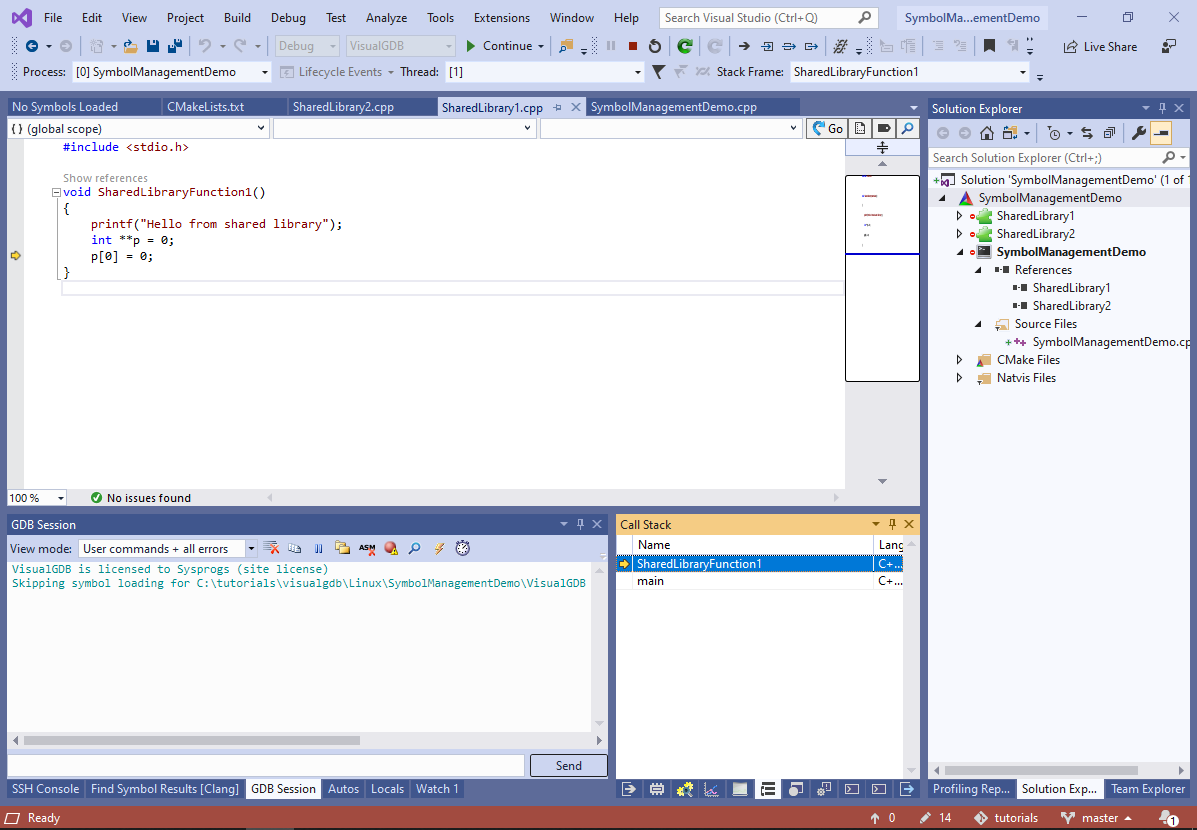
- The shared libraries created in this tutorial are very small, hence loading their symbols does not slow down the debug sessions. However, debugging projects with multiple large shared libraries could result in considerable startup delays. We will now show how to control which symbols get loaded automatically in order to reduce the delays. Go to the SharedLibraryFunction1() function and add the following lines to it:
    int **p = 0;
    p[0] = 0;
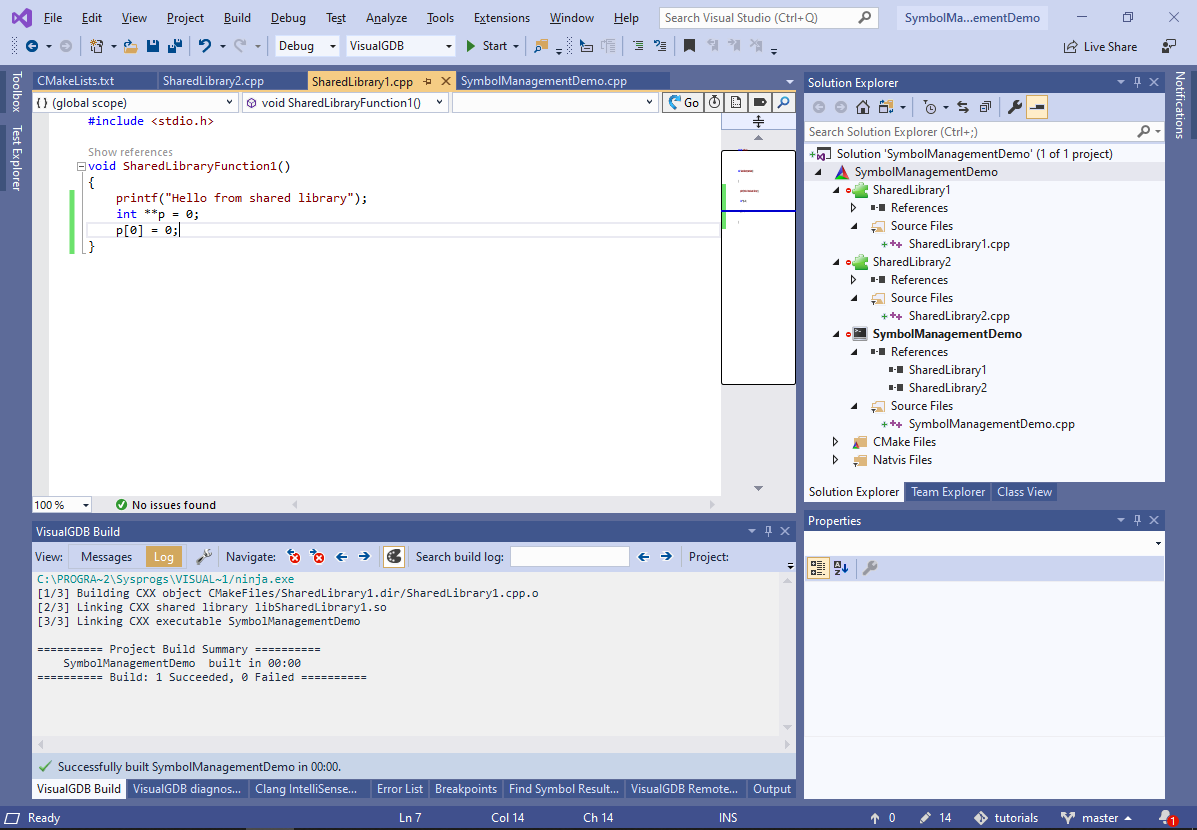 This will trigger a SIGSEGV signal when the function gets executed.
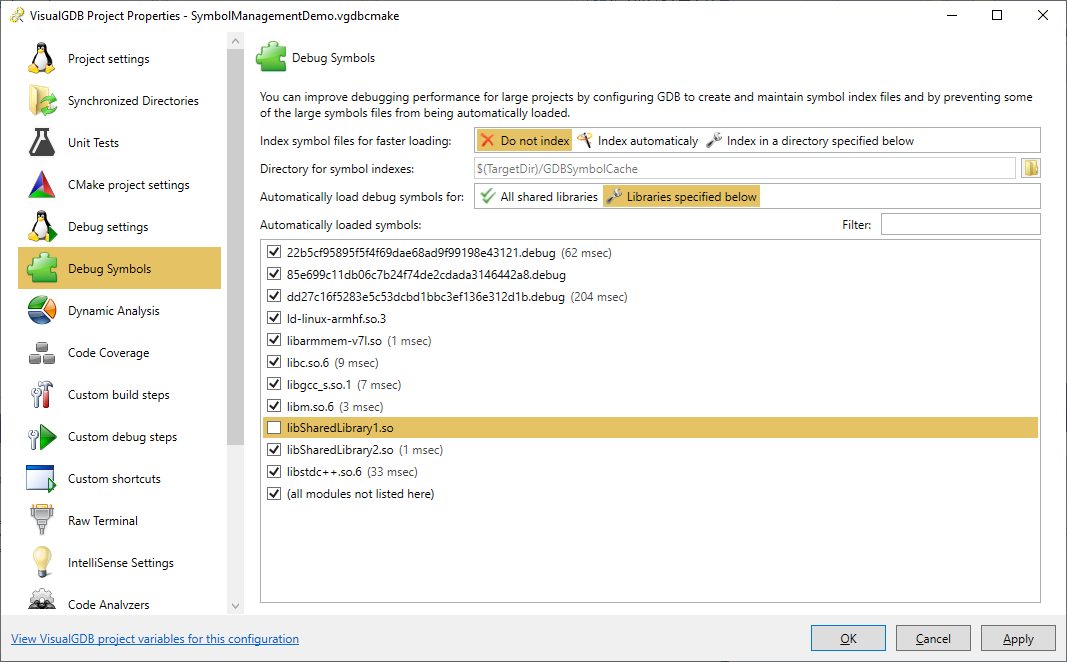
 - Open VisualGDB Project Properties -> Debug Symbols (available in Custom edition or higher). VisualGDB will show the libraries loaded during the previous debug session, noting down how much time it took to process each one of them. Locate libSharedLibrary1.so in the list and uncheck it:
- Click OK to close the VisualGDB Project Properties window and press F5 to begin debugging again. The code we added to SharedLibraryFunction1() will now trigger a SIGSEGV error:
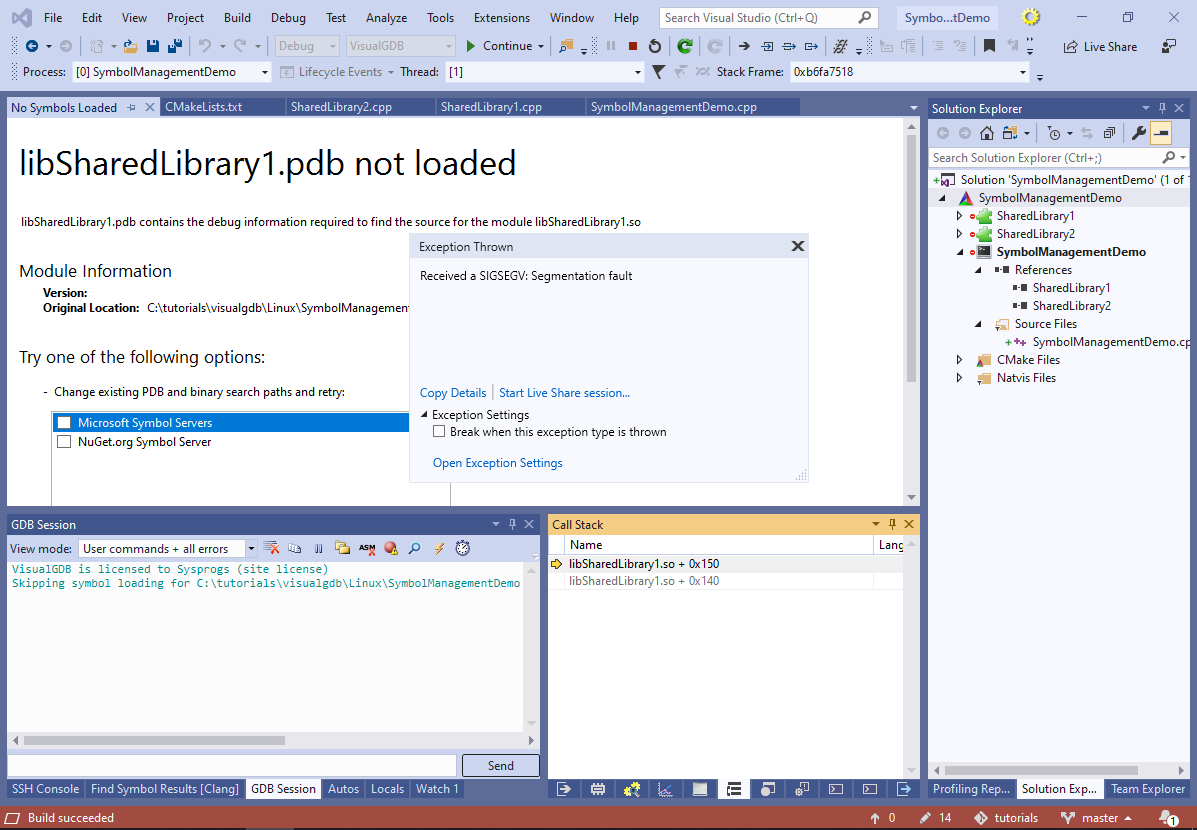 As we have disabled the symbol loading for SharedLibrary1, stepping into the code defined in that library, or setting breakpoints there will not work. Visual Studio will also display a generic “library not loaded” message for the SIGSEGV exception raised on our code, instead of pointing to a specific source line.
 - You can still debug the code in SharedLibrary1 by loading the symbols manually. Simply select “Load Symbols” in either Call Stack window, or the Modules window and VisualGDB will automatically load the missing symbols, as long as they are available:
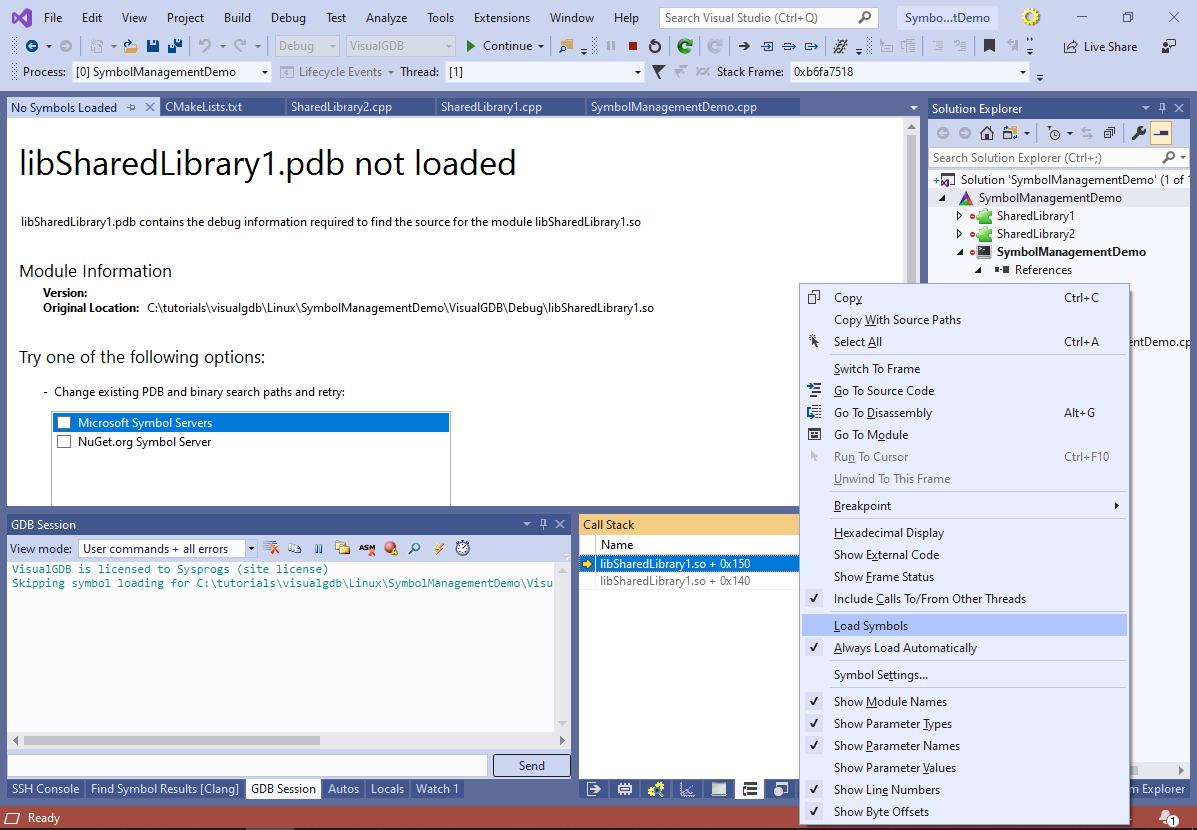
- If the source location is not shown immediately, double-click at the topmost entry in the Call Stack and Visual Studio will show the source location:
 When debugging large real-world projects with multiple shared libraries, we recommend disabling automatic symbol loading for the libraries where you do not expect to trigger any breakpoints, and loading them on-demand via the Call Stack window as shown above. The Debug Symbols page of VisualGDB Project Properties will show the exact amount of time that could be saved by skipping the loading of each shared library.
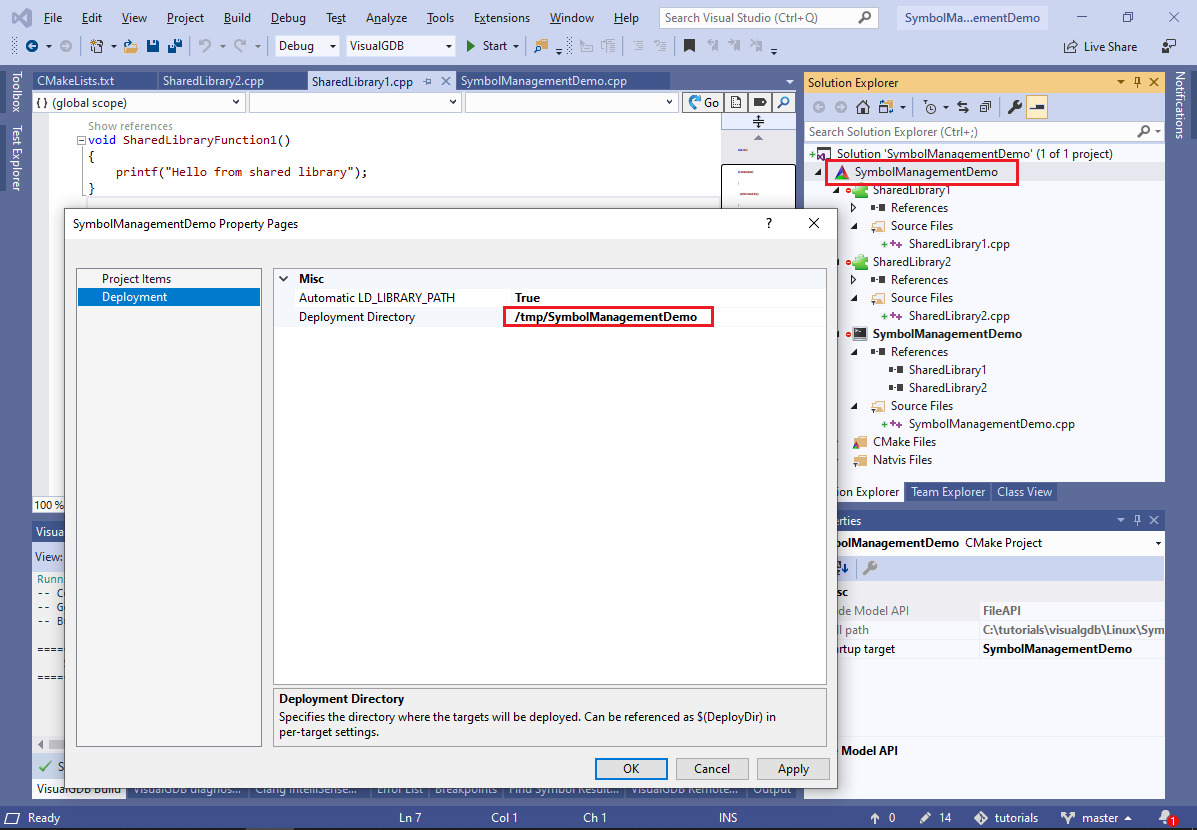
 - Now we will show how to reduce the size of the debugged binaries on the target by automatically stripping debug symbols from them. Open VS Project Properties for the project node and change the deployment directory to /tmp/SymbolManagementDemo:
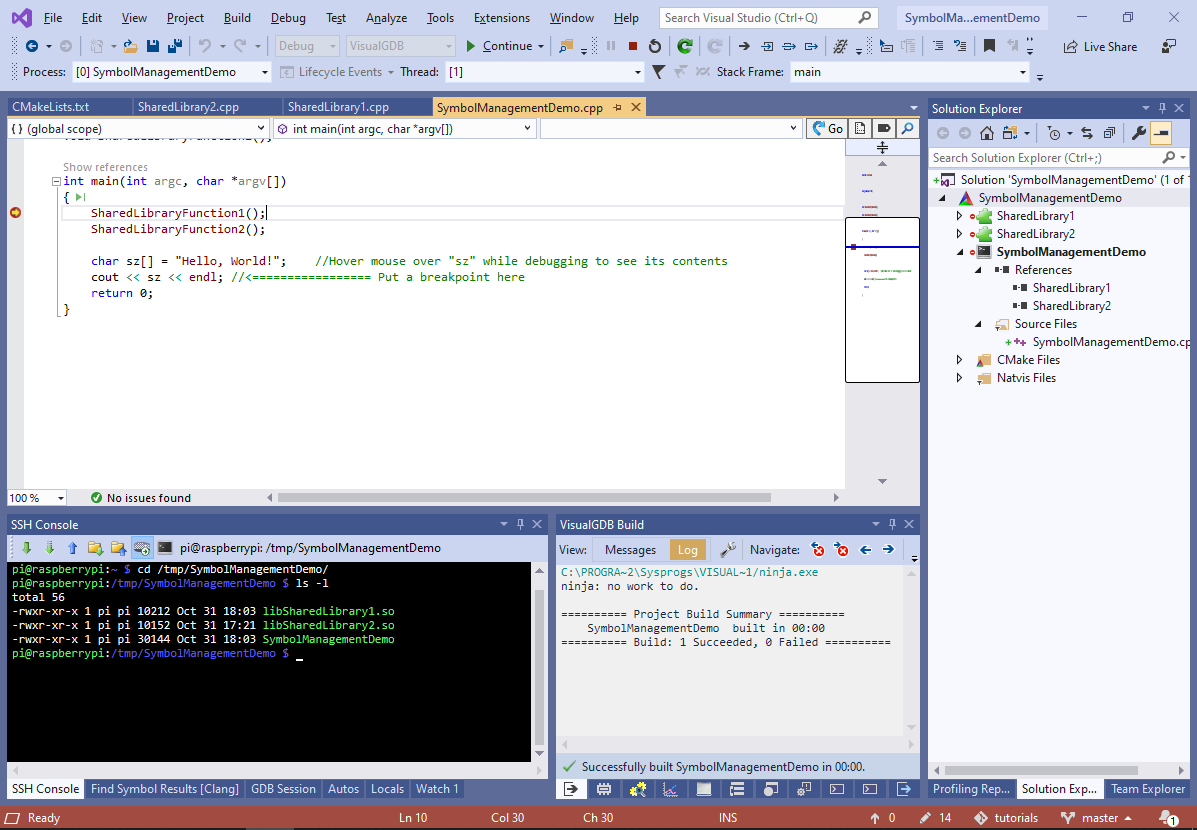
- Start debugging. Once a breakpoint hits, open the SSH Console window and list the contents of the deployment directory. Note the sizes of the executables and libraries in that directory:
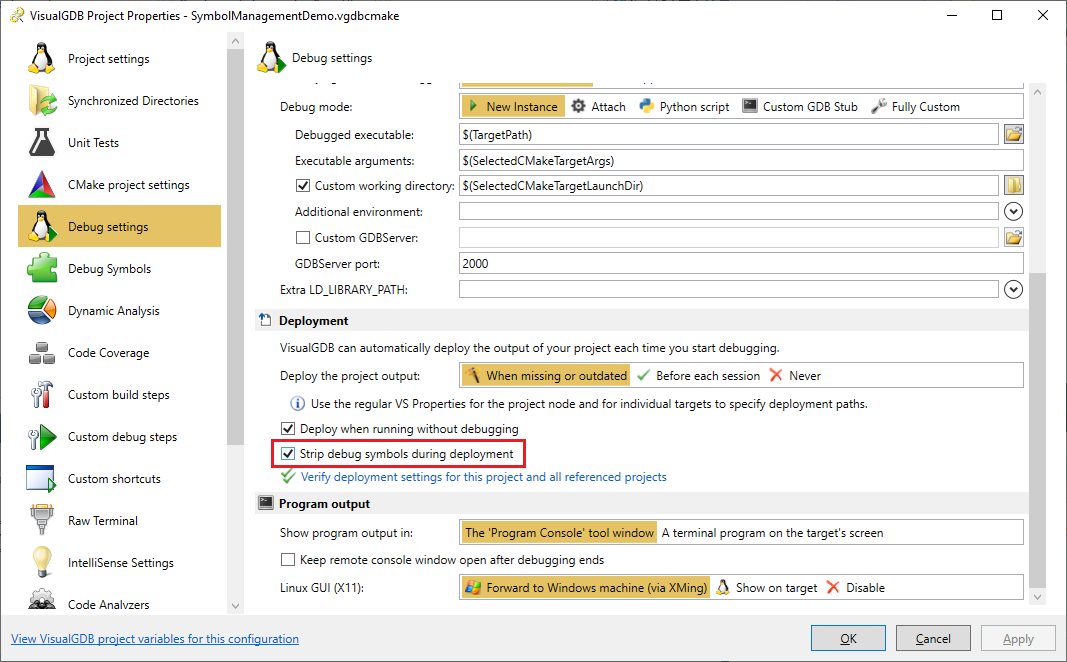
- Open VisualGDB Project Properties on the Debug Settings page and check the “Strip debug symbols during deployment” checkbox:
- Start debugging again and list the deployment directory contents once more:
 Note how the size of the main binary and the libraries has been reduced because VisualGDB has removed the debug symbols from them. This will only work for cross-compiled projects where gdb (that requires the debug symbols) is running on a different machine than the target itself.