Debugging programs with LLDB under Visual Studio
This tutorial shows how to configure VisualGDB to use the LLDB debugger instead of gdb to debug your programs.
Before you begin, install VisualGDB 5.1 or later.
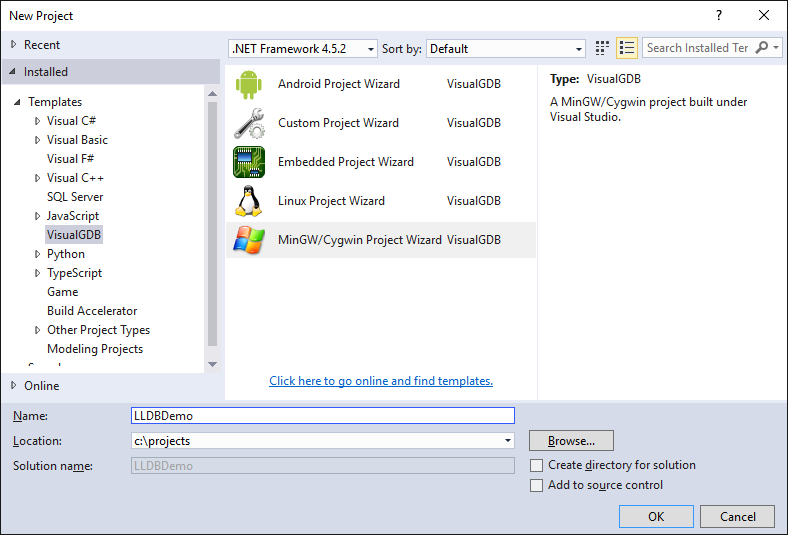
- Start Visual Studio and open the VisualGDB MinGW/Cygwin Project Wizard:
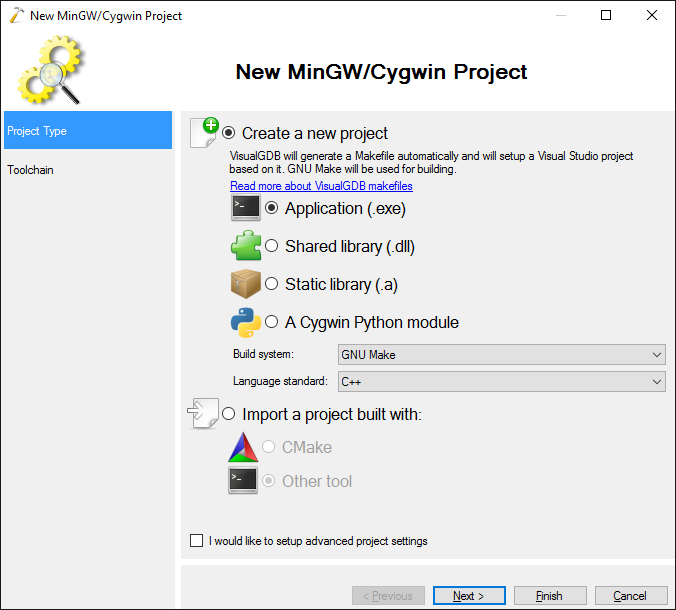
- Proceed with the default settings on the first page (Create new project -> Application):
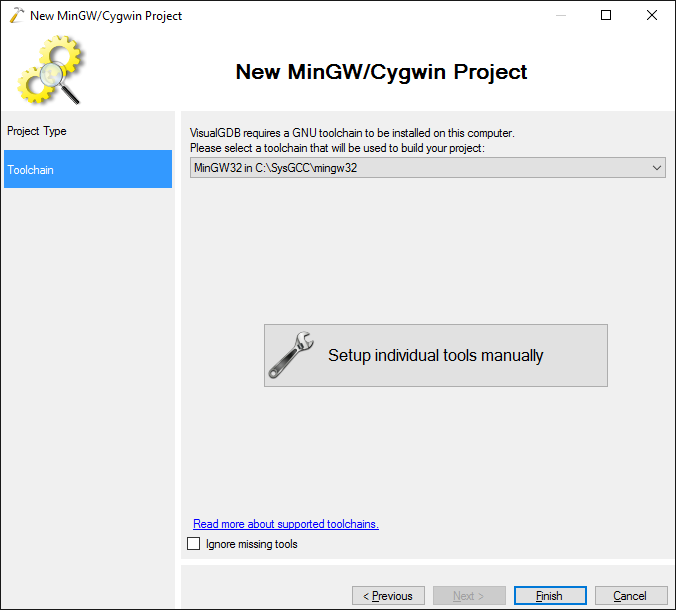
- On the next page select the toolchain you want to use. VisualGDB comes with a pre-built lldb debugger, so the steps described here will work on any local toolchain, as long as lldb can debug the program it produces:
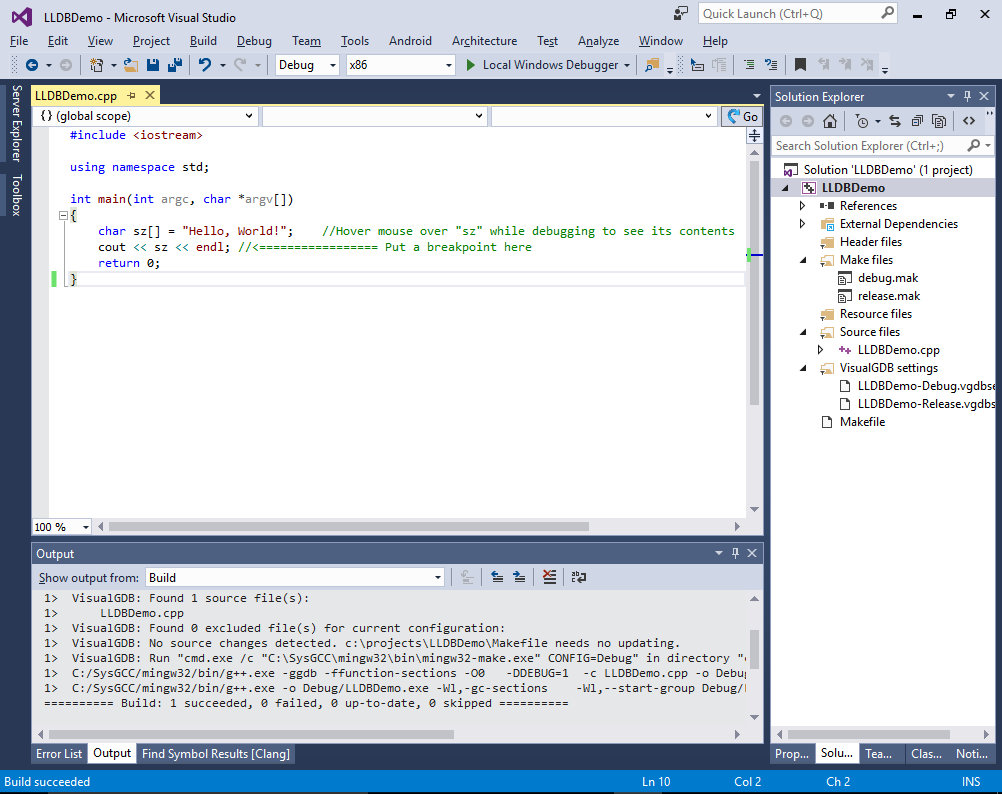
- Press “Finish” to generate your project. Build it with Ctrl-Shift-B:
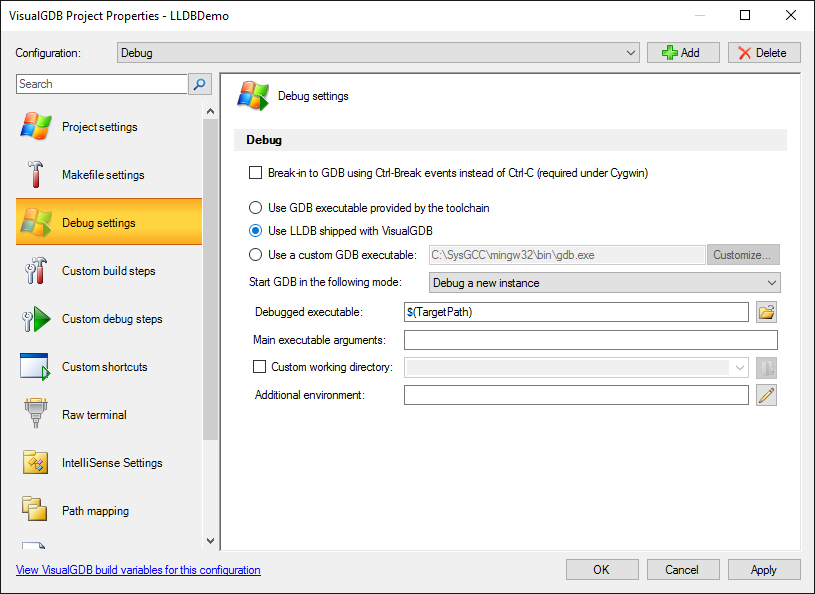
- If you start debugging by pressing F5 now, VisualGDB will launch the default GDB binary that comes with the toolchain. To use lldb instead, open VisualGDB Project Properties, go to the Debug Settings page and select “Use LLDB shipped with VisualGDB”:
- Then set a breakpoint in the main source file and press F5 to start debugging. VisualGDB will launch the debugging session:
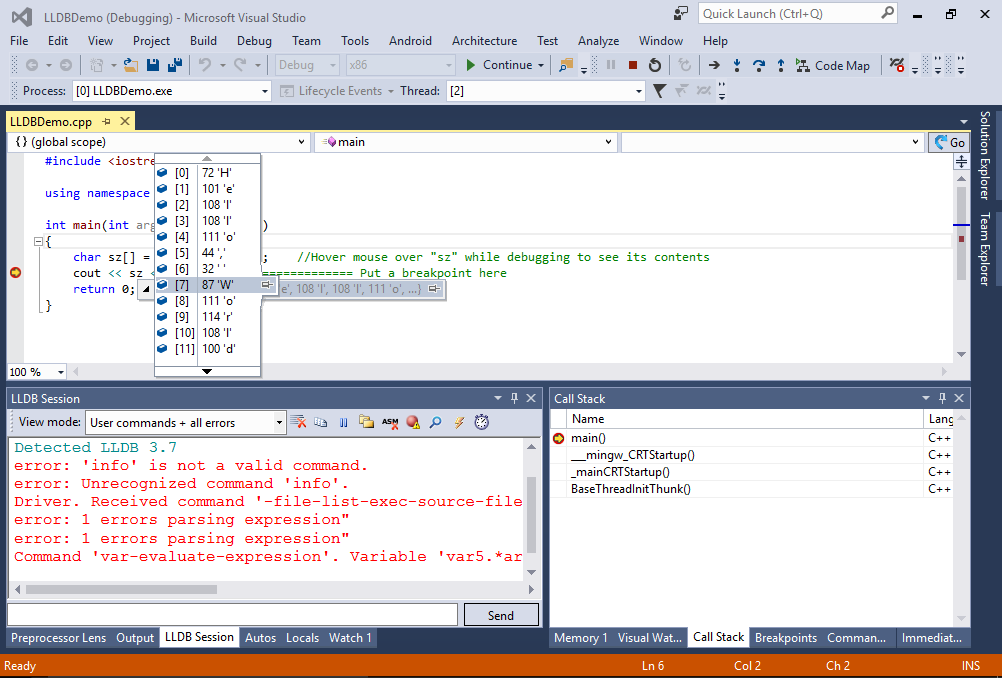 Note that LLDB won’t accept many of the gdb-specific commands and VisualGDB will automatically try known workarounds. The error messages in the LLDB Session window will indicate commands, but it should not interfere with most of the debugging functions.
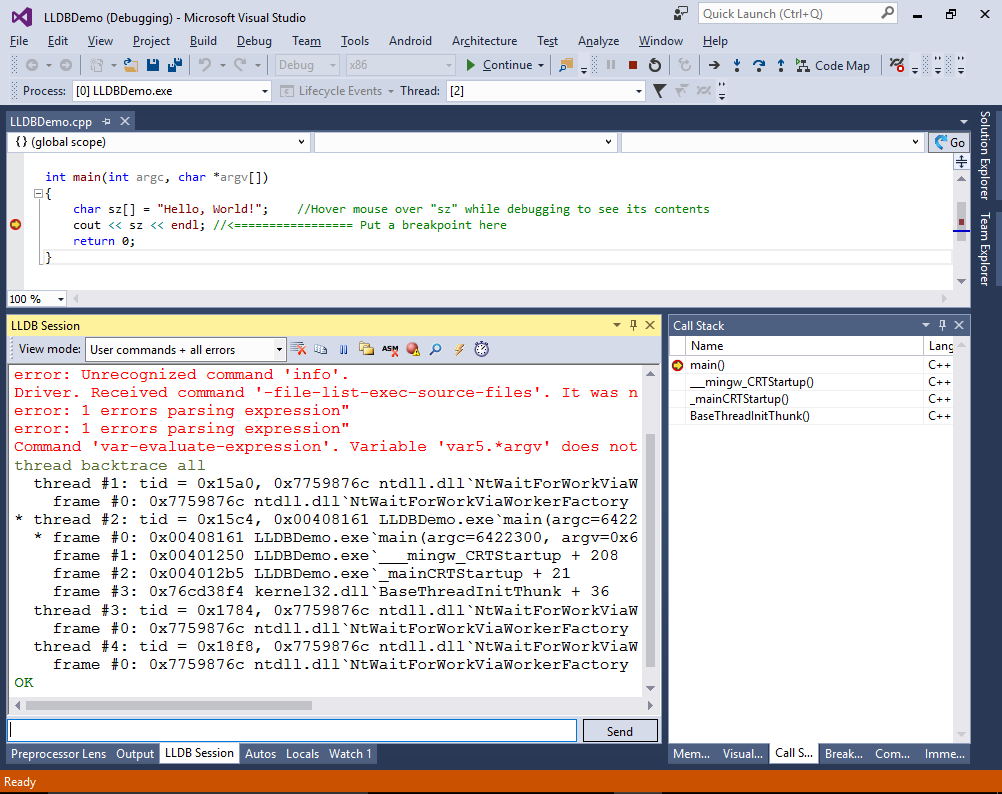
 - You can run LLDB-specific commands in the LLDB Session window directly. E.g. you can run “thread backtrace all” to view the backtrace of all the threads:


Note that if you are using a cross-toolchain to deploy your program to a remote machine and debug it with gdbserver, LLDB may have compatibility issues with it. In that case we recommend installing lldb on that Linux machine directly and configuring VisualGDB to debug with it. As long as the binary name is called lldb-mi, VisualGDB will automatically adjust the command-line arguments so that LLDB can start correctly.