Improving your Embedded Firmware Quality with Unit Tests
This tutorial shows how to use VisualGDB to create unit tests for embedded projects that will run directly on the embedded device. Unit tests are supported on the ARM Cortex devices using Segger J-Link or OpenOCD and can be supported on other devices using VisualGDB extension SDK. Before you begin, install VisualGDB 5.2 or later.
In this tutorial we will create a simple test project for the STM32F4Discovery board that will verify that the execution time of the sinf() function matches a certain constraint. We will show how switching the FPU mode from hardware to software would instantly cause the test to fail. If your program contains performance-critical code, you can use this approach to separately test the performance of each critical part and catch slowdowns caused by recent changes before they start causing trouble.
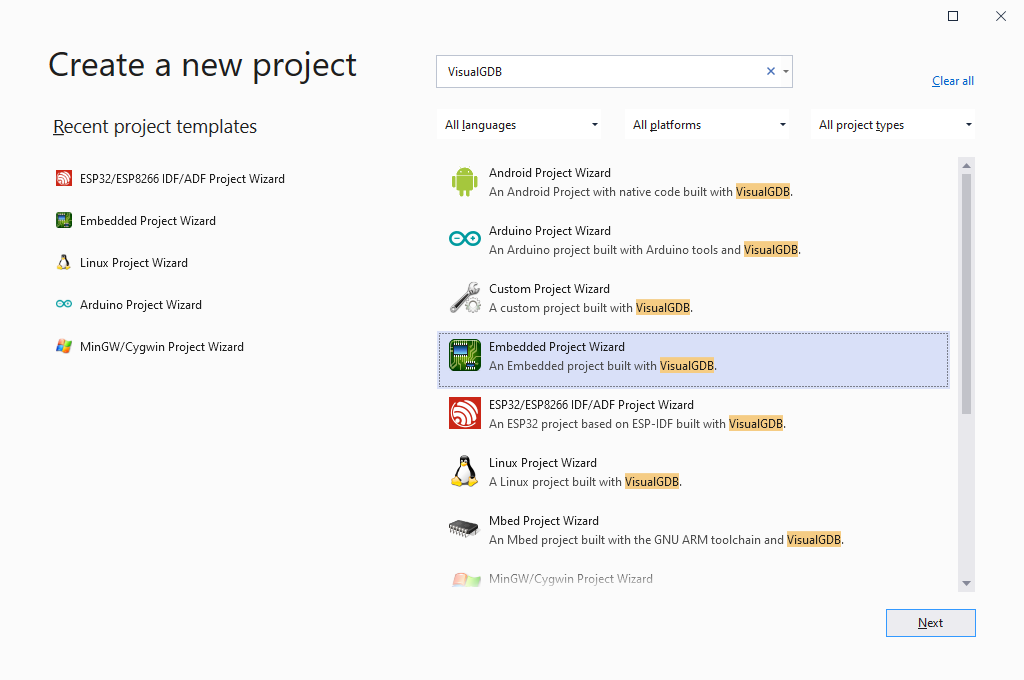
- Begin with starting Visual Studio and selecting File->New Project->VisualGDB->Embedded Project Wizard:
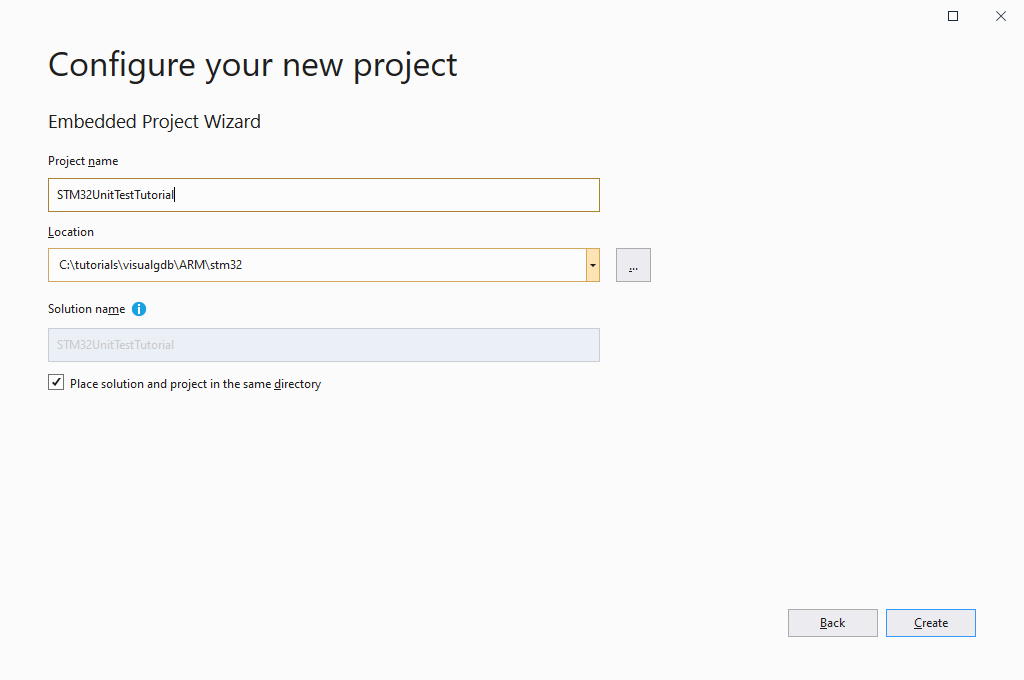
- Enter the name and location for your project:
- On the first page select Create a new project -> Unit test project -> MSBuild -> TinyEmbeddedTest:
 VisualGDB also supports CppUTest and GoogleTest frameworks out-of-the-box, so you can use one of those if your device has enough FLASH memory. The TinyEmbeddedTest framework provided by Sysprogs focuses on using as little FLASH space as possible and providing basic CppUTest-compatible API:
 - On the next page select the ARM toolchain and choose your device from the device list:
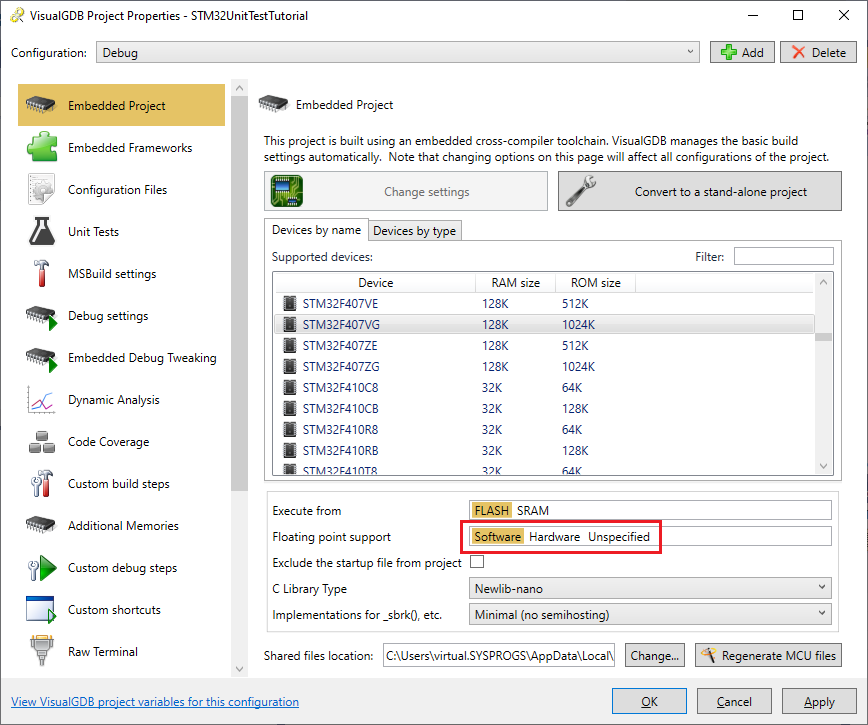
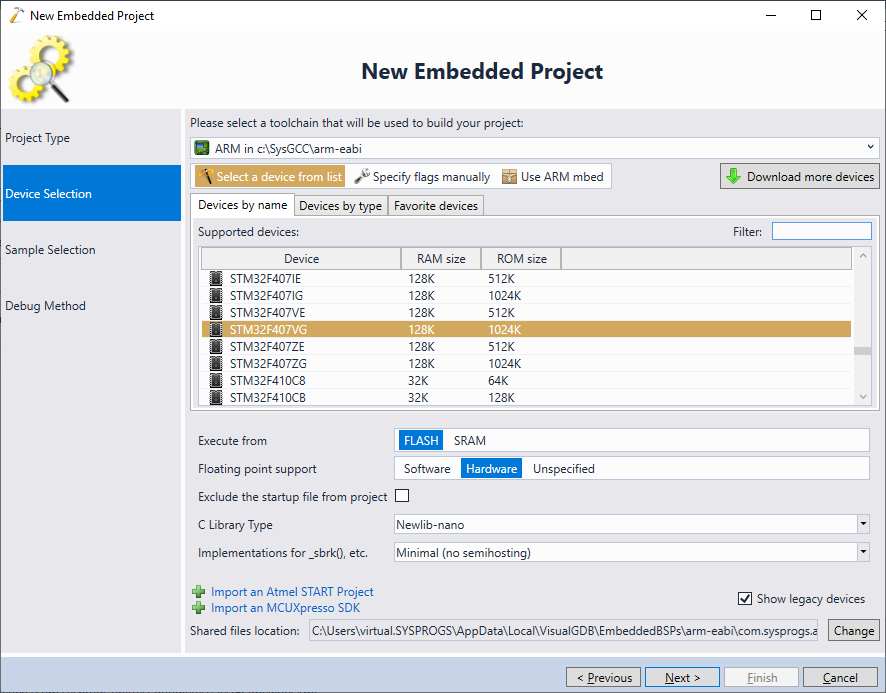 Make sure the hardware floating point mode is selected.
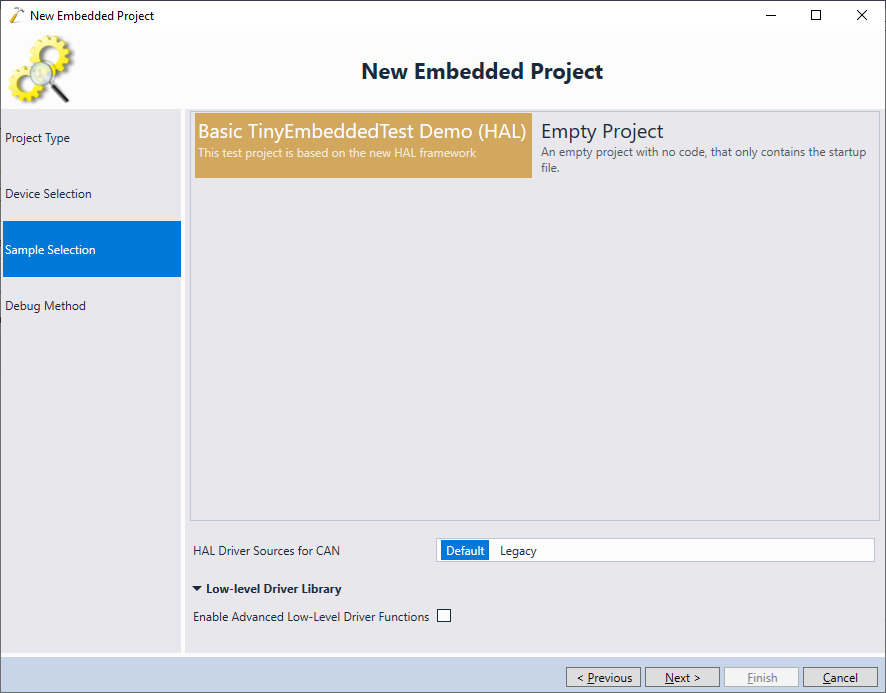
 - Proceed with the default sample for the test project:
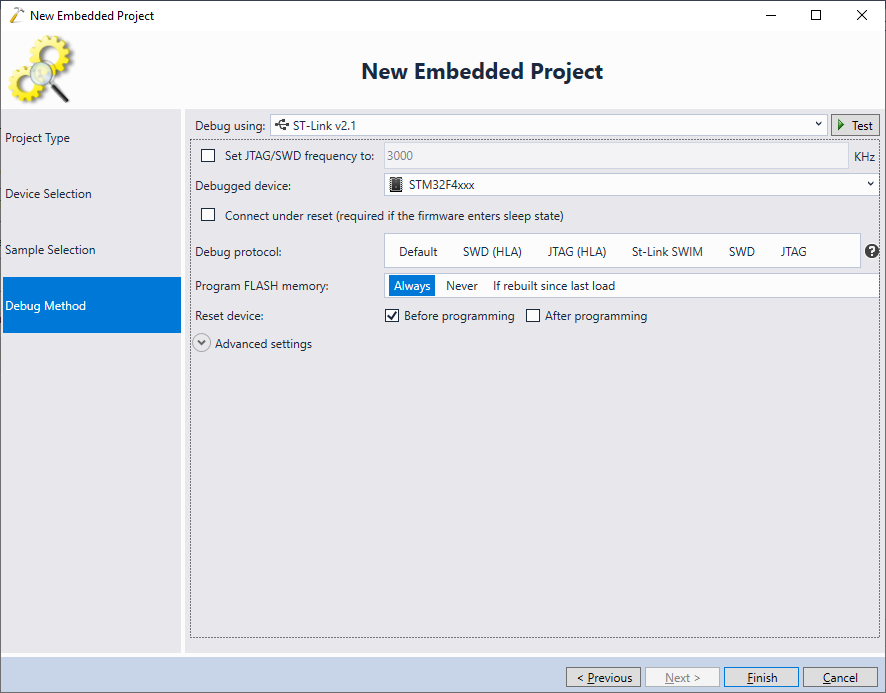
- Finally select your debug method. Unit tests work with OpenOCD and Segger J-Link, so we select OpenOCD here:
- Press “Finish” to create your project. VisualGDB will create a basic project with 3 tests. Check the SuccessfulTest1 test for a quick overview of various checks supported by the test framework:
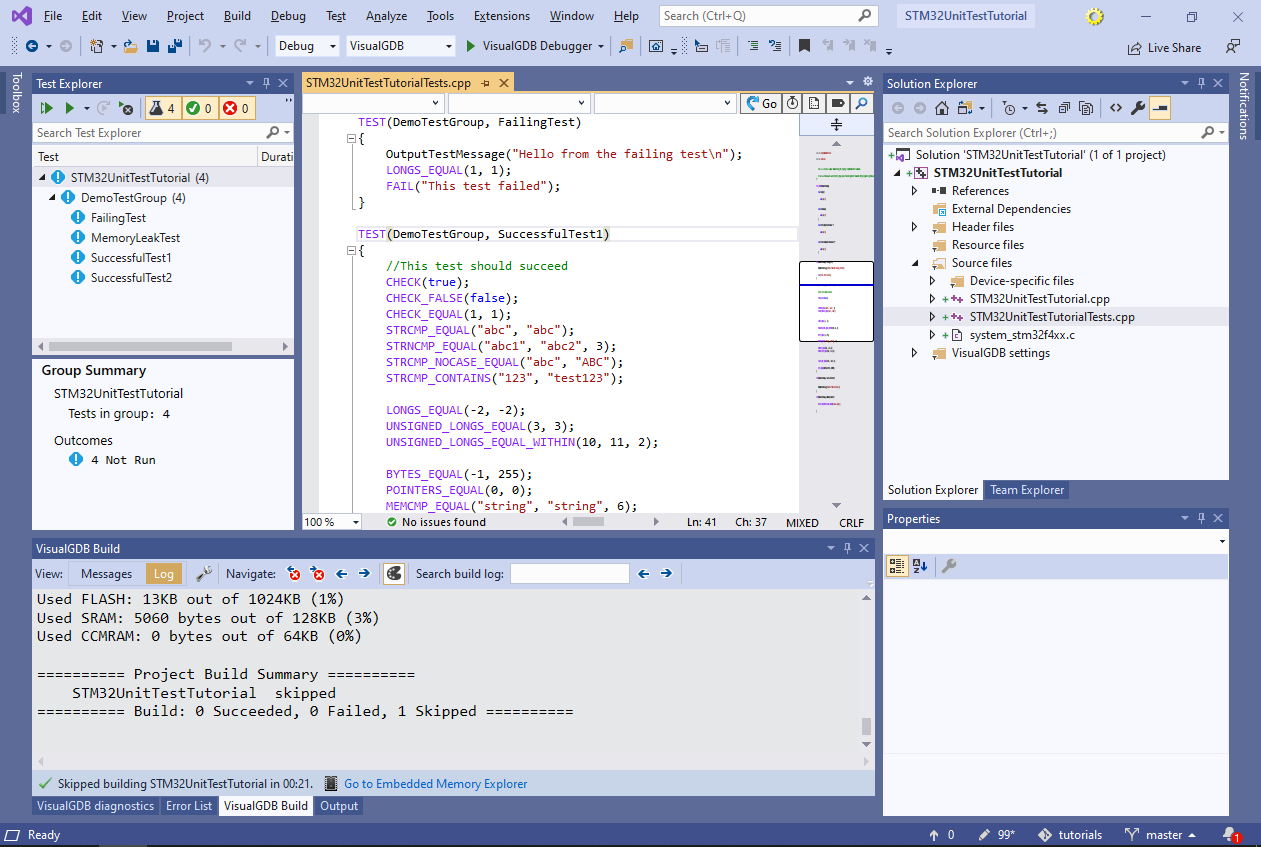
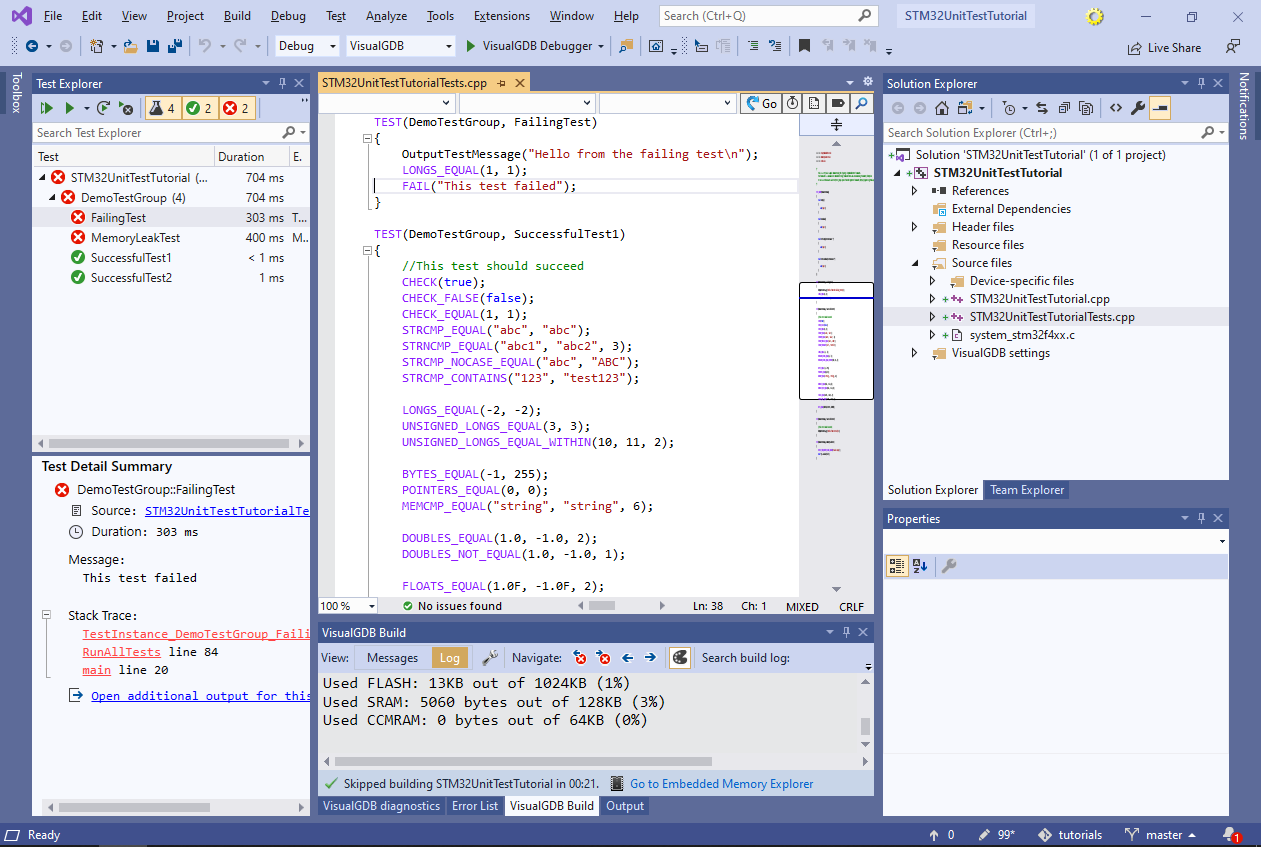
- Build your project and select Test->Run->All Tests to verify that the tests can be started properly. Alternatively you can select the tests you want to run in the Test Explorer, right-click there and select “Run”:
- Now we will measure the time taken by the sinf() function in soft-FP and hard-FP modes. On many ARM Cortex devices (including most STM32F4 devices) this can be done by enabling the debug cycle counter, setting the CYCCNT register to 0 before running a function and then reading the CYCCNT register immediately after. The following function demonstrates this:
void MeasureSinTime()
{
    volatile double arg = 0.1;
    CoreDebug->DEMCR |= CoreDebug_DEMCR_TRCENA_Msk;
    DWT->CTRL |= DWT_CTRL_CYCCNTENA_Msk;
    DWT->CYCCNT = 0;
    volatile float result = sinf(arg);
    volatile unsigned cycles = DWT->CYCCNT;
    asm("nop");
}
- VisualGDB test projects are normal executable projects with a main() function. Hence you can quickly prototype things by calling functions like this one directly from main() after the HAL_Init() call. Then set a breakpoint at the “nop” line and start debugging. Once the breakpoint is hit, note down the value of the “cycles” variable:
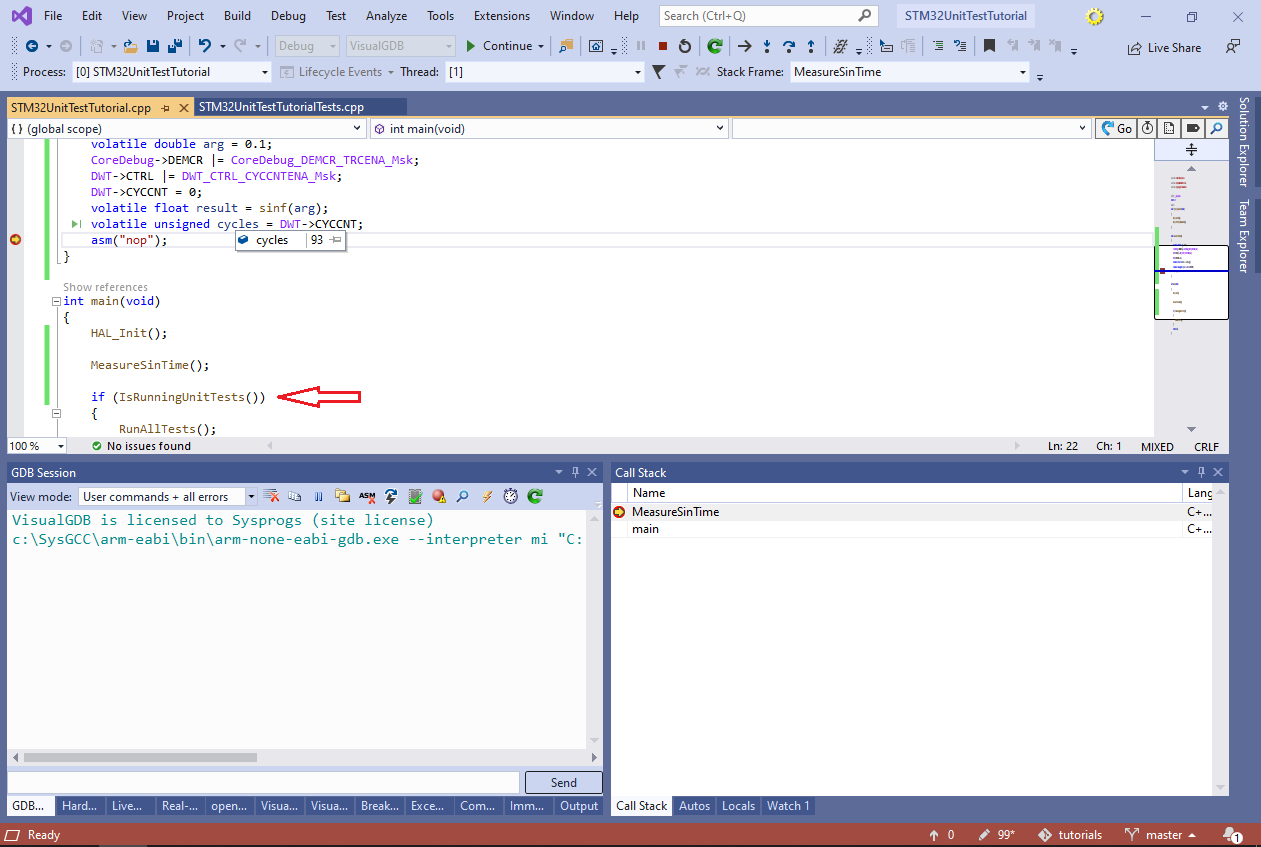 Note how the IsRunningUnitTests() check in main() is used to distinguish regular debug sessions from unit test runs. It will only return true when running or debugging unit tests via the VisualGDB interfaces.
 - Now we will switch the project to the software floating point mode:
- Build it and check the new time:
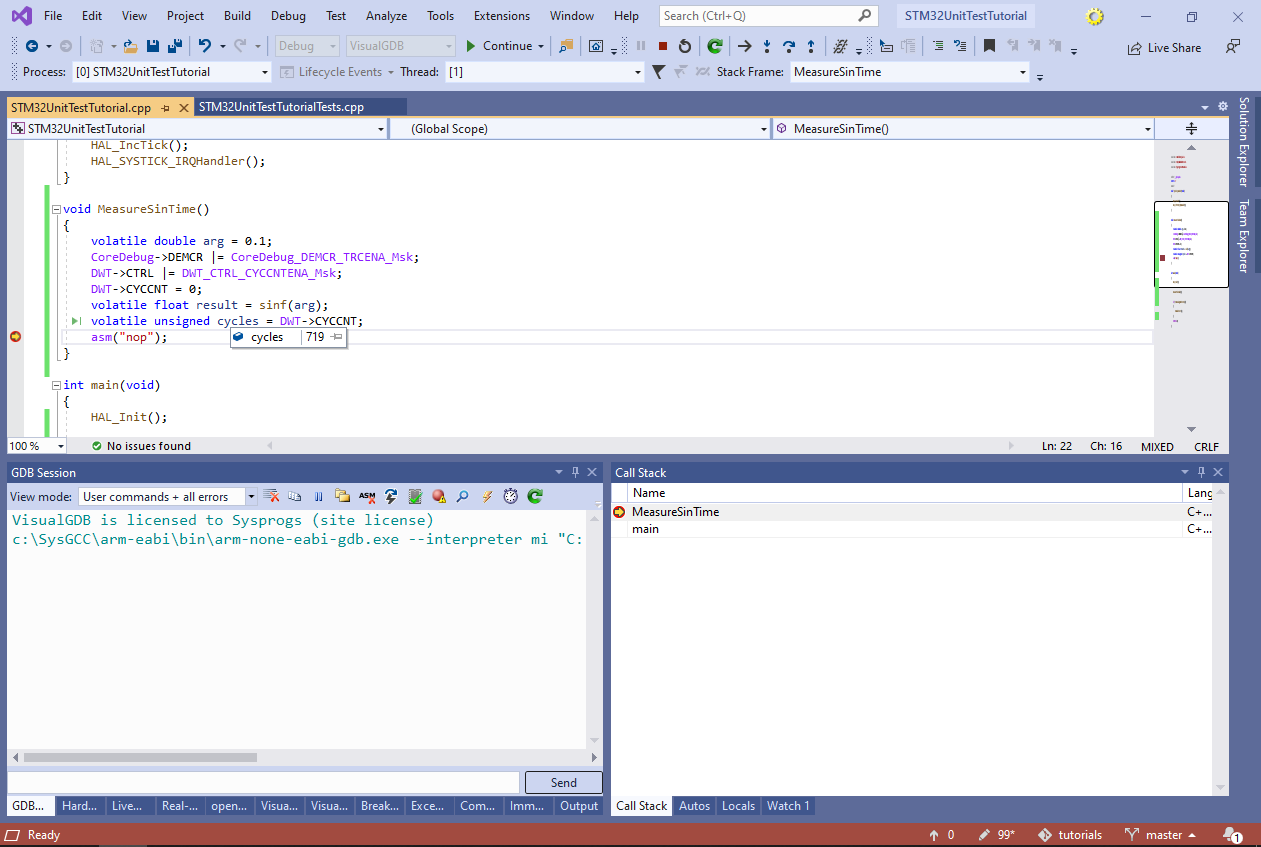 Using the hardware FP mode makes more than 7.5x difference! So if a toolchain update or an accidental change in settings breaks this setting, the performance impact could be critical.
 - Now let’s make a simple test that will automatically verify that the sinf() function completes in time. Declaring tests using TinyEmbeddedTest and CppUTest consists of 2 steps:
- Defining a test group that will share common initialization and cleanup steps
- Defining the actual tests
The test group can be easily defined using the TEST_GROUP() macro. We will put the code enabling the debug cycle counter there so that we can run multiple timing-related tests without enabling it each time:
TEST_GROUP(TimingTests)
{
    void setup()
    {
        CoreDebug->DEMCR |= CoreDebug_DEMCR_TRCENA_Msk;
        DWT->CTRL |= DWT_CTRL_CYCCNTENA_Msk;
    }
};
The actual test is very straight-forward as well:
TEST(TimingTests, sinf)
{
    volatile double arg = 0.1;
    DWT->CYCCNT = 0;
    volatile float result = sinf(arg);
    CHECK(DWT->CYCCNT < 100);
}
Also don’t forget to remove the MeasureSinTime() function as we don’t need it anymore.
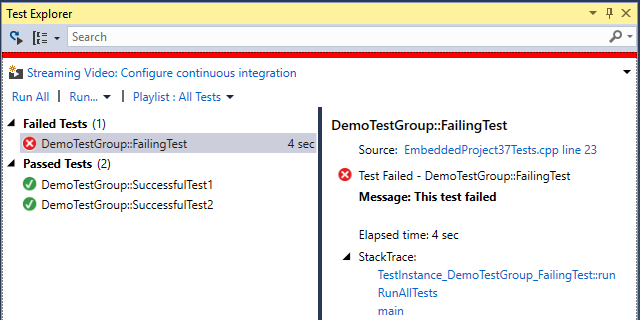
- If you build your project now and run the newly added TimingTests::sinf() test, it will pass as long as you use the hardware FP mode:

- Using software FP mode, will immediately trigger a test failure:
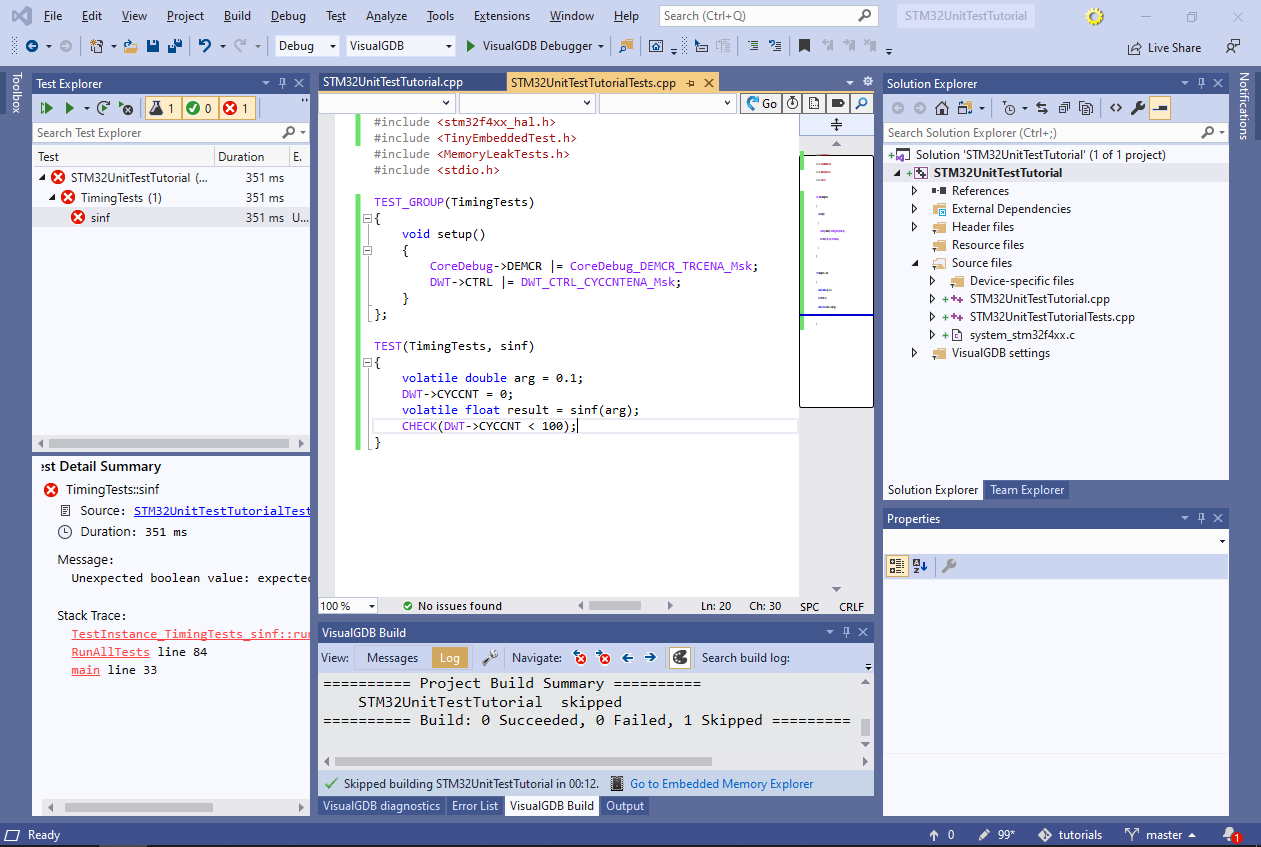
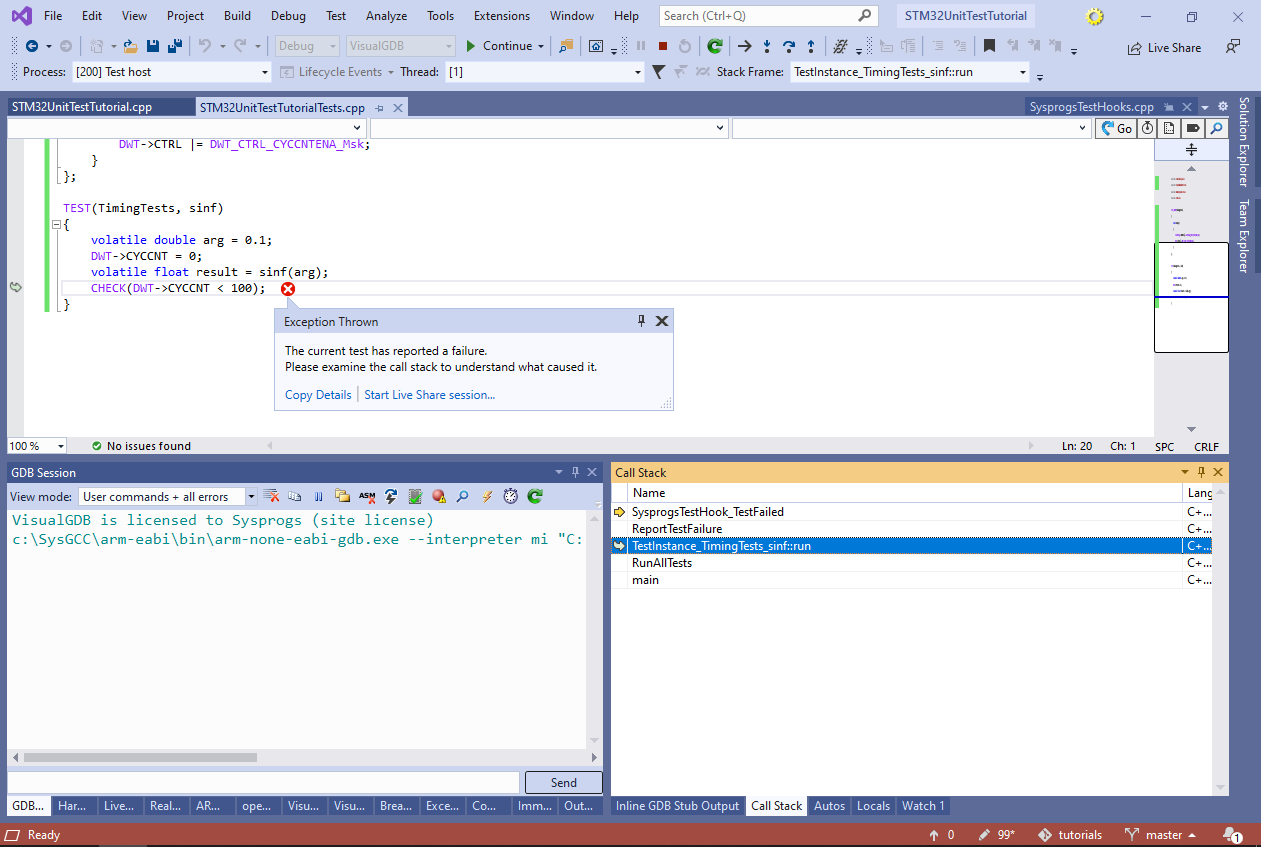
- You can debug failed tests by right-clicking at them and selecting “Debug Selected Tests”. Once a test failure is reported, VisualGDB will treat it as an exception and stop:
- Now we will add 2 small improvements to our test. First of all, when a failure is detected, we can output something more meaningful than “unexpected boolean value”. Second of all, if the timing is OK, we can still report it to keep a track of it in the test logs. Both tasks can be accomplished with a simple helper class:
class TimingValidator
{
private:
    unsigned m_Timeout;

public:
    TimingValidator(unsigned timeout)
        : m_Timeout(timeout)
    {
        DWT->CYCCNT = 0;
    }

    ~TimingValidator()
    {
        unsigned cycles = DWT->CYCCNT;
        if (cycles < m_Timeout)
            printf("Timing OK: %d < %d\n", cycles, m_Timeout);
        else
        {
            char sz[64];
            sprintf(sz, "Timing violation: %d > %d", cycles, m_Timeout);
            FAIL(sz);
        }
    }
};
It will automatically reset the cycle counter when created and will automatically check the timing when leaving the scope. This will reduce the actual test method to this:
TEST(TimingTests, sinf)
{
    volatile double arg = 0.1;
    TimingValidator validator(100);
    volatile float result = sinf(arg);
}
Note that the ‘volatile’ statements are needed to prevent the optimizer from throwing away the call to ‘sinf()’ as we are calling it with a constant input and not doing anything with the value.
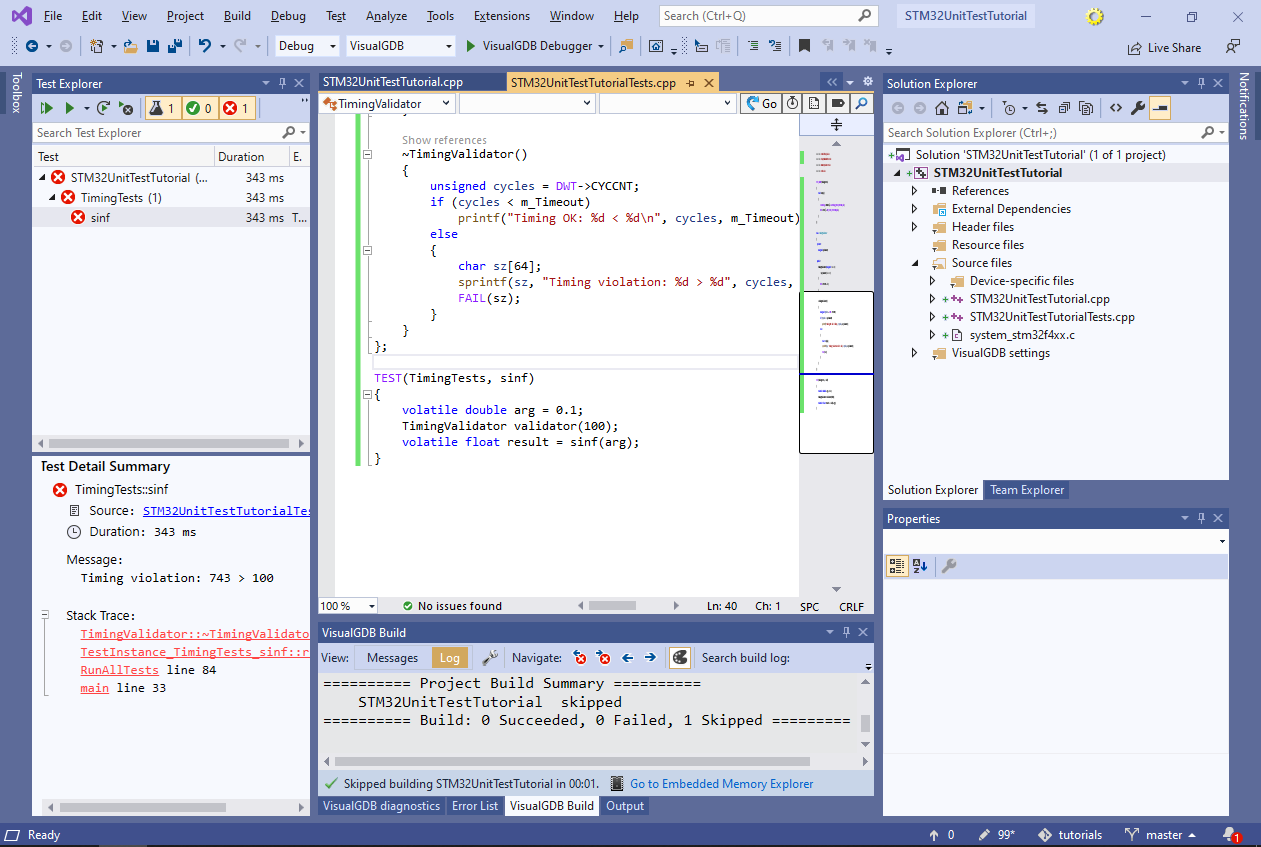
- If you run the test in software FP mode now, you will see a much more meaningful message:
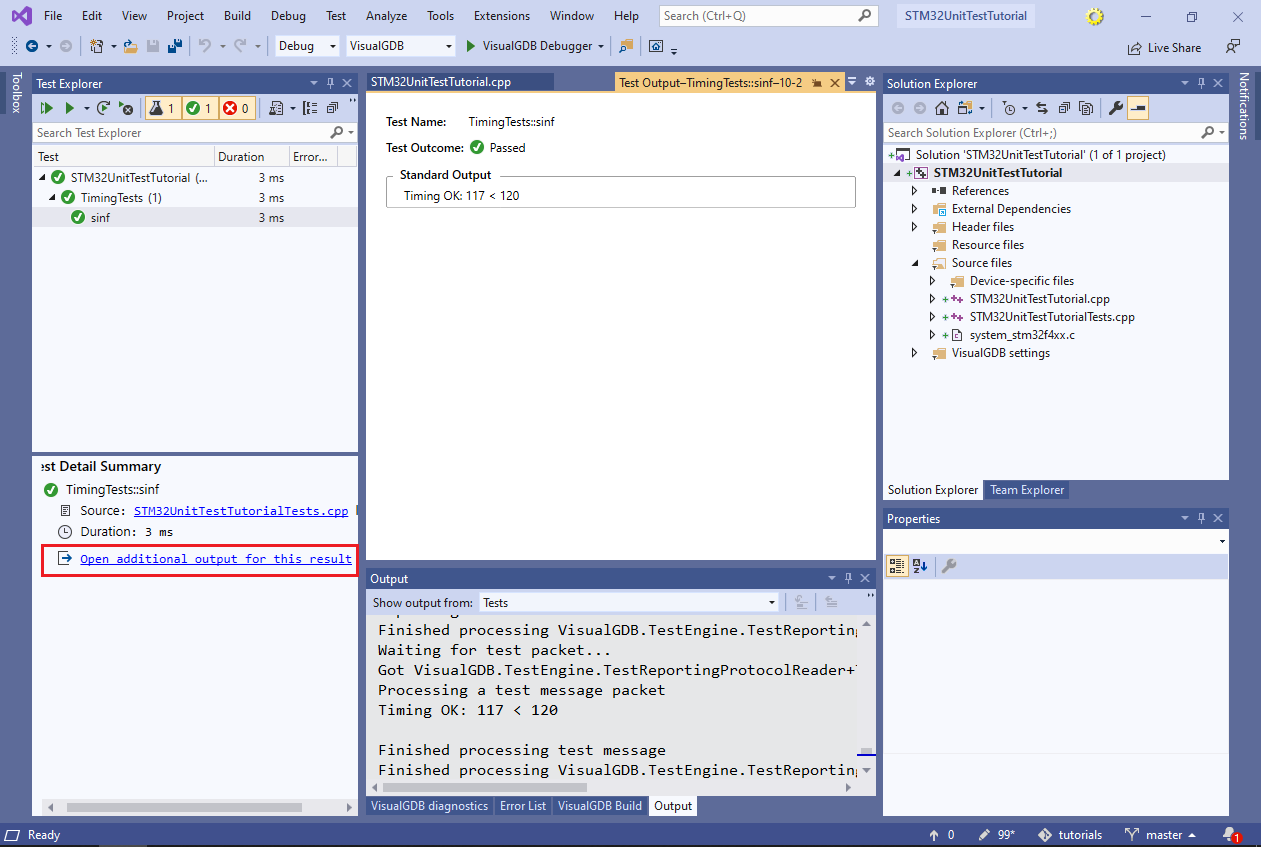
- Similarly a successful test will now output the actual timing into the Output->Tests window and in the per-test output view:
 Note that if you using the unoptimized debug build, you may need to increase the cycle threshold to account for running the constructor/destructor. In optimized release builds they will be normally inlined.
 - You can easily use VisualGDB tests with a continuous integration system. Simply configure it to run the following command line:
<VisualGDB.exe> /runtests <test container file> /output<output file>
- For non-MSBuild projects, the test container file is the .vgdbsettings file corresponding to the debug or release configuration. For MSBuild projects where the binary name is computed in Visual Studio on-the-fly, a test container is a simple text file containing the .vgdbsettings file path on the first line and the full binary path on the next one:
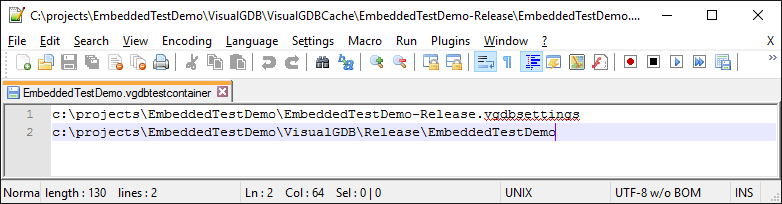 VisualGDB automatically generates those files when you start your tests from Visual Studio.
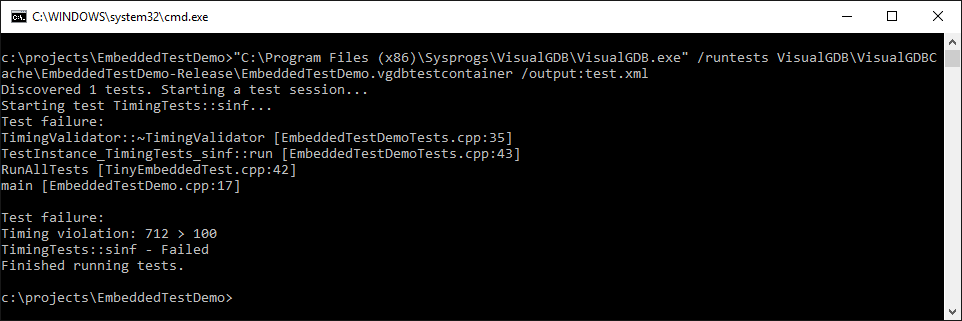
 - A test run started from command line will generate an XML file with the details on the test outcome, output produced by it and any encountered errors:
<?xml version="1.0"?> <TestRunReport xmlns:xsi="http://www.w3.org/2001/XMLSchema-instance" xmlns:xsd="http://www.w3.org/2001/XMLSchema"> <TestRuns> <TestRun> <TestID>TimingTests::sinf</TestID> <Output /> <TestLocation>c:\projects\EmbeddedTestDemo\EmbeddedTestDemoTests.cpp:40</TestLocation> <TestName>TimingTests::sinf</TestName> <Outcome>Failed</Outcome> <Duration>4203</Duration> <Details> <TestObject xsi:type="CallStack"> <Frames> <CodeLocation> <File>c:\projects\EmbeddedTestDemo\EmbeddedTestDemoTests.cpp</File> <Function>TimingValidator::~TimingValidator</Function> <Line>35</Line> </CodeLocation> <CodeLocation> <File>c:\projects\EmbeddedTestDemo\EmbeddedTestDemoTests.cpp</File> <Function>TestInstance_TimingTests_sinf::run</Function> <Line>43</Line> </CodeLocation> </Frames> </TestObject> <TestObject xsi:type="ErrorSummary"> <Summary>Timing violation: 712 > 100</Summary> </TestObject> </Details> </TestRun> </TestRuns> </TestRunReport>
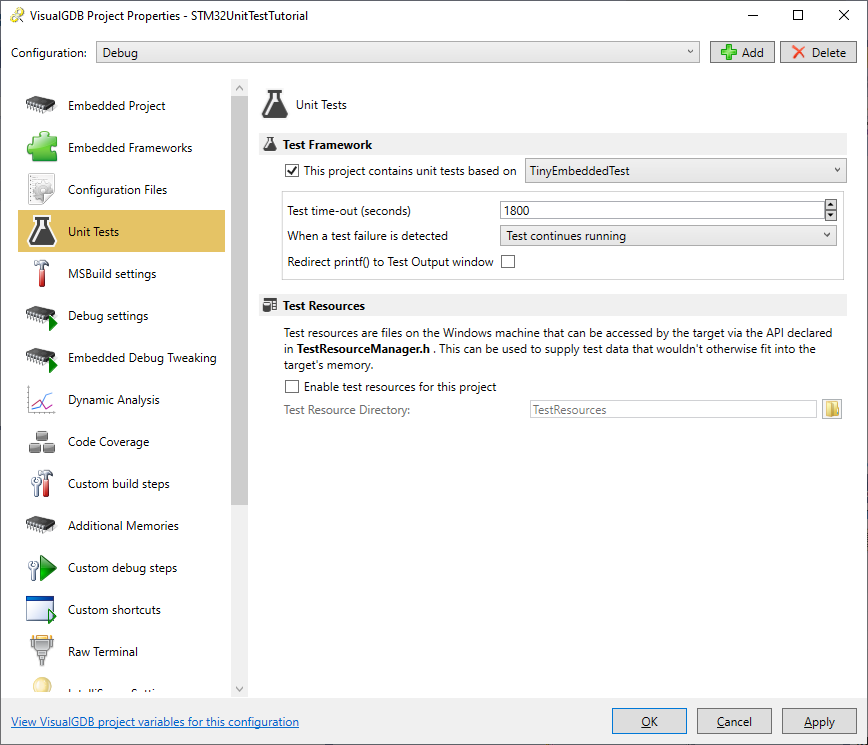
- You can use the Test Framework page of VisualGDB Project Properties to customize various properties of the test framework:


Now that you got the first test project running, try the following tutorials to get the best out of your test setup: