Using Live Tracing to Trace FreeRTOS Events
This tutorial shows how to use the VisualGDB’s Live Tracing feature to record the flow of a simple 2-thread program that reads bytes via UART and replies back to them with the “You typed <…>” messages. The program will consist of 2 threads (ProcessingThread() and SendingThread()), 2 queues (s_RXQueue and s_TXQueue) and one semaphore (s_TXReadySemaphore) used to determine when a UART transmission has been completed and a new character is ready to be sent: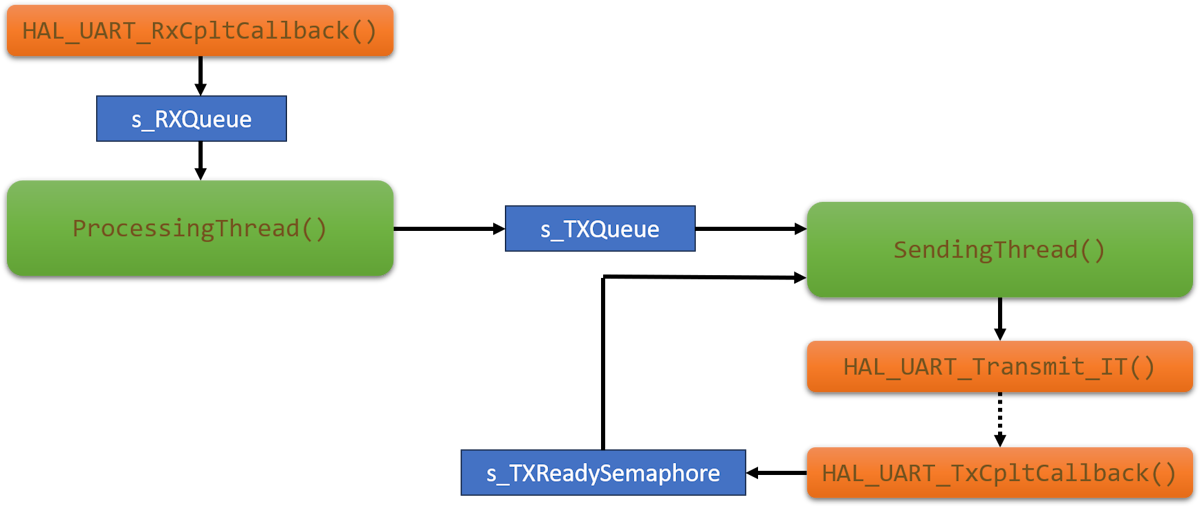 We will use Live Tracing to create a detailed recording of the program flow (exact functions called, queue sizes, sent/received data) without having to instrument it or change any code. The tracepoints will be injected into the program dynamically, will run directly on the device with minimal overhead, and VisualGDB will use them to generate a detailed report showing what exactly happened on the device.
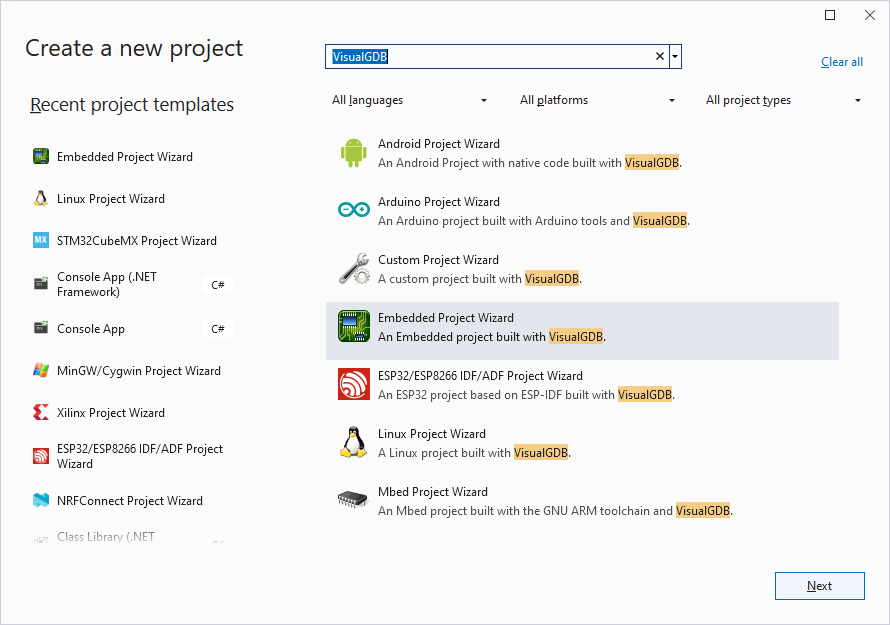
- Start Visual Studio and locate the VisualGDB Embedded Project Wizard:
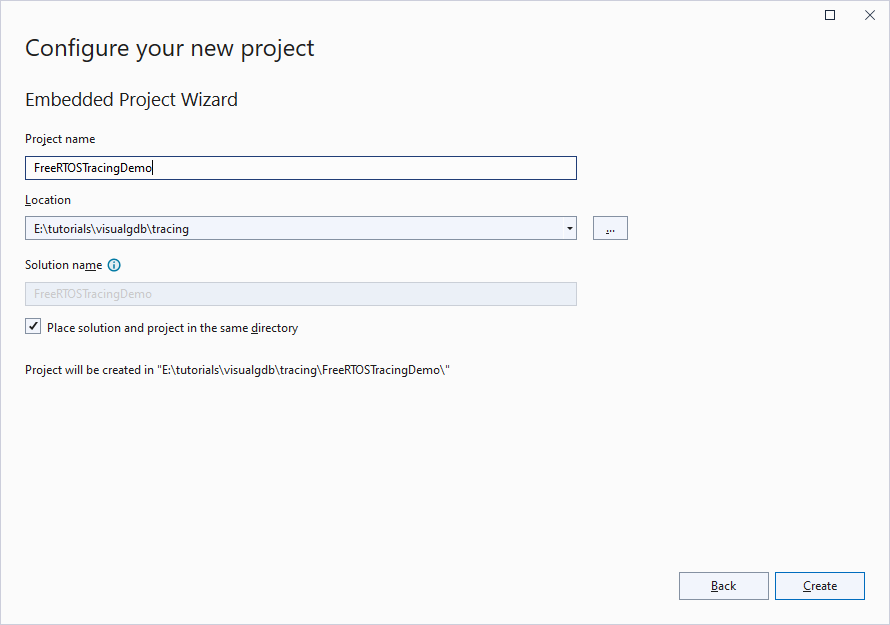
- Enter the name and location for the new project:
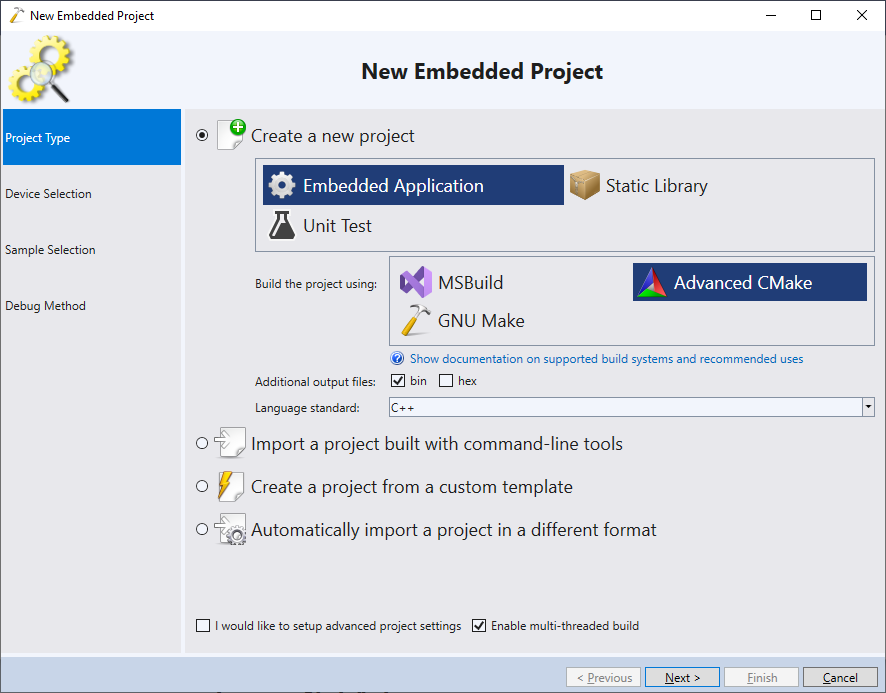
- Select “Create an embedded application -> Advanced CMake”. Live Tracing will also work with other project types (including unit test projects):
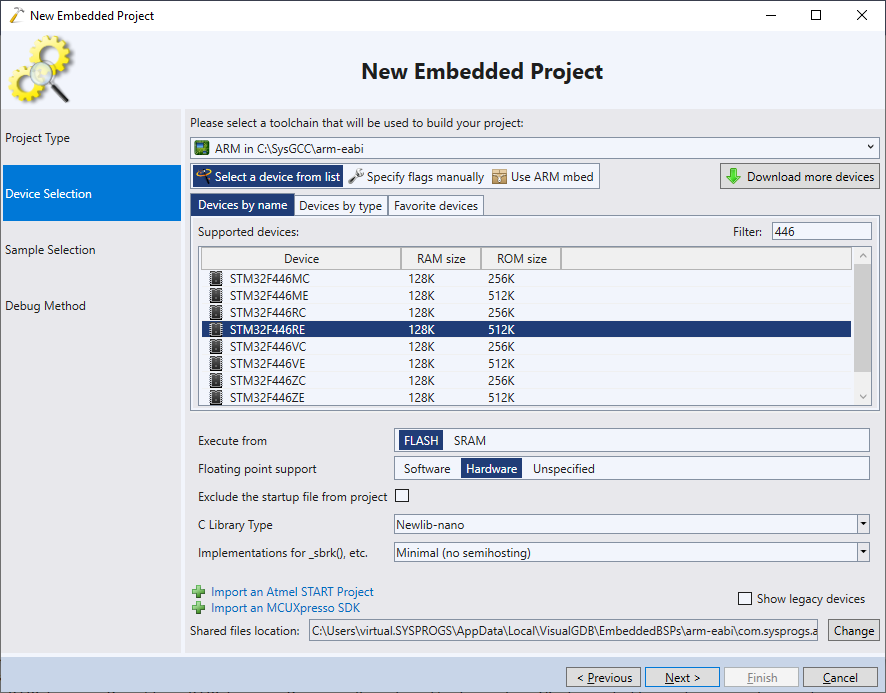
- Select the latest ARM toolchain and pick your device:
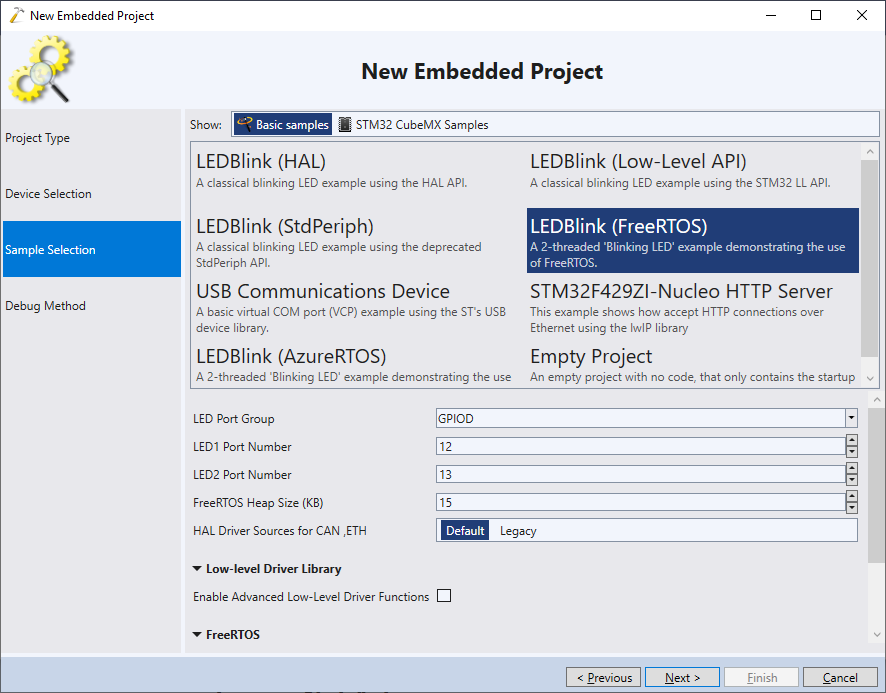
- Select the “LEDBlink (FreeRTOS)” sample:
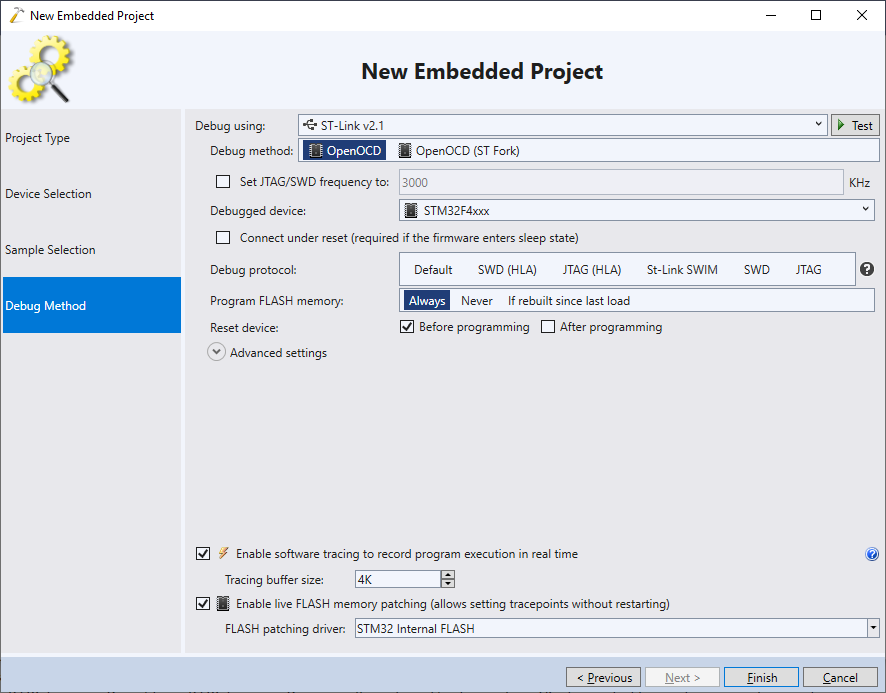
- On the last page of the wizard select the debug settings that work in your configuration and make sure tracing and FLASH patching are enabled:
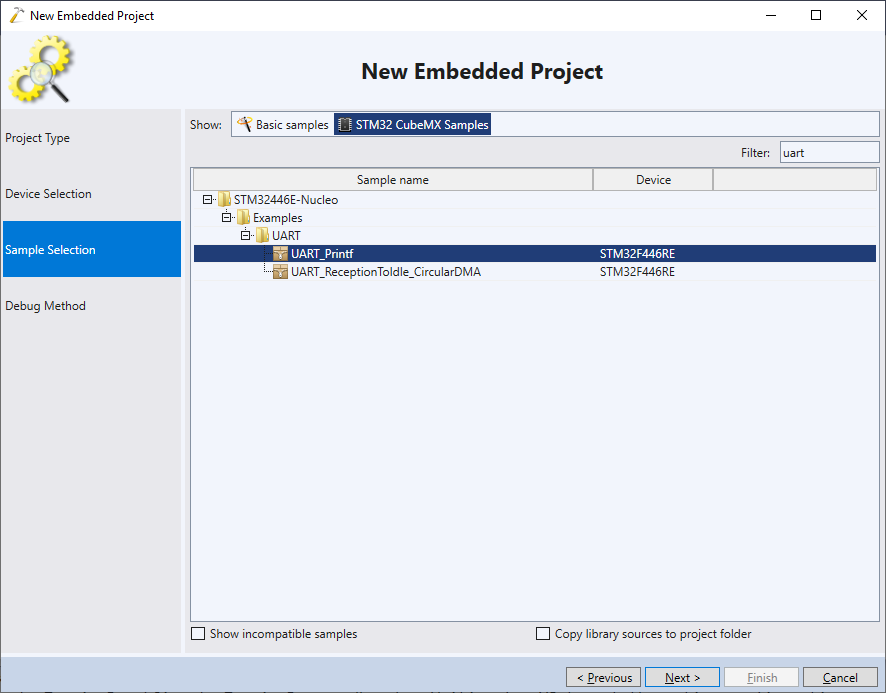
- Now we will add the UART functionality to the basic FreeRTOS project. The easiest way to do it would be to clone a UART sample for your board into a separate project (or use STM32CubeMX to generate it):
- Create a separate file called UARTFunctions.c and copy the the following logic from the UART sample:
Logic Description Destination function SystemClock_Config() Configures system clock so that UART can run with correct frequency SystemClock_Config() Calls to HAL_GPIO_Init(USARTx_TX_GPIO_PORT, …) Configures I/O pins used by UART UART_Init() Call to HAL_UART_Init() Configures UART frequency, bit count, parity, etc UART_Init() You can find sample UARTFunctions.c and UARTFunctions.h files for the Nucleo-STM32F446RE board in our GitHub repository.
- Call SystemClock_Config() and UART_Init() from the main() function. Then modify it to enable the UART interrupt:
void USART2_IRQHandler()
{
    HAL_UART_IRQHandler(&UartHandle);
}

int main()
{
    /* ... */
    NVIC_SetPriority(USART2_IRQn, configLIBRARY_LOWEST_INTERRUPT_PRIORITY);
    NVIC_EnableIRQ(USART2_IRQn);
}
- Define and create the RX/TX queues and a semaphore described at the beginning of the tutorial:
static QueueHandle_t s_RXQueue, s_TXQueue;
static SemaphoreHandle_t s_TXReadySemaphore;
static uint8_t s_RxCharacter, s_TxCharacter;
int main()
{
    /* ... */
    s_RXQueue = xQueueCreate(128, 1);
    s_TXQueue = xQueueCreate(128, 1);
    s_TXReadySemaphore = xSemaphoreCreateBinary();
}
- Define the ProcessingThread() function that will initiate a UART receive operation, wait for the data to come from the s_RXQueue, format the reply and send it into s_TXQueue. Also add a HAL_UART_RxCpltCallback() handler that will push the received characters into s_RXQueue:
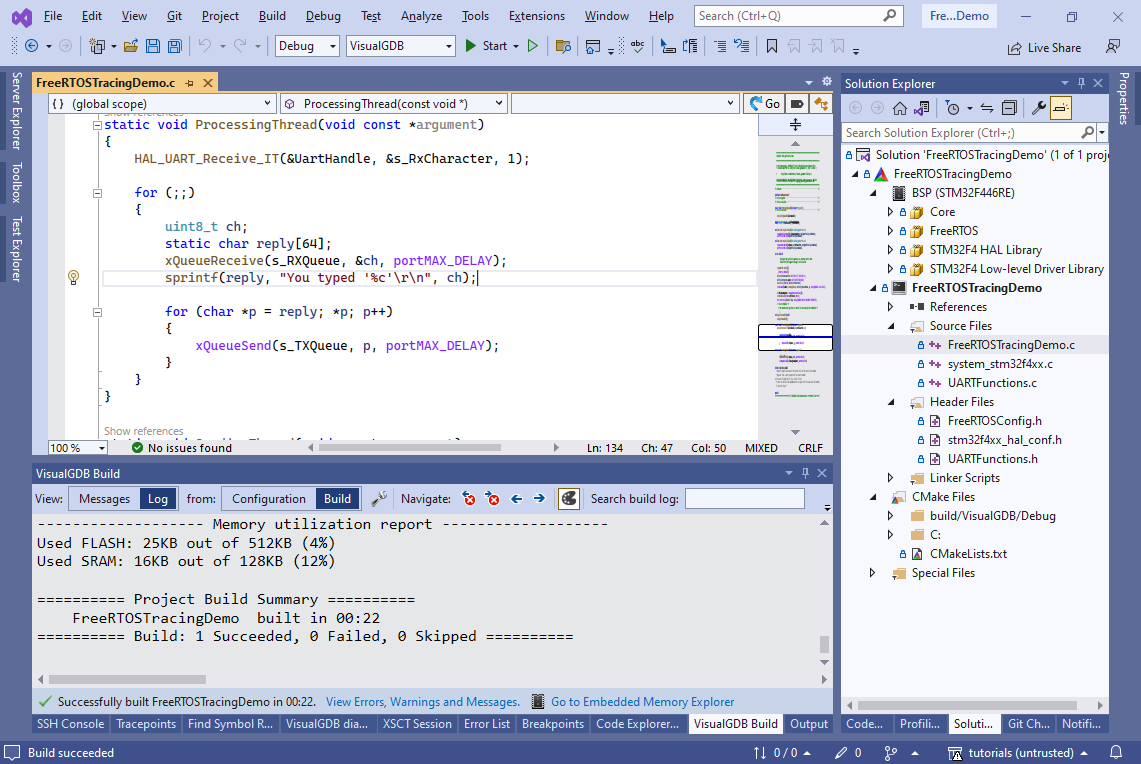
static void ProcessingThread(void const *argument)
{
    HAL_UART_Receive_IT(&UartHandle, &s_RxCharacter, 1);

    for (int i = 0;;i++)
    {
    	uint8_t ch;
    	static char reply[64];
    	xQueueReceive(s_RXQueue, &ch, portMAX_DELAY);
    	sprintf(reply, "You typed '%c'\r\n", ch);

    	for (char *p = reply; *p; p++)
    	{
       	    xQueueSend(s_TXQueue, p, portMAX_DELAY);
    	}
    }
}

void HAL_UART_RxCpltCallback(UART_HandleTypeDef *huart)
{
    BaseType_t xHigherPriorityTaskWoken = pdFALSE;
    xQueueSendFromISR(s_RXQueue, &s_RxCharacter, &xHigherPriorityTaskWoken);
    HAL_UART_Receive_IT(&UartHandle, &s_RxCharacter, 1);
    portYIELD_FROM_ISR(xHigherPriorityTaskWoken);
}
- Similarly, add a SendingThread() function that will send the contents of s_TXQueue to UART, along with the HAL_UART_TxCpltCallback() handler that will signal the semaphore:
static void SendingThread(void const *argument)
{
    for (;;)
    {
        uint8_t ch;
        xQueueReceive(s_TXQueue, &ch, portMAX_DELAY);

        HAL_UART_Transmit_IT(&UartHandle, &ch, 1);
        xSemaphoreTake(s_TXReadySemaphore, portMAX_DELAY);
    }
}

void HAL_UART_TxCpltCallback(UART_HandleTypeDef *huart)
{
    BaseType_t xHigherPriorityTaskWoken;
    xSemaphoreGiveFromISR(s_TXReadySemaphore, &xHigherPriorityTaskWoken);
    portYIELD_FROM_ISR(xHigherPriorityTaskWoken);
}
- Finally, create and start both threads from main():
    osThreadDef(Process, ProcessingThread, osPriorityNormal, 0, configMINIMAL_STACK_SIZE);
    osThreadDef(Sender, SendingThread, osPriorityAboveNormal, 0, configMINIMAL_STACK_SIZE);
    osThreadCreate(osThread(Process), NULL);
    osThreadCreate(osThread(Sender), NULL);
- The final version of the code should look like this. Build it, and run it under the debugger:
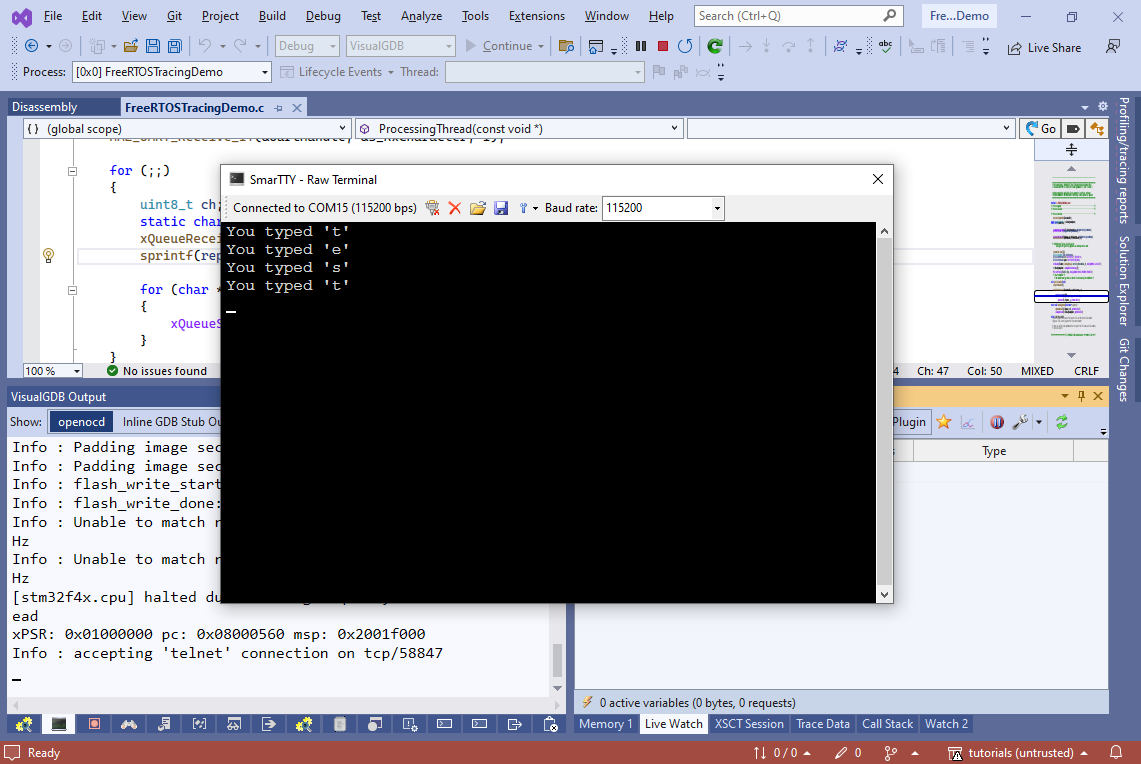
- Connect to the virtual COM port provided by ST-Link using SmarTTY or any other terminal client, and try typing some characters there. You will see the program reply back with the “You typed” messages:
- Now we will use the Live Tracing GUI to record what exactly happens inside the program without interrupting it. Open the Debug->Windows->Live Tracing window, click “Create a function tracepoint”, enter “UART in the filter”, and press Ctrl-A, <space> to select all of them for tracing:
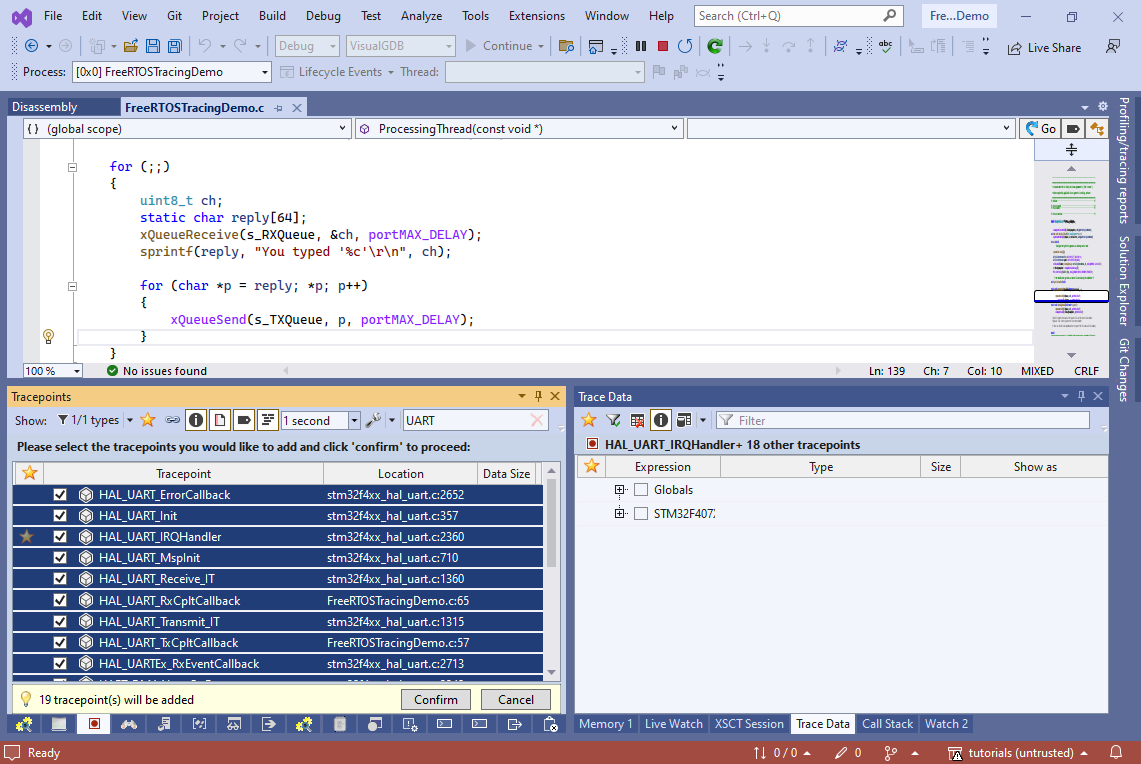
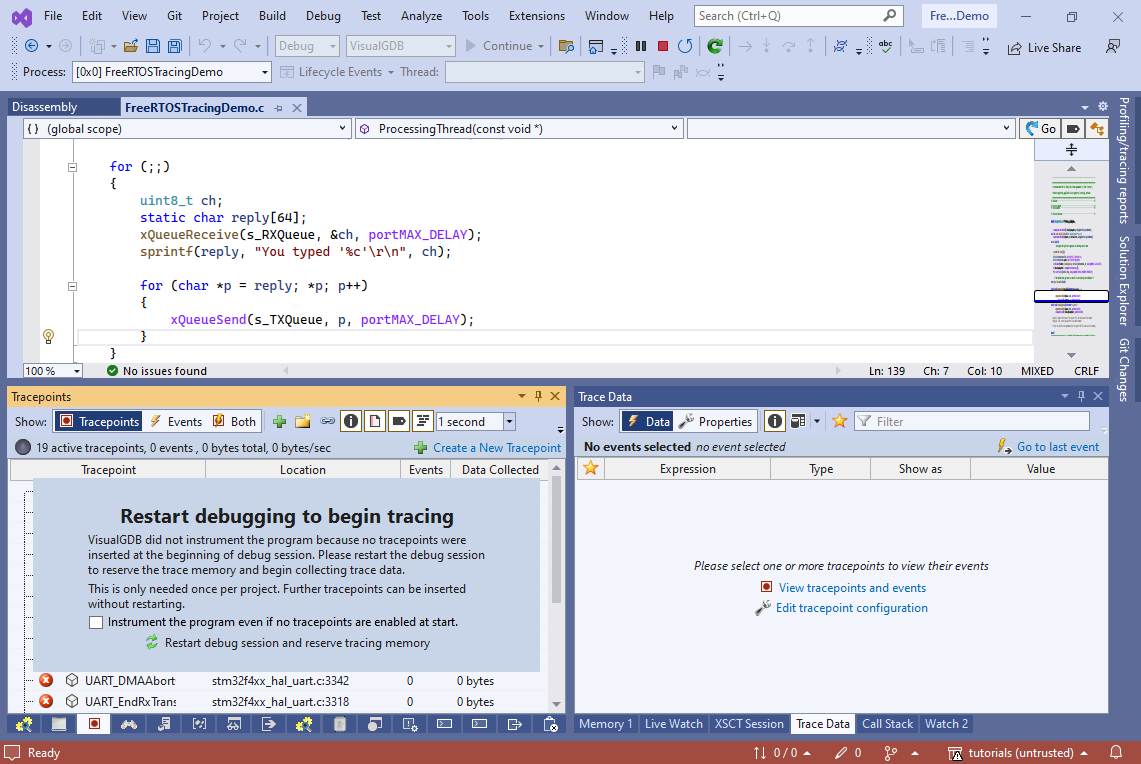
- If you have not created any tracepoints before, VisualGDB will suggest restarting the debug session so that it could reserve memory for the tracepoints. Once this is done, you can add and remove tracepoints during debugging without any further restarts:
- Type something in the terminal window and watch how the Events view in the Tracepoints window now shows which exact UART-related functions were called. You can navigate between the events in the Tracepoints view to have their locations highlighted in the editor:
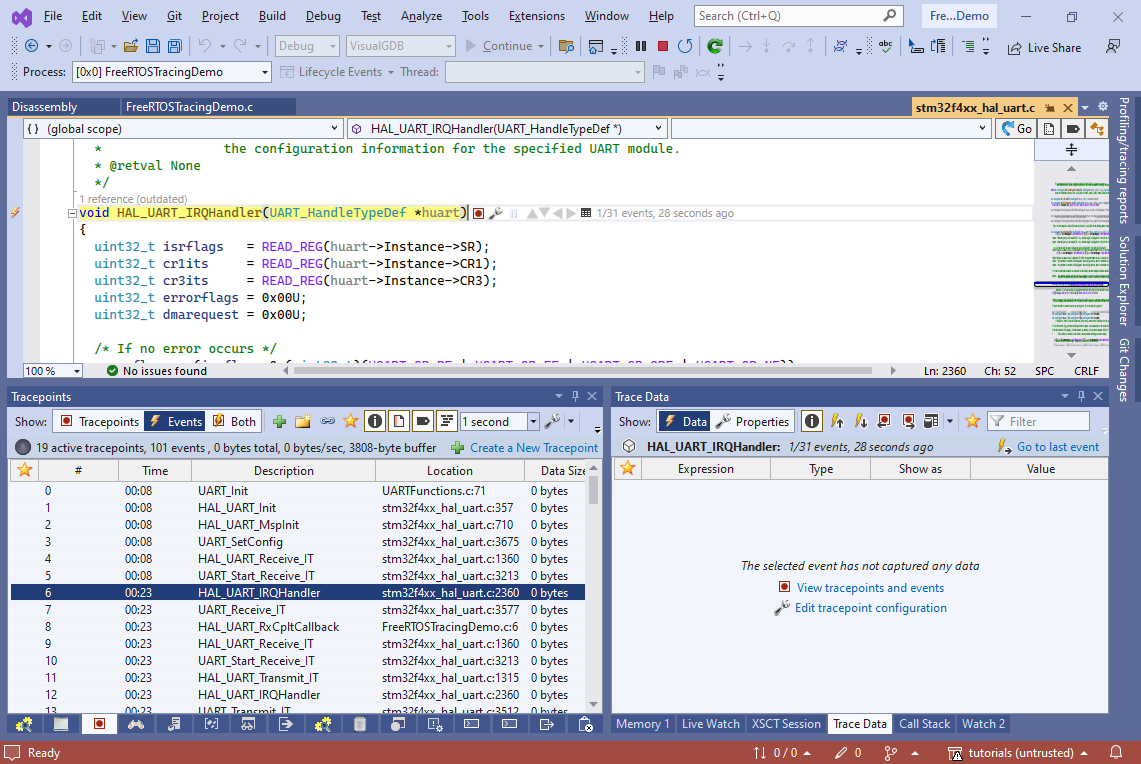
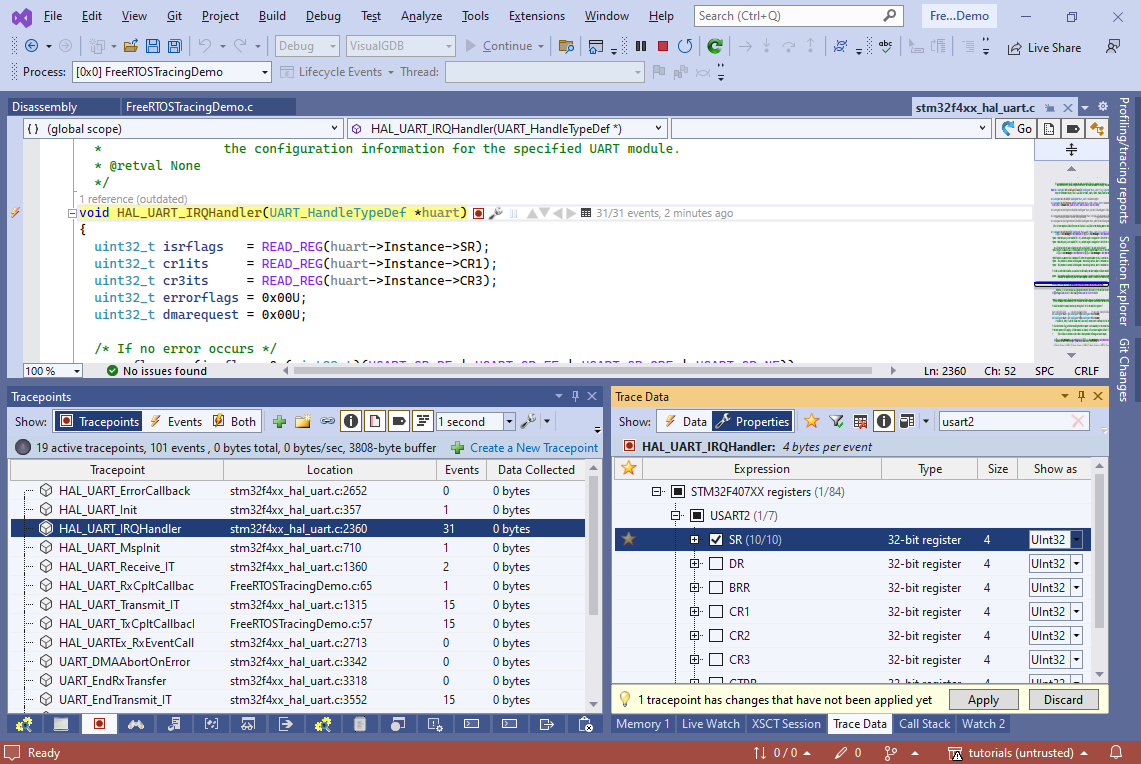
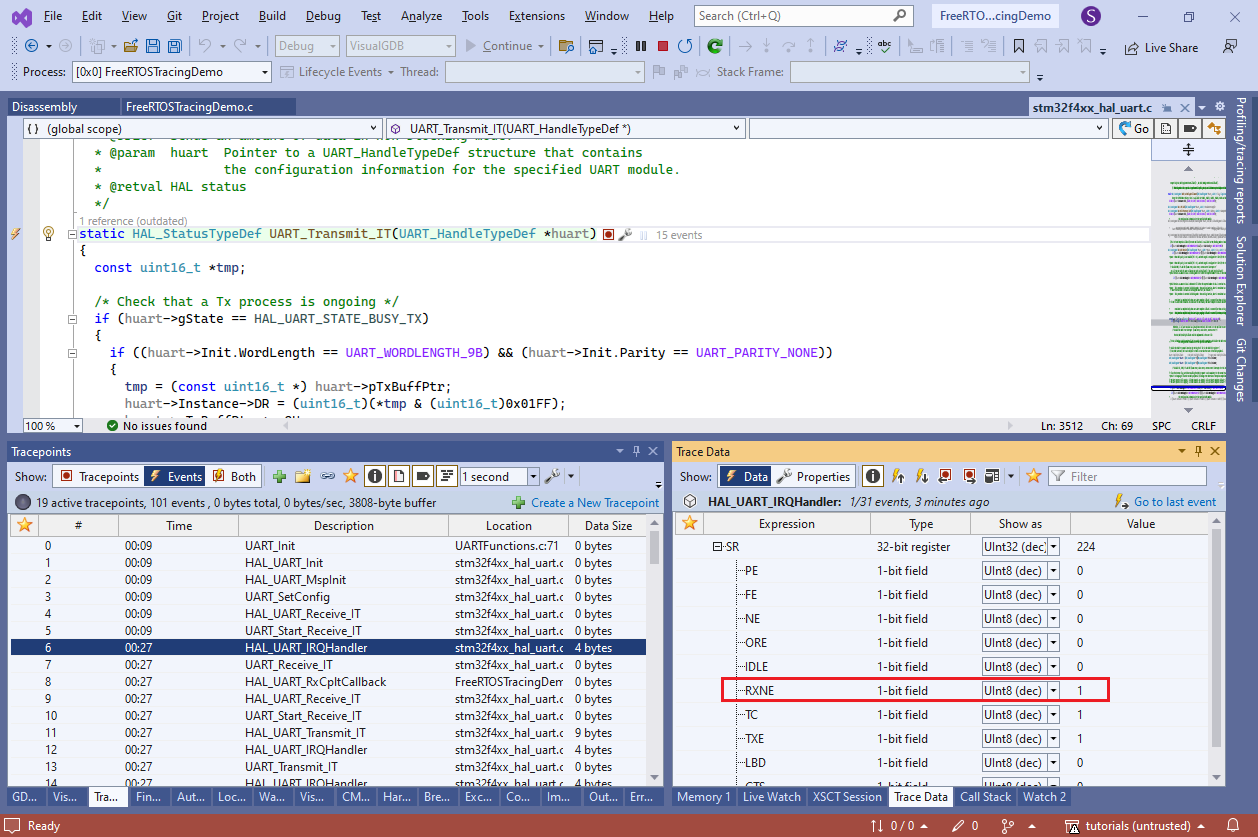
- Locate the HAL_UART_IRQHandler() tracepoint and switch the Trace Data view to Properties. Select to trace the USART2->SR register:
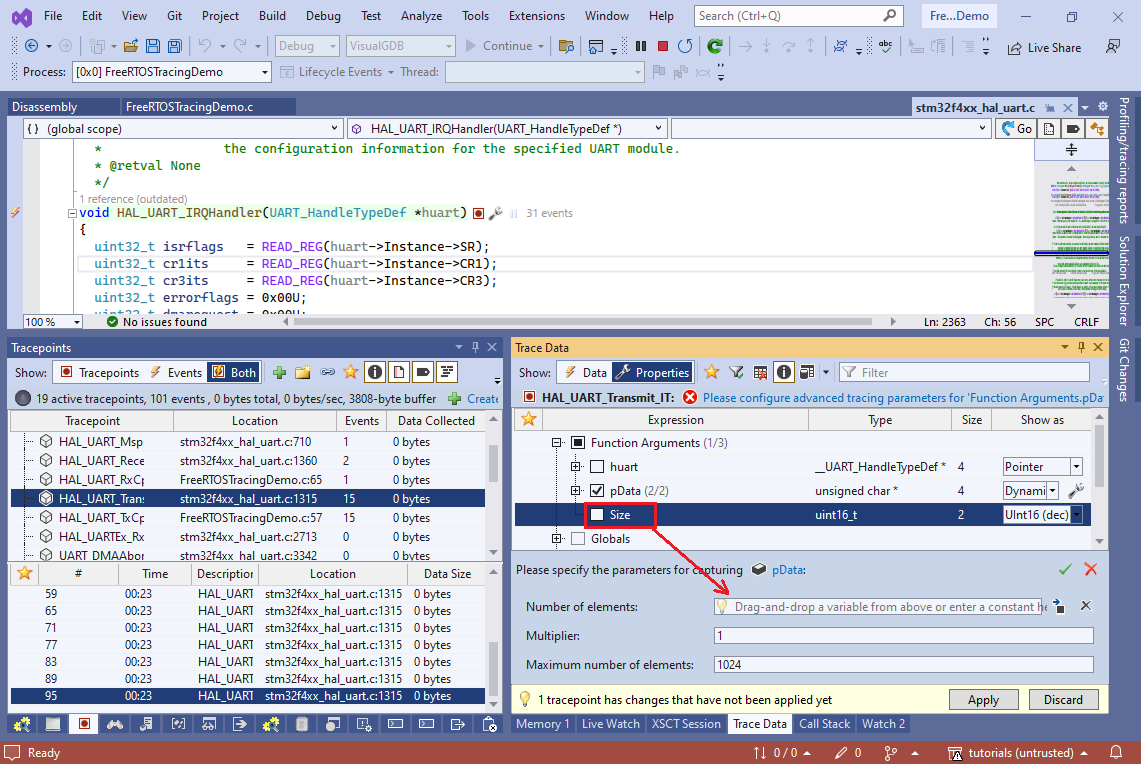
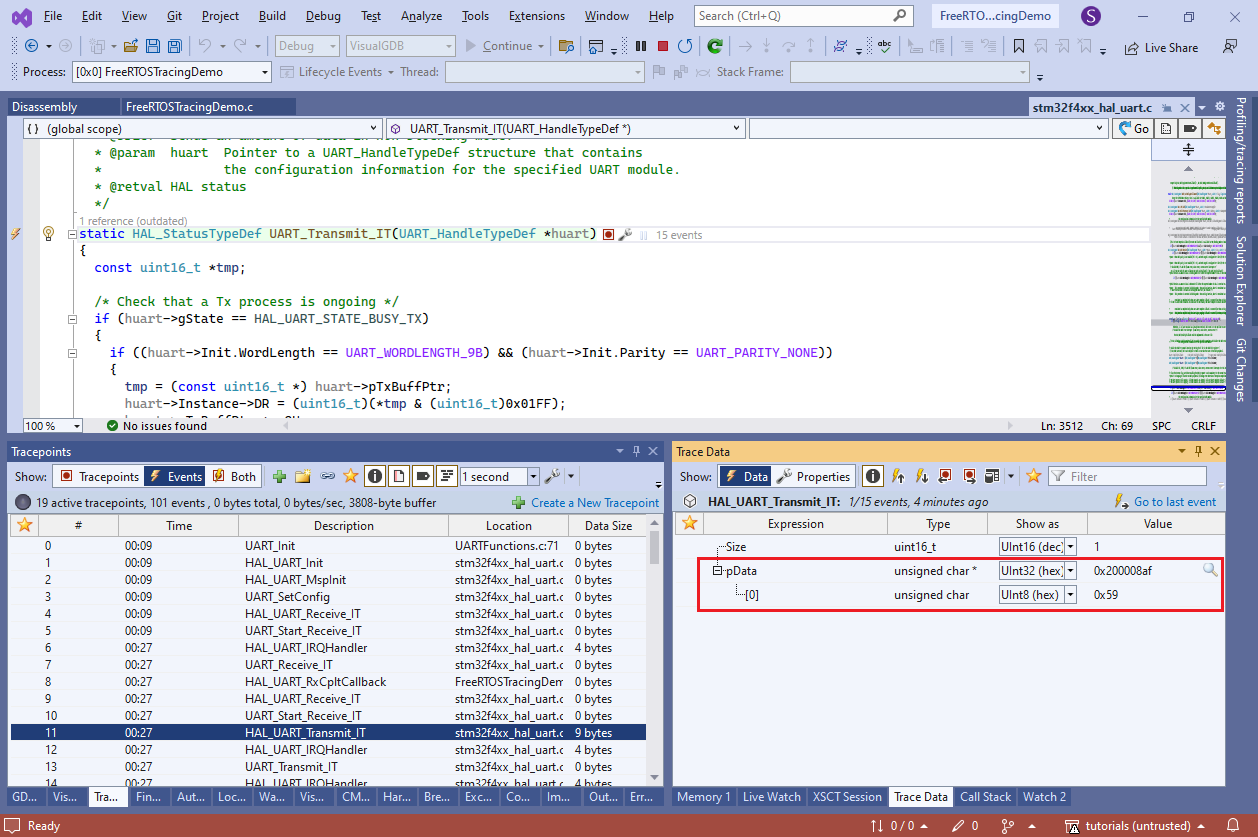
- Go to the HAL_UART_Transmit_IT() tracepoint and start tracing pData as a dynamic array. Drag Size into the “number of elements” field:
- Click “Apply” to modify the tracepoints. Now VisualGDB will record the UART flags each time an interrupt happens:
- Similarly, it will record the exact sent data on each call to HAL_UART_Transmit_IT():
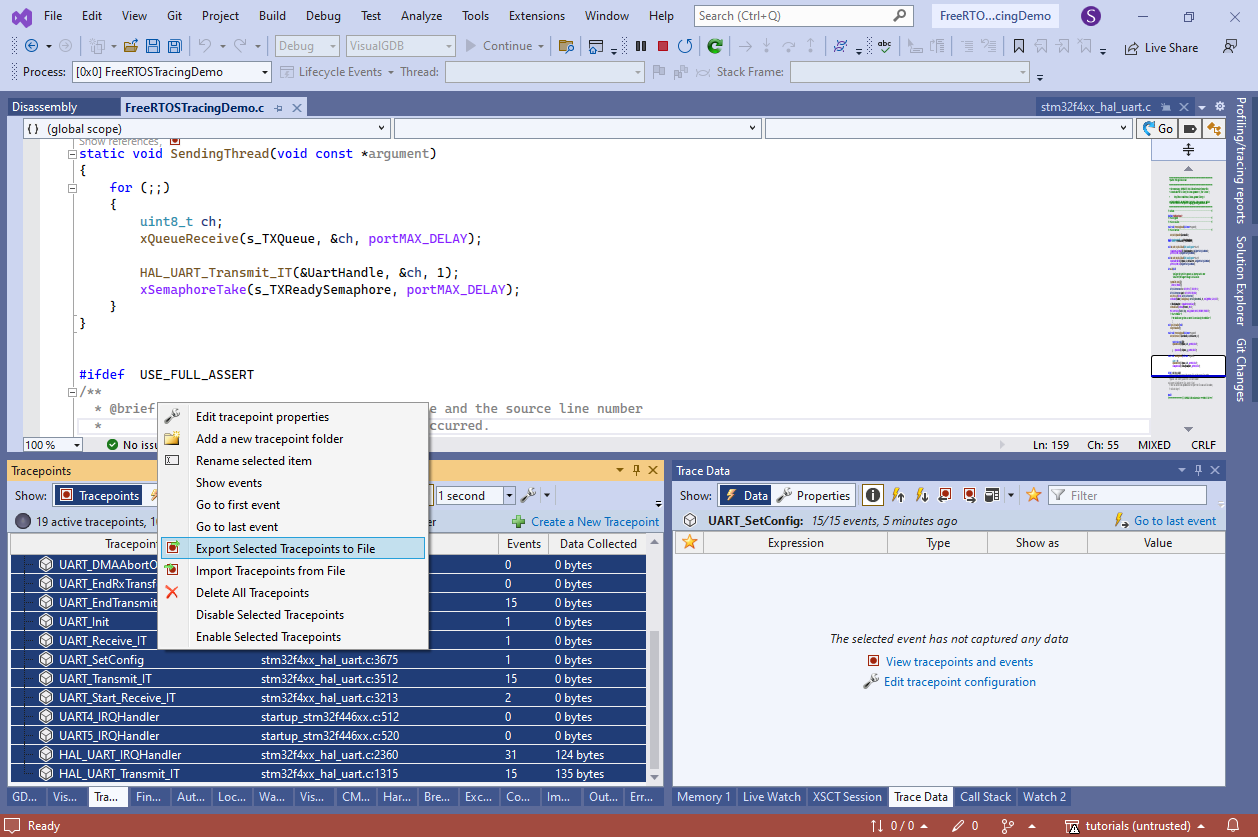
- Select all tracepoints in the Tracepoitns view, right-click and select “Export Selected Tracepoints to File“. Save the tracepoint set somewhere near the project directory:
 At the end of the tutorial we will show how to record traces from saved tracepoint sets using command line, so you can easily compare what different versions of the firmware are doing, or how they react to different environments.
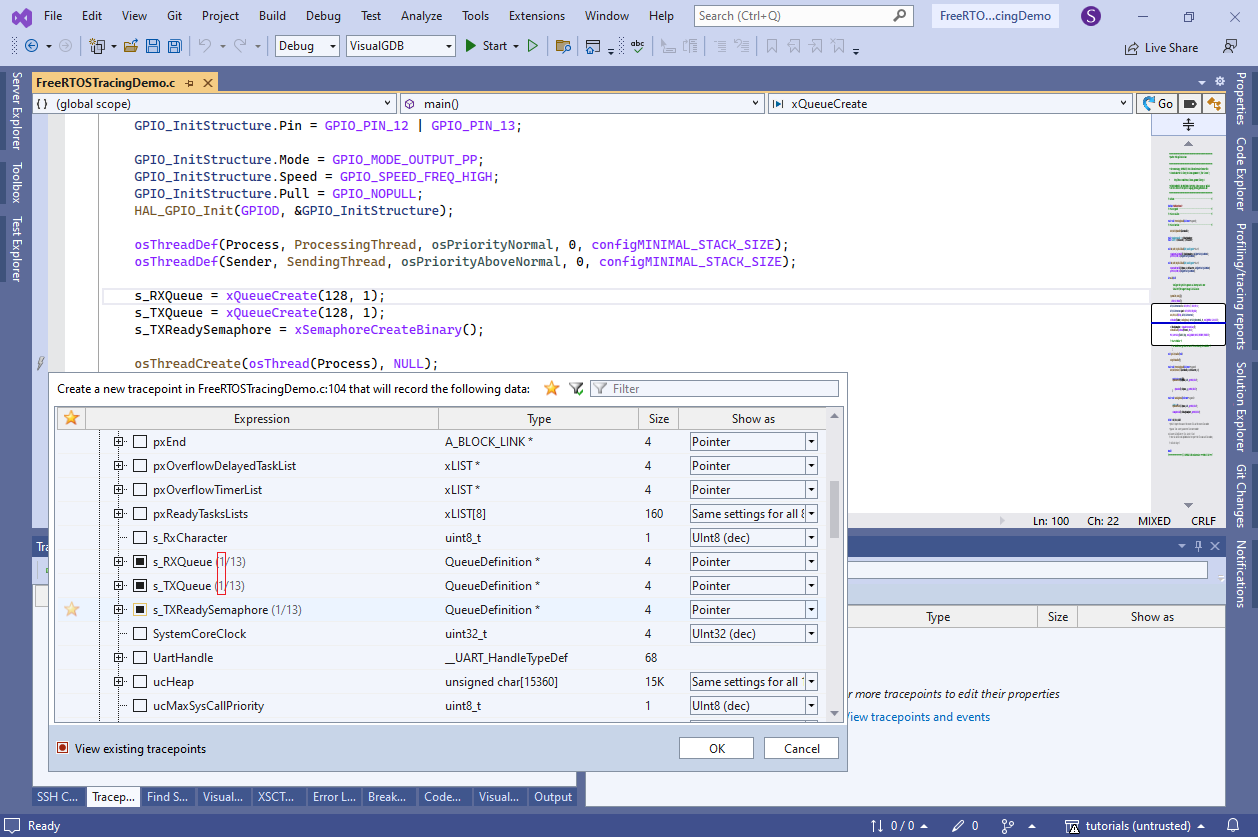
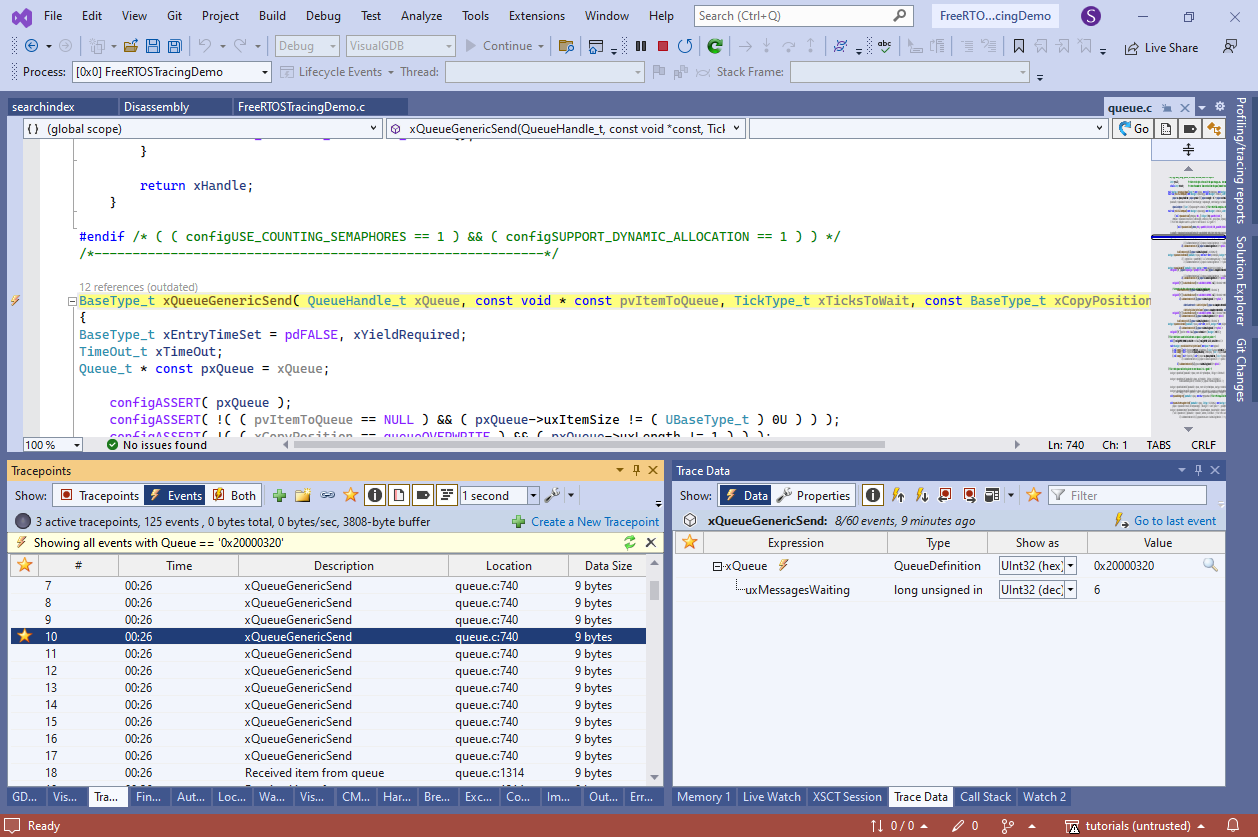
 - Now we will create additional tracepoints to record the queue read/write operations. First of all, add a tracepoint in main() just after the queues got created. Select to trace s_TXQueue, s_RXQueue and s_TXReadySemaphore. If you hold Shift while checking the variables, VisualGDB will trace them in the shallow mode (i.e. will record the pointer value, but not the values of all fields). The (1/13) hint next to the variable names will indicate that only 1 out of 13 sub-variables is being recorded:
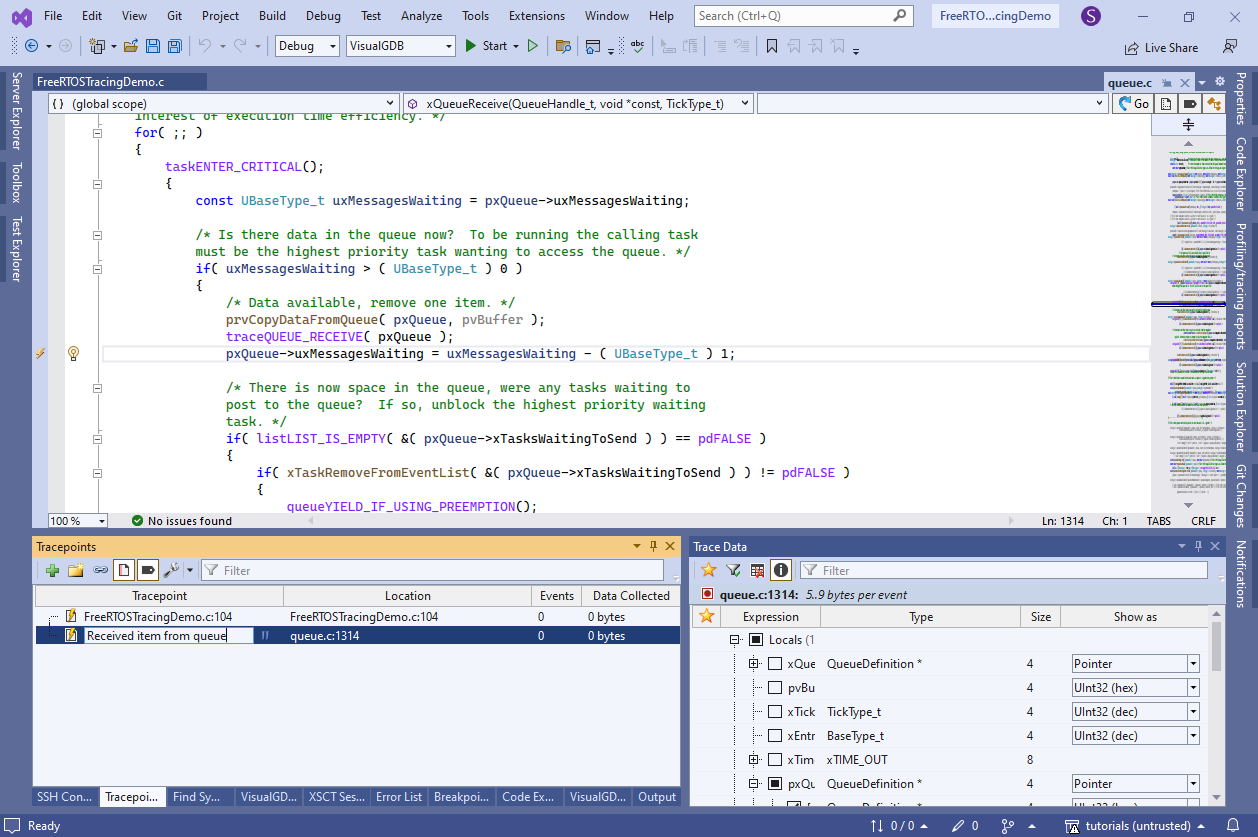
- Go to the xQueueReceive() function in FreeRTOS and set a tracepoint to the line that decrements uxMessagesWaiting. Configure it to trace the pointer value of xQueue and the uxMessagesWaiting field:
 You can rename the newly created tracepoint via the Tracepoints window to see a meaningful name instead of just file:line.
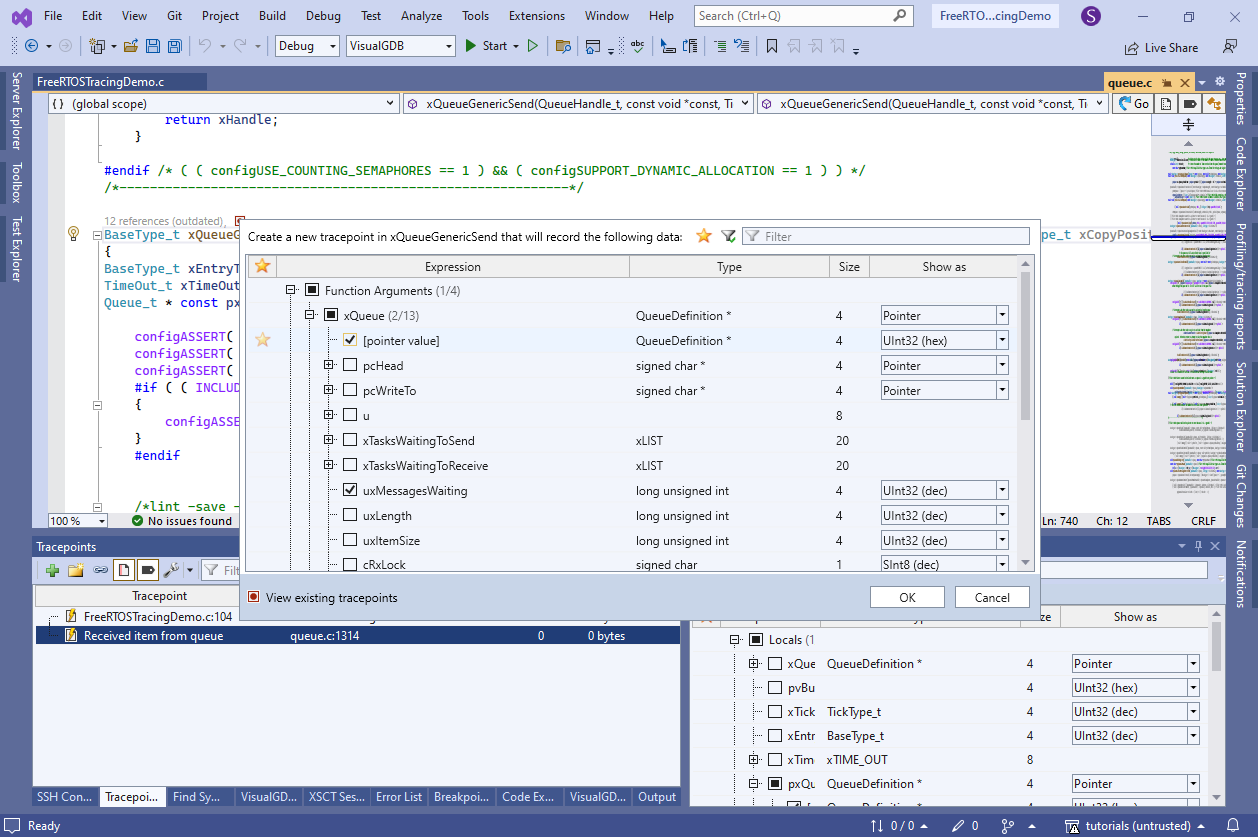
 - Create a tracepoint in xQueueGenericSend() and similarly trace uxMessagesWaiting and the pointer value of xQueue:
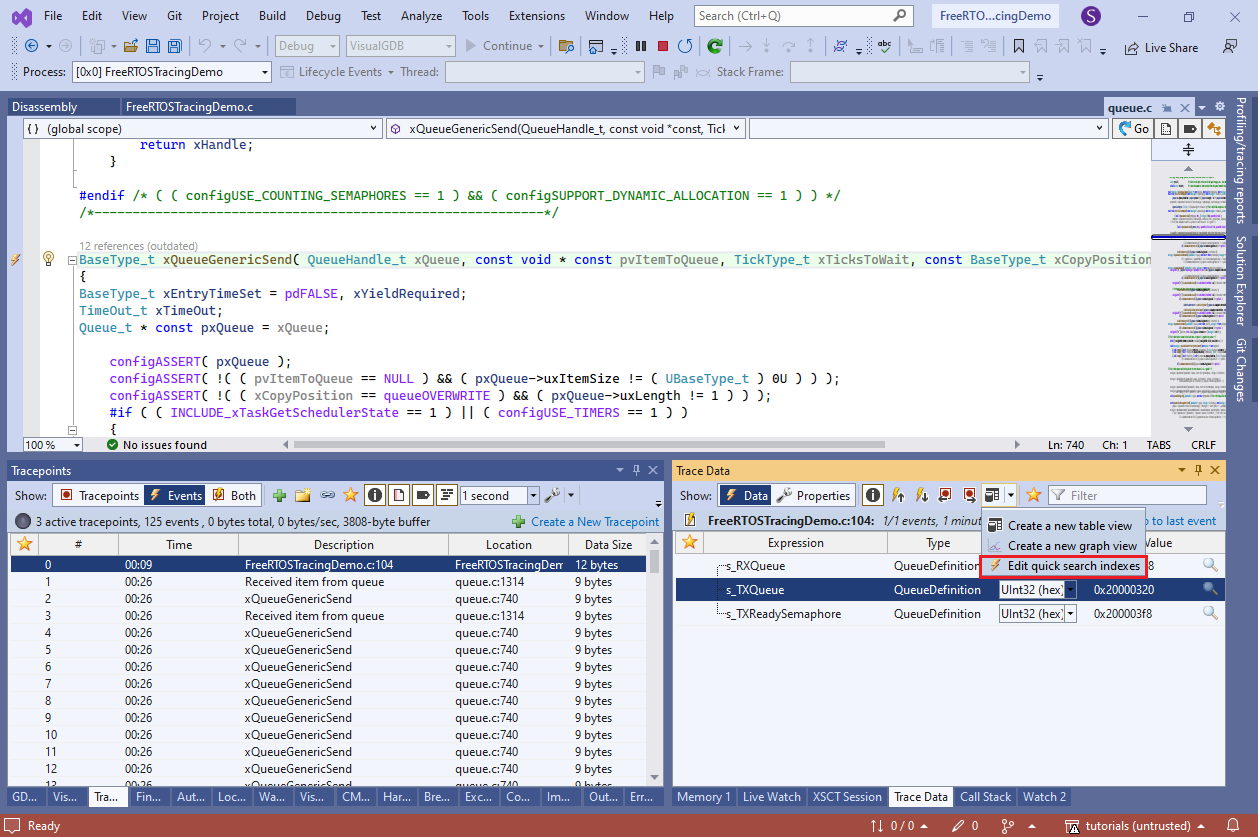
- VisualGDB will now record the creation of the queues, and each time a queue is being used. To quickly separate events belonging to different queues (s_RXQueue, s_TXQueue and even s_TXReadySemaphore that is implemented as a queue), go to the Trace Data window and click “Edit quick search indexes“:
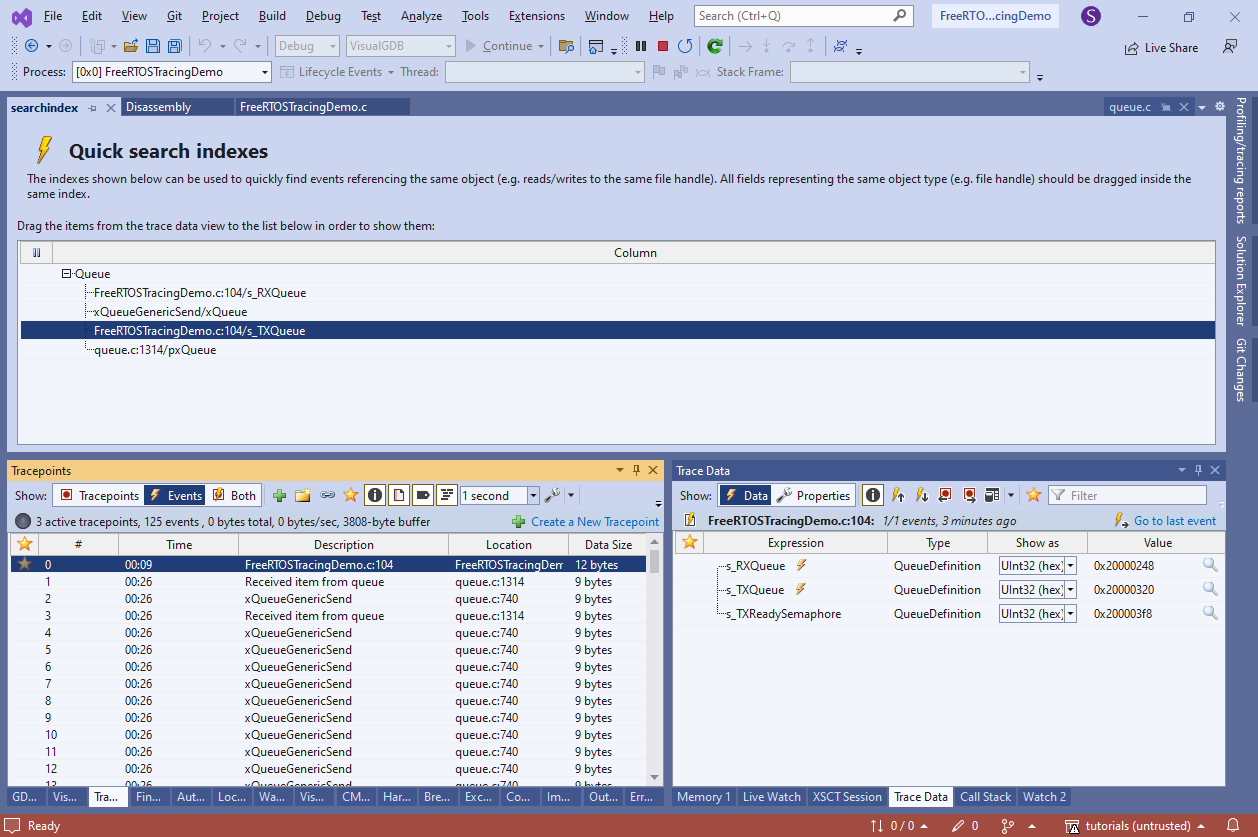
- Drag the s_RXQueue and s_TXQueue fields from the initial tracepoint and the xQueue/pxQueue from other tracepoints into the same index. This will mark them as interchangeable, so VisualGDB will know they are related:
- Go to the initial event and click the event symbol near s_TXQueue:
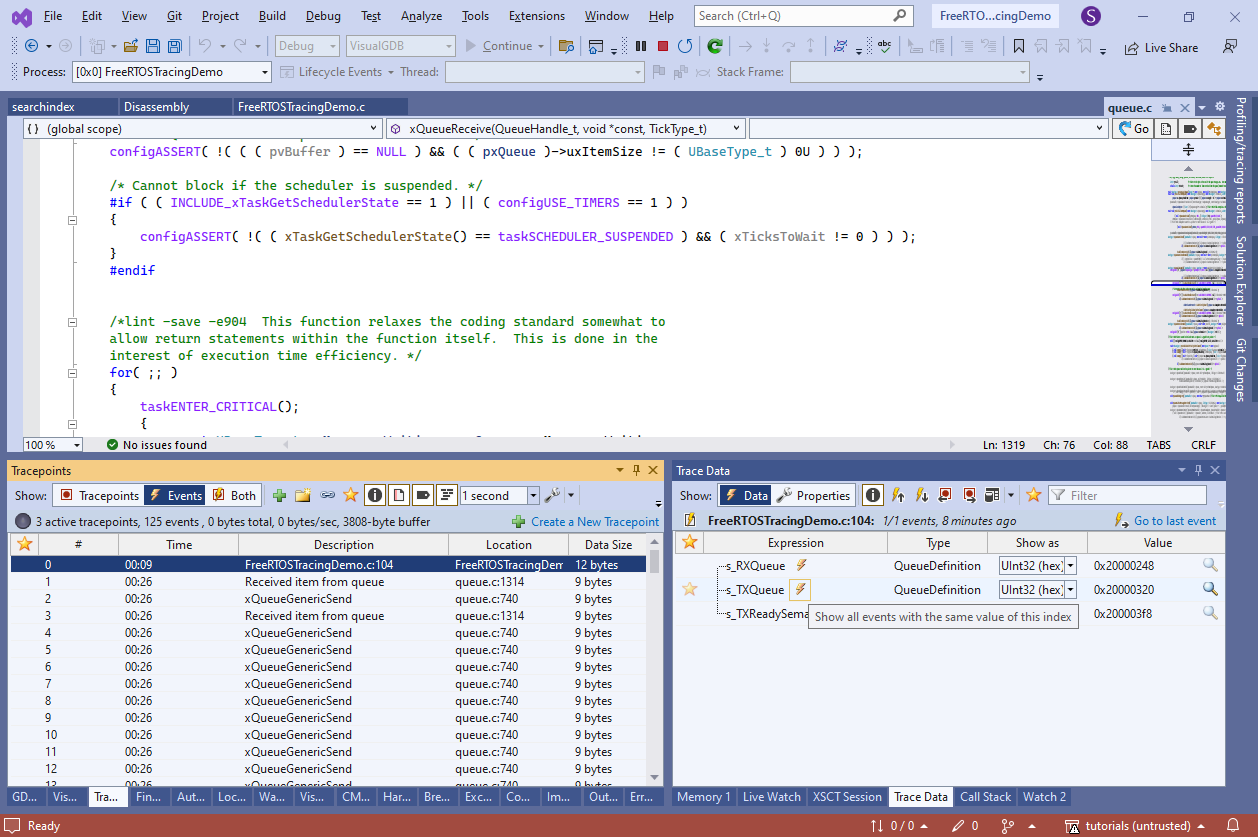
- VisualGDB will quickly find all events having the same value of xQueue/pxQueue:
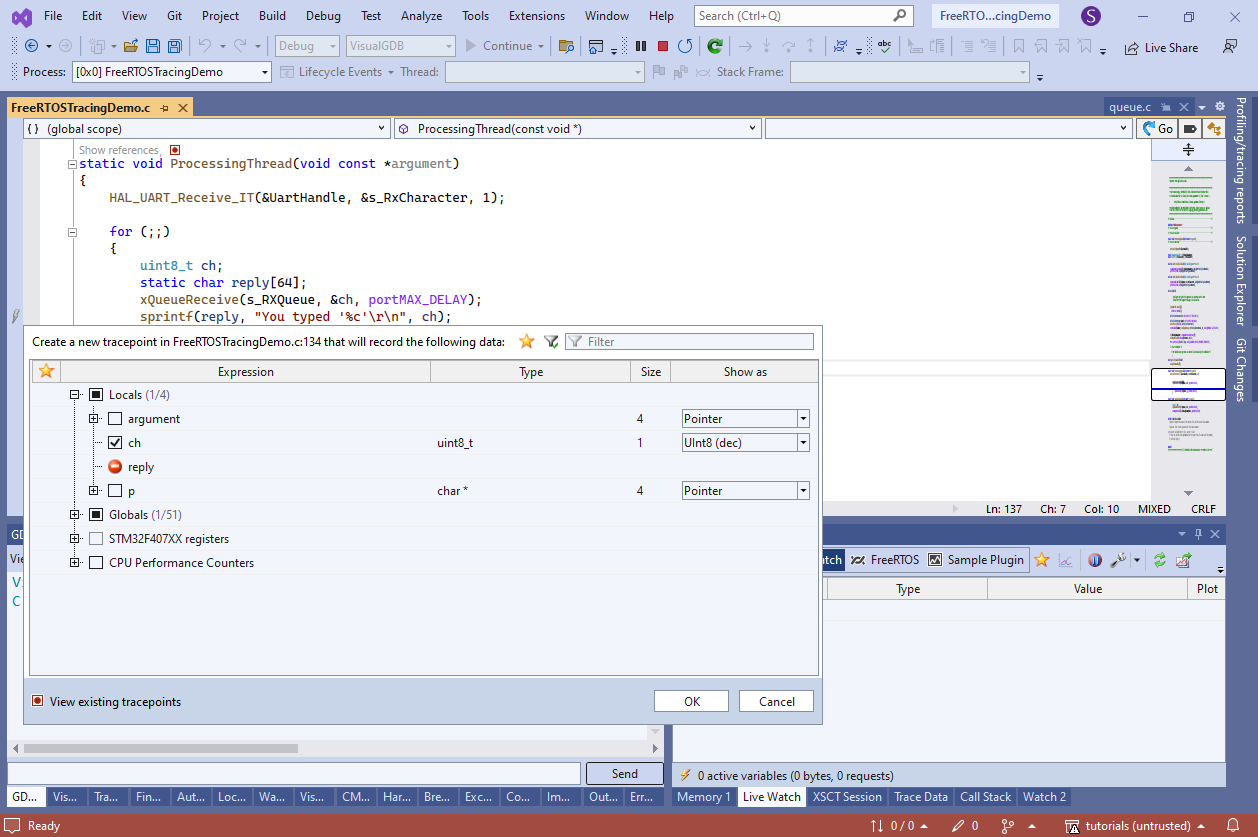
- In order to minimize overhead, live Tracing does not record the call stack, so you cannot quickly see who called the xQueueGenericSend() function to push the charater into the queue. However, you can dynamically add tracepoints in common locations of your code (e.g. ProcessingThread()) and trace arbitrary global variables (e.g. current thread pointer):
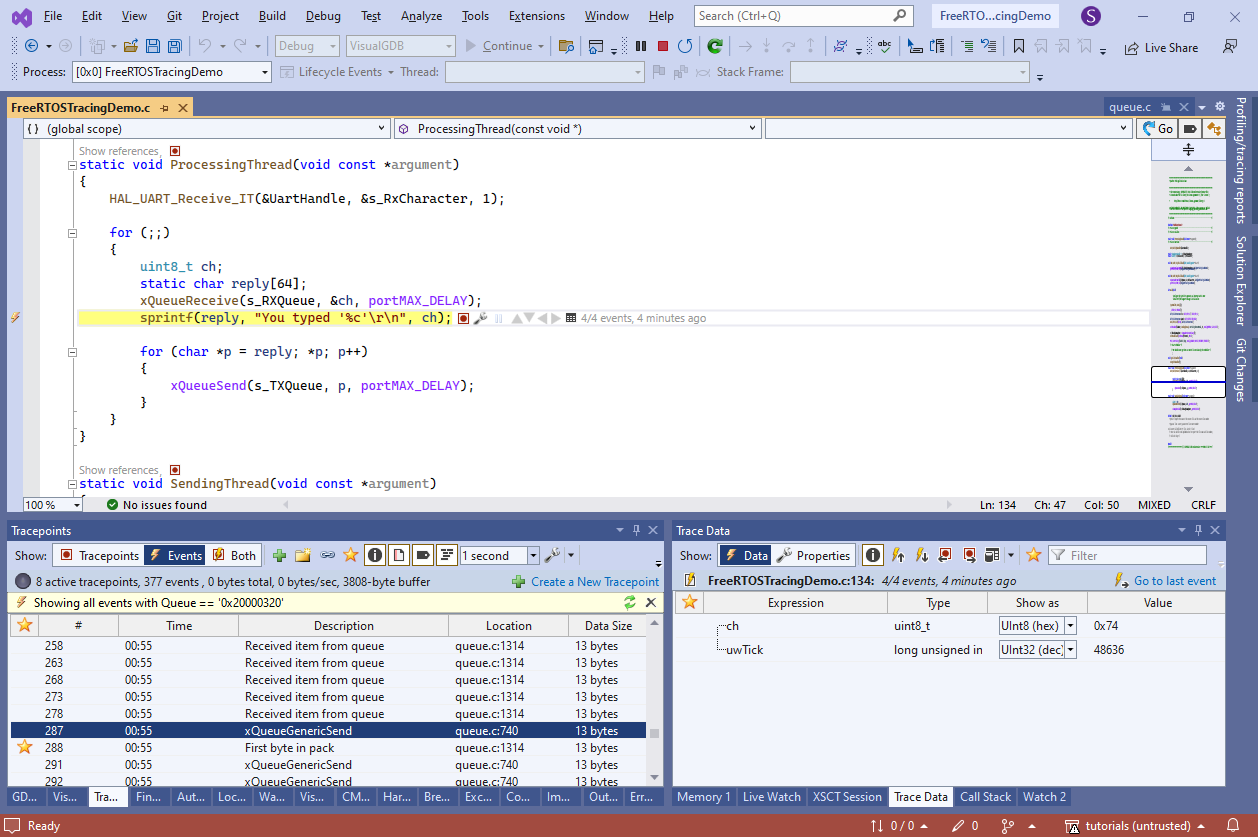
- Then use the navigation buttons in the Trace Data window to quickly go to the previous/next event:
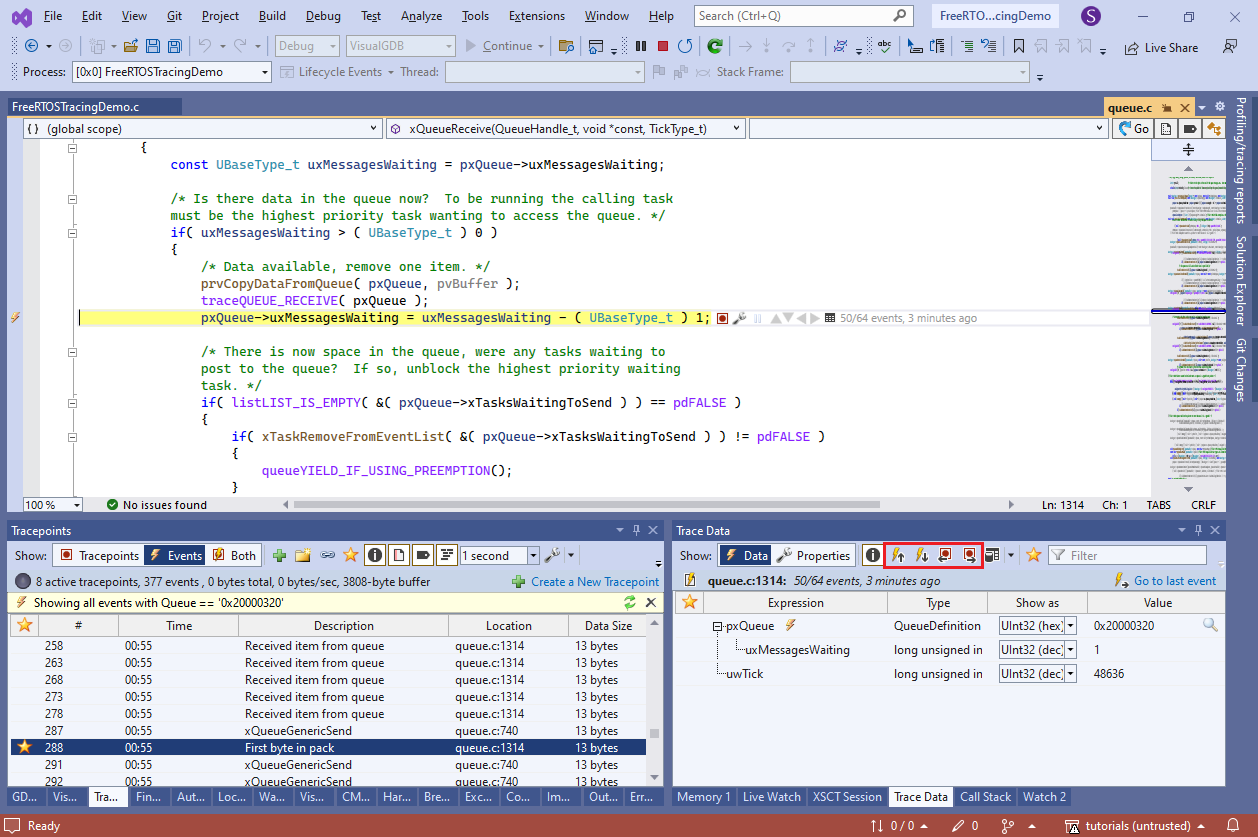
- This way you can see that last traced line before the first call to xQueueGenericSend() was the sprintf() call in ProcessingThread():
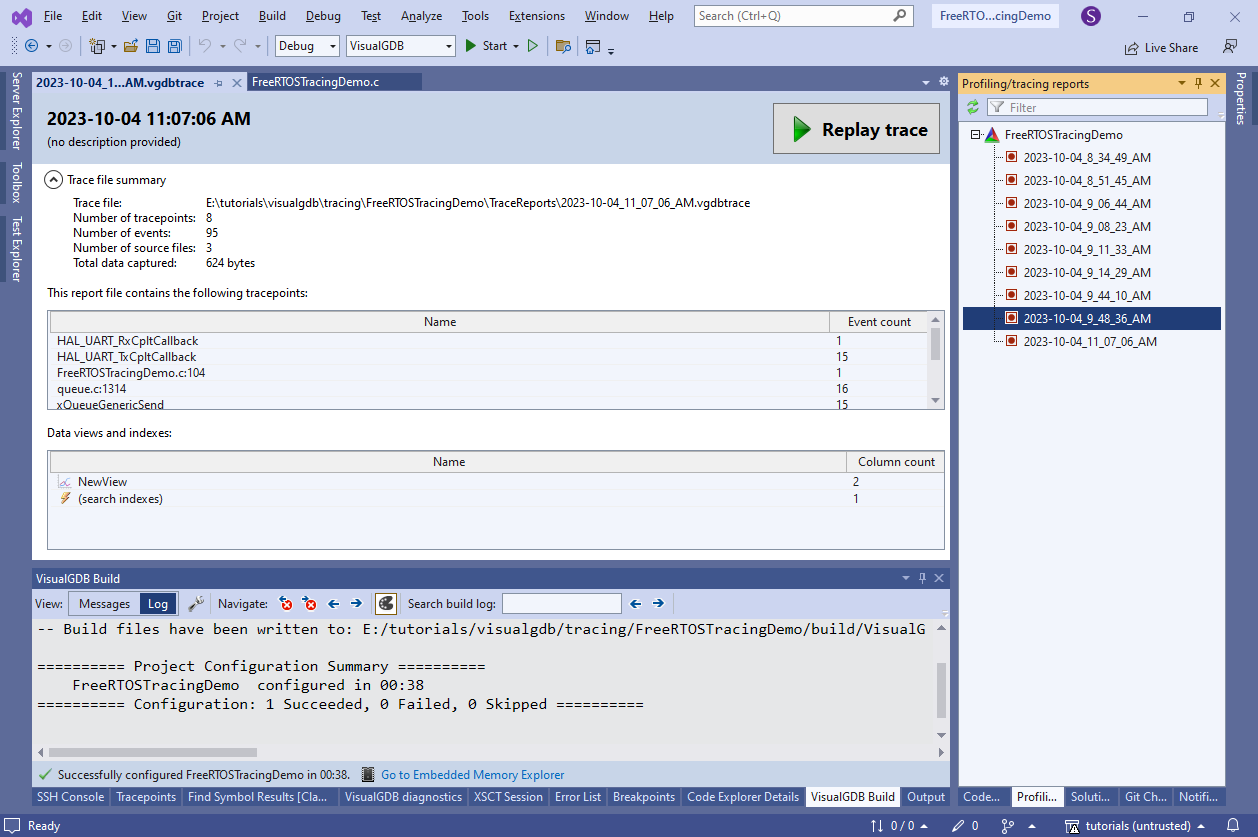
- At the end of each tracing session VisualGDB will produce a tracing report containing all recorded data. You can replay old reports at any time via the Profiling/Tracing Reports window:
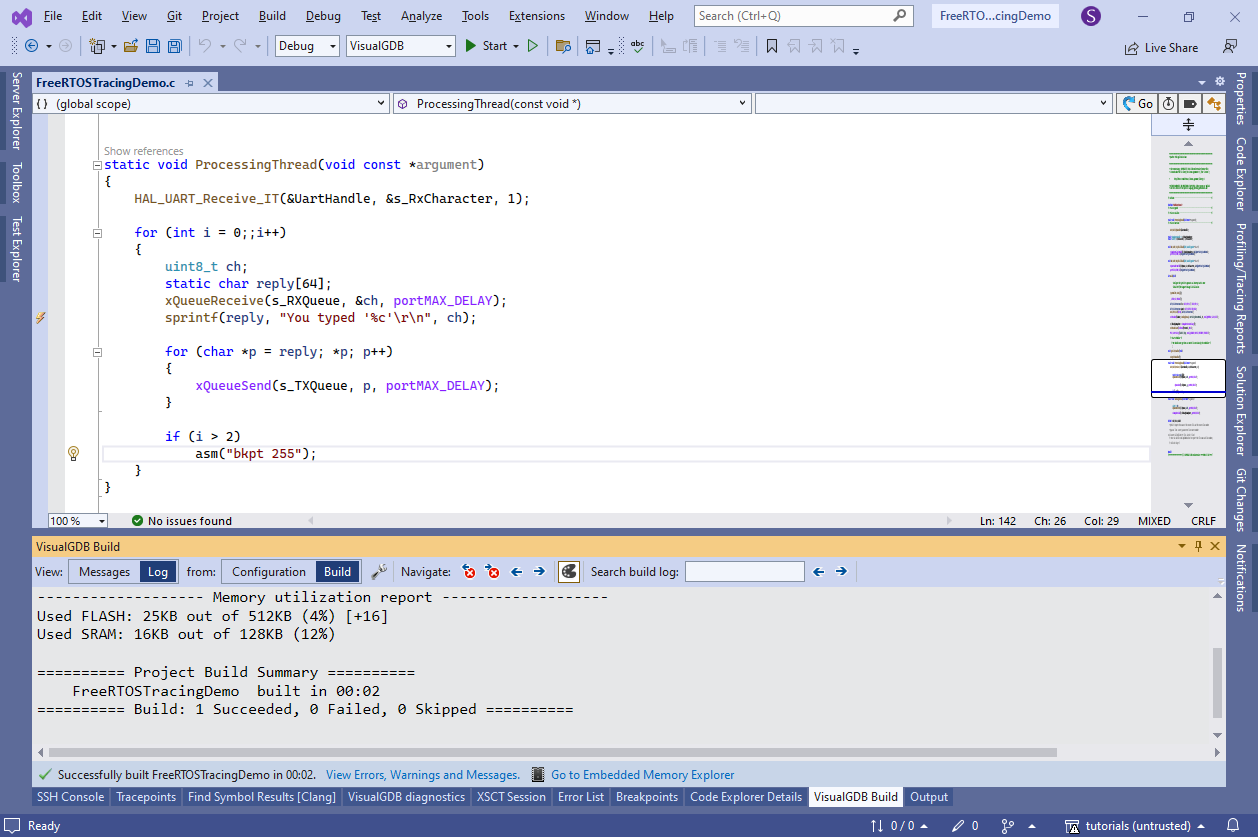
- You can also create tracing reports via command line. Modify the ProcessingThread() function to trigger a breakpoint after 3 iterations:
- Then build the project and run the following command line from the project directory:
"%VISUALGDB_DIR%\VisualGDB.exe" /trace FreeRTOSTracingDemo.vgdbcmake /traceconfig:TracepointSets\UARTFunctions.xml /tracereport:UARTFunctions.vgdbtrace /xmltracereport:UARTFunctions.xml /targetpath:build\VisualGDB\Debug\FreeRTOSTracingDemo
VisualGDB will create 2 reports: a UARTFunctions.vgdbtrace report that can be opened in Visual Studio and replayed, and UARTFunctions.xml report that can be analyzed programmatically.