Tracing Embedded Unit Test Projects
This tutorial shows how to use Live Tracing to record the execution of embedded unit test projects. We will create a basic test project using its own number class with “+” and “*” operators, that will verify the Binomial Theorem by verifying that the (x + y)2 = x2 + 2xy + y2 equation holds.
The addition and multiplication will use the custom operators defined in our number class, and the tracing logic will record every invocation of these operators, so if the tests start failing in the future, you could easily compare the recording against a reference one without re-running the old version on the actual hardware.
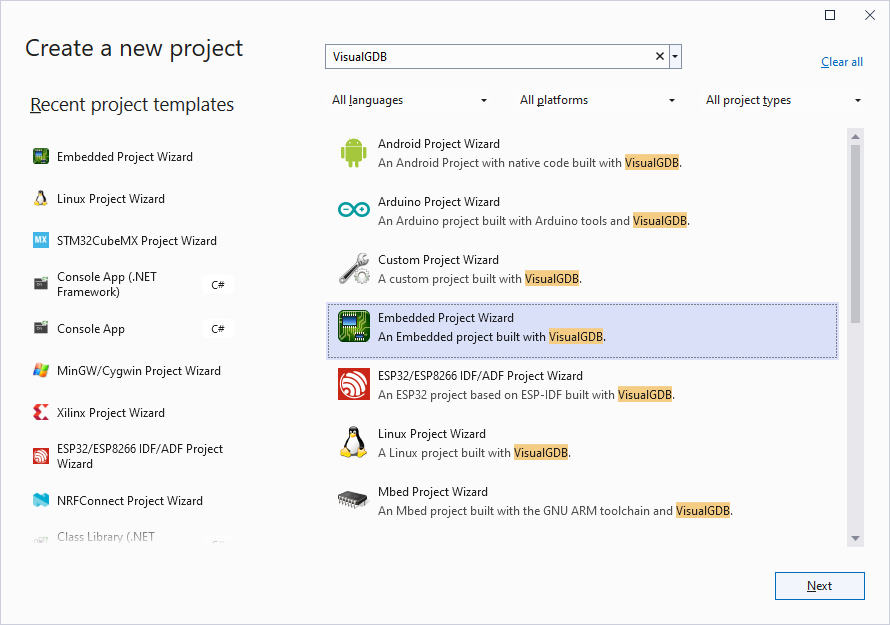
- Start Visual Studio and launch the VisualGDB Embedded Project Wizard:
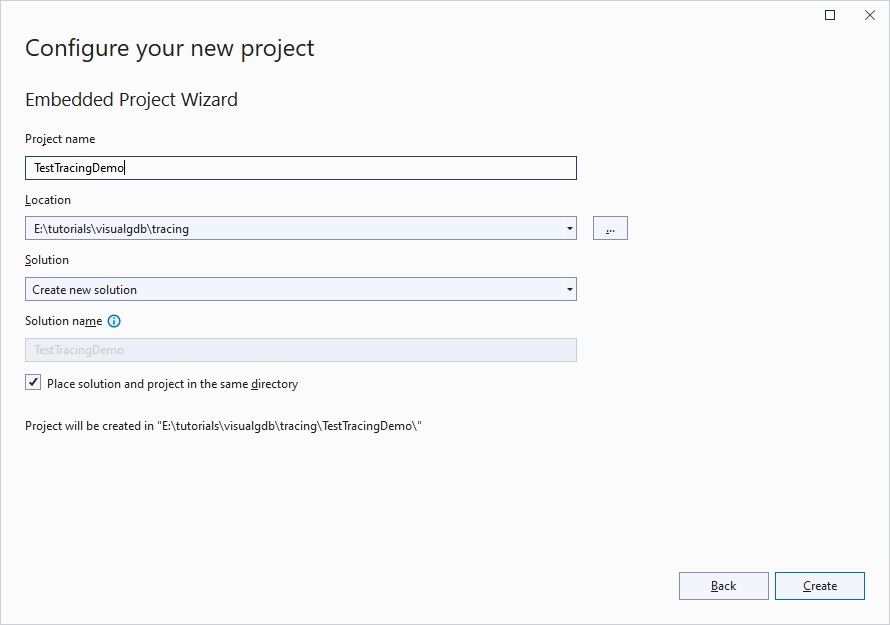
- Enter the name and location for the project you would be creating:
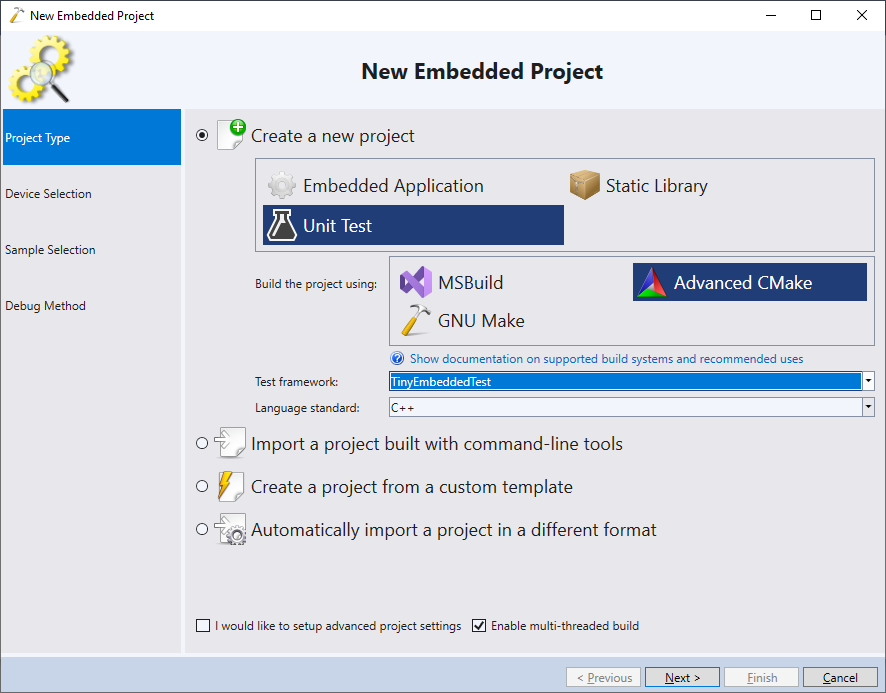
- Select “Create a new project -> Unit Test ->Advanced CMake” and pick the TinyEmbeddedTest framework:
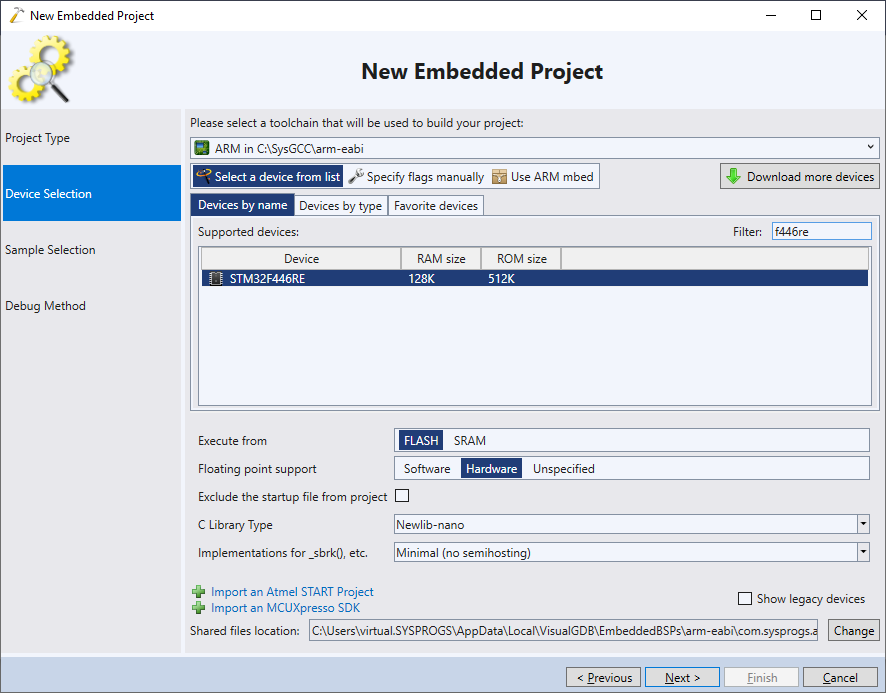
- Select the latest ARM toolchain and pick the device you would like to target:
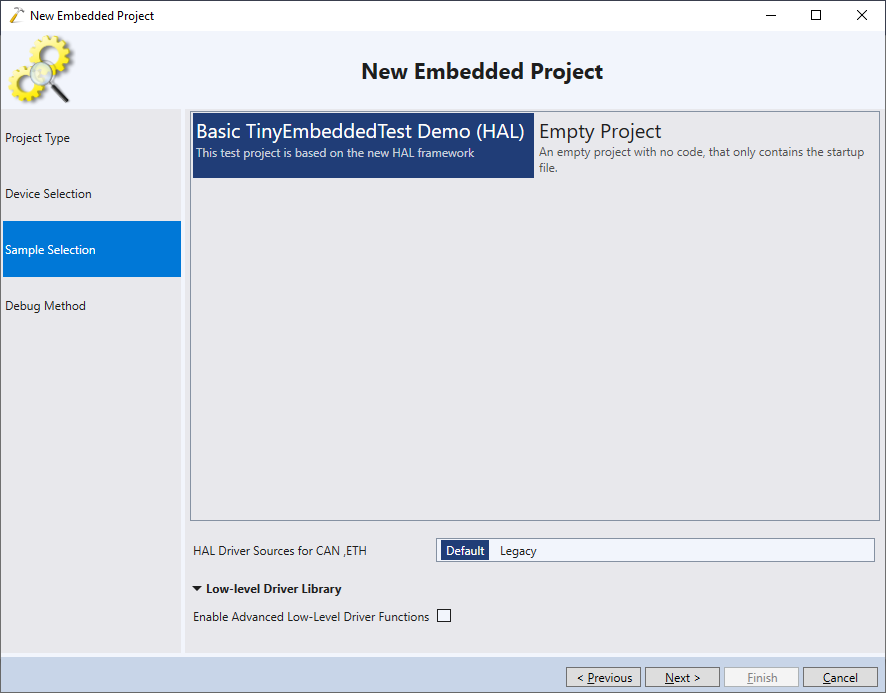
- Proceed with the default test project template:
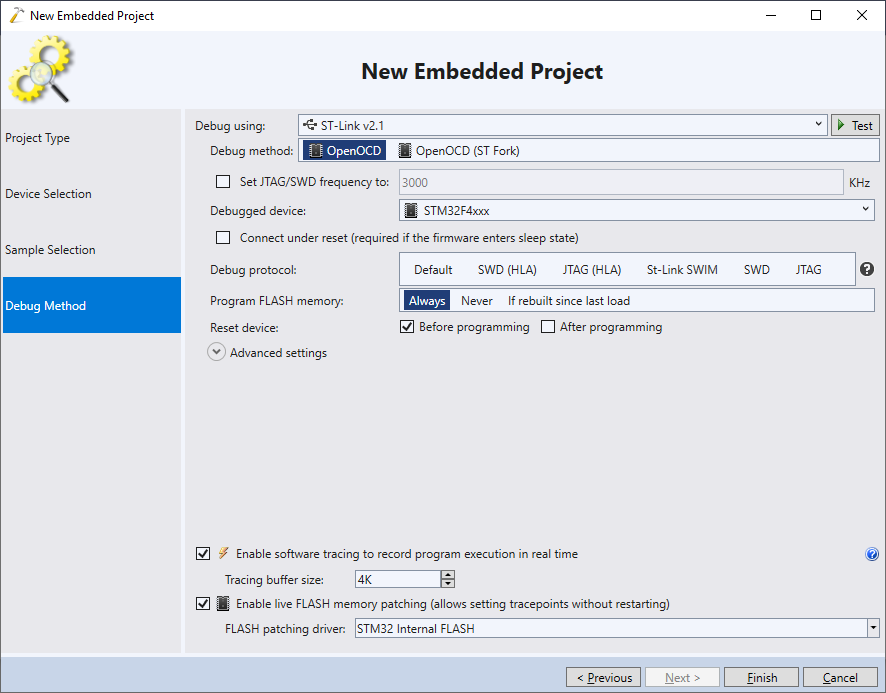
- Select the debugging settings that work with your device and make sure the software tracing is enabled at the bottom of the page:
- Press “Finish” to generate the project. Once it is created, replace the contents of the tests.cpp file with the following:
class MyNumber
{
private:
    int Value;

public:
    MyNumber(int x)
        : Value(x)
    {
    }

    MyNumber operator+(const MyNumber &right) const
    {
        return MyNumber(Value + right.Value);
    }

    MyNumber operator*(const MyNumber &right) const
    {
        return MyNumber(Value * right.Value);
    }

    bool operator==(const MyNumber &right) const
    {
        return Value == right.Value;
    }
};

void TestBinomial(MyNumber x, MyNumber y)
{
    CHECK_EQUAL((x + y) * (x + y), (x * x) + MyNumber(2) * x * y + (y * y));
}

TEST(DemoTestGroup, MathTest)
{
    TestBinomial(1, 2);
    TestBinomial(3, 4);
}
This code verifies the (x + y)2 = x2 + 2xy + y2 equation for 2 sets of numbers: (x=1, y=2) and (x=3, y=4). You can find a working version of the sample project in our GitHub repository.
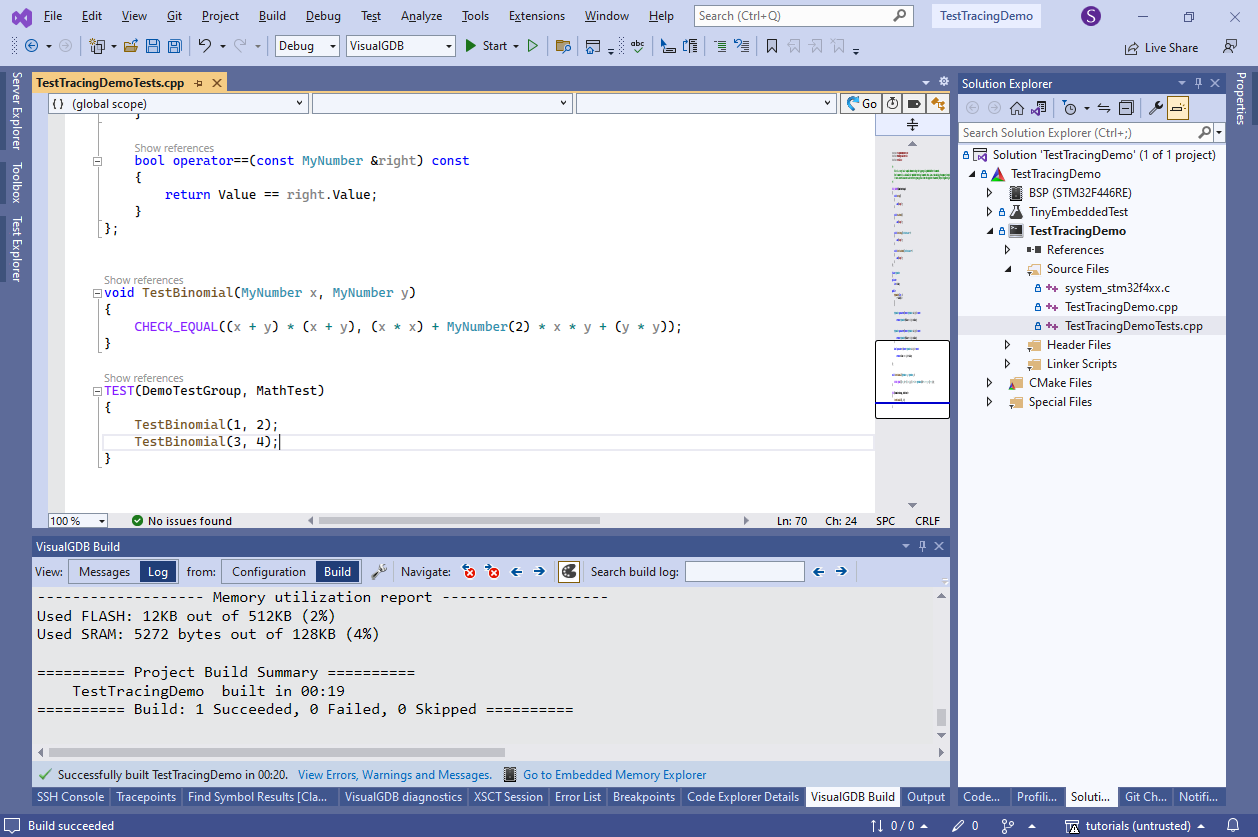
- Build the solution and ensure it does not trigger any errors:
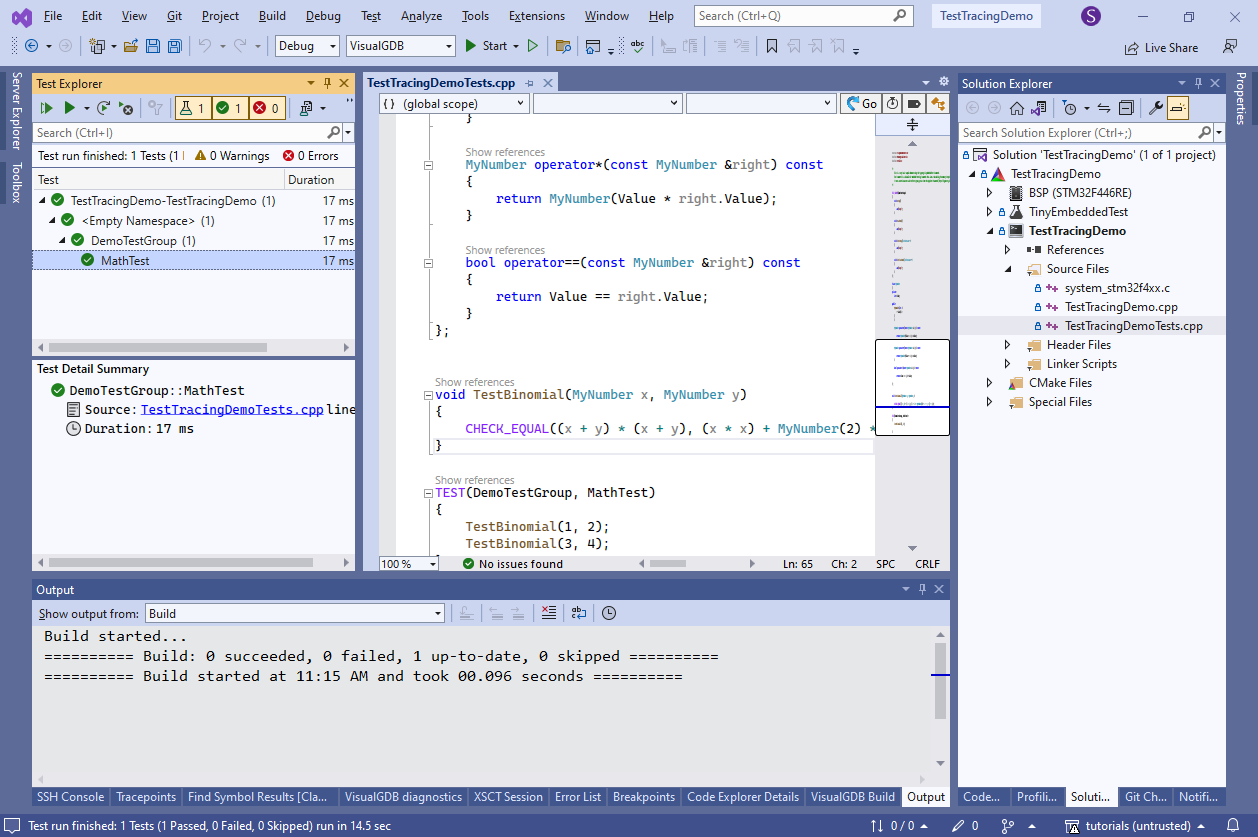
- Open the Test Explorer window and run MathTest. Make sure it passes:
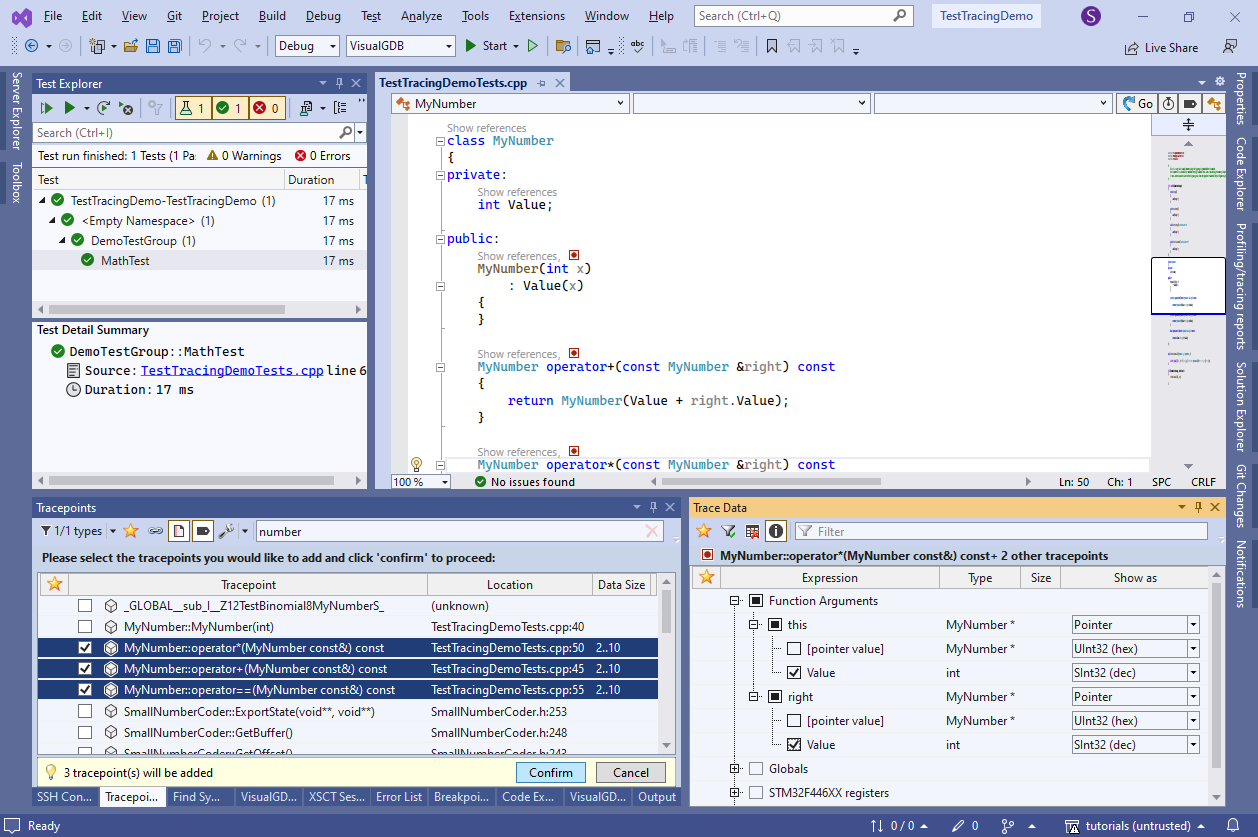
- Now we will show how to record the function calls using Live Tracing. Open the Debug->Windows->Tracepoints window, click “create a new function tracepoint” and check all 3 operators defined for MyNumber. Select to trace this->Value and right.Value:
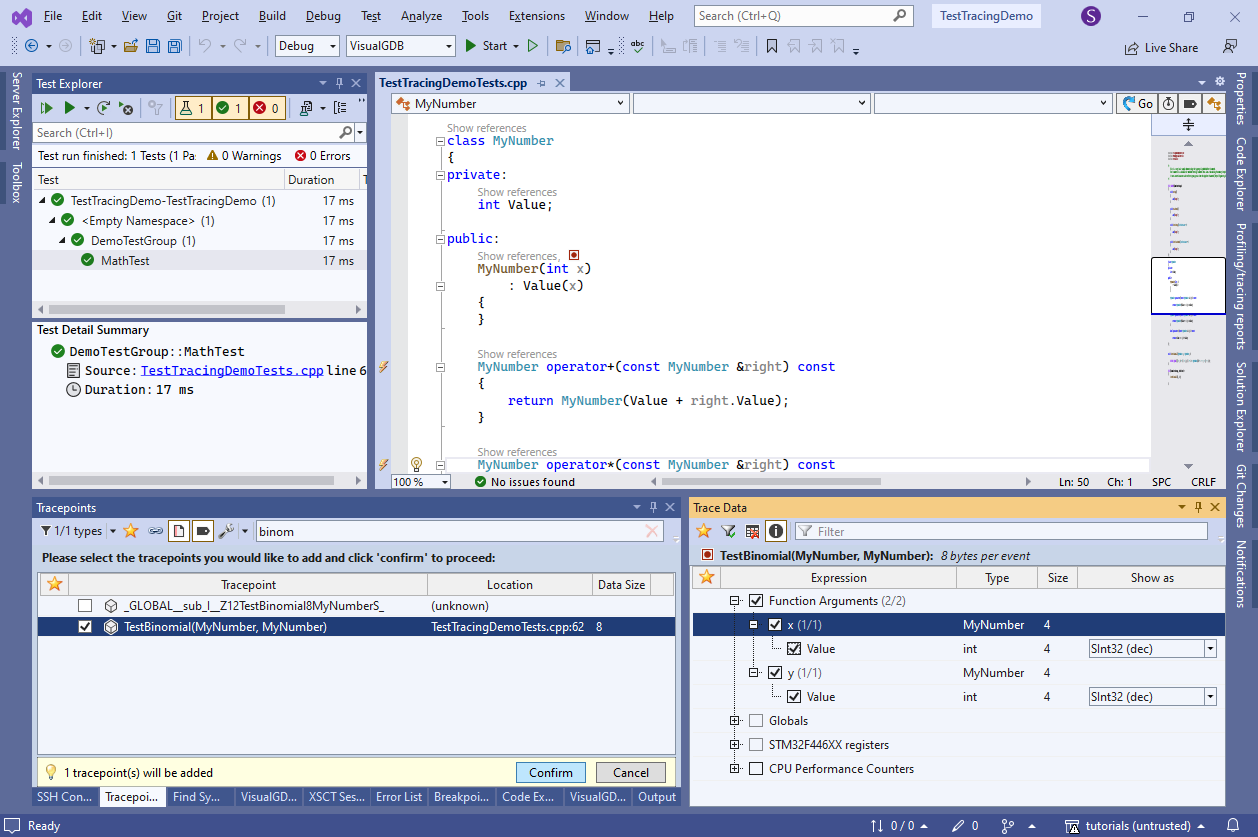
- Also trace TestBinomial() with the values of x.Value and y.Value:
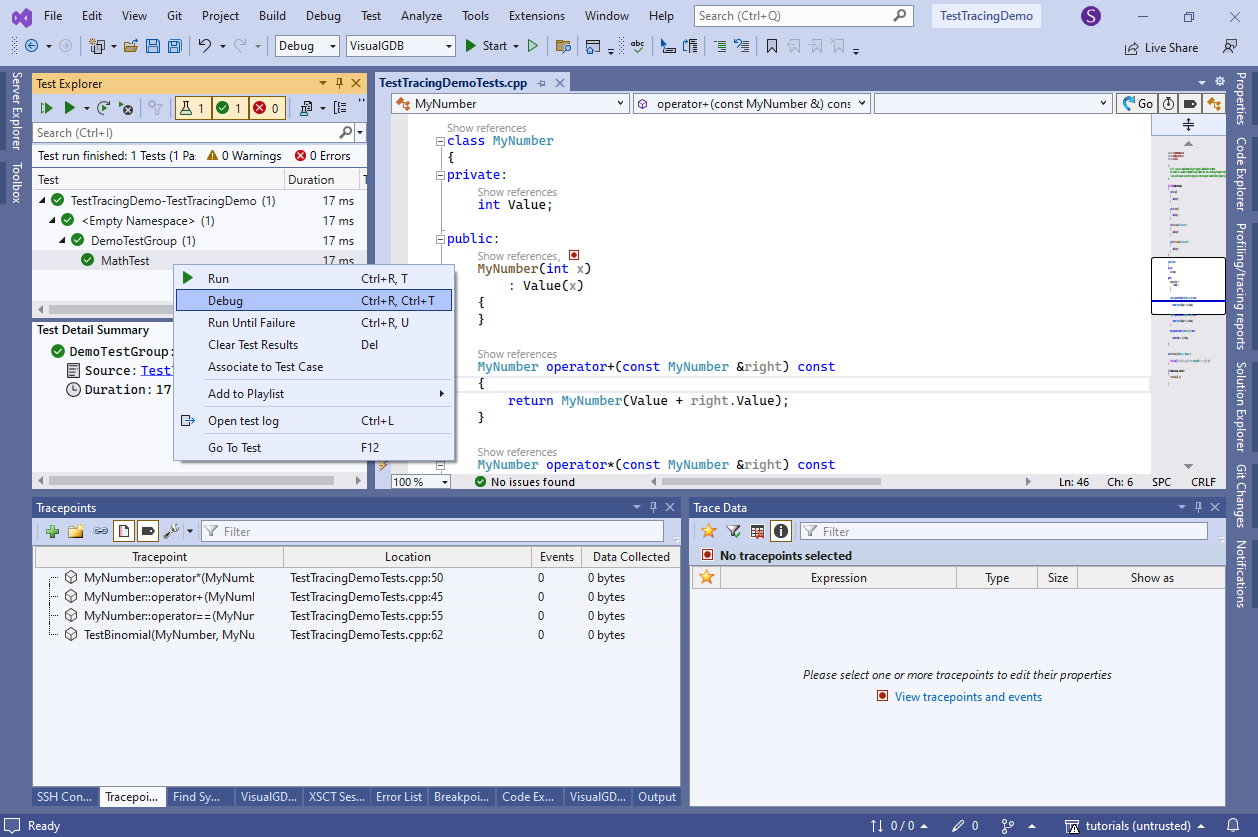
- Start debugging the unit test:
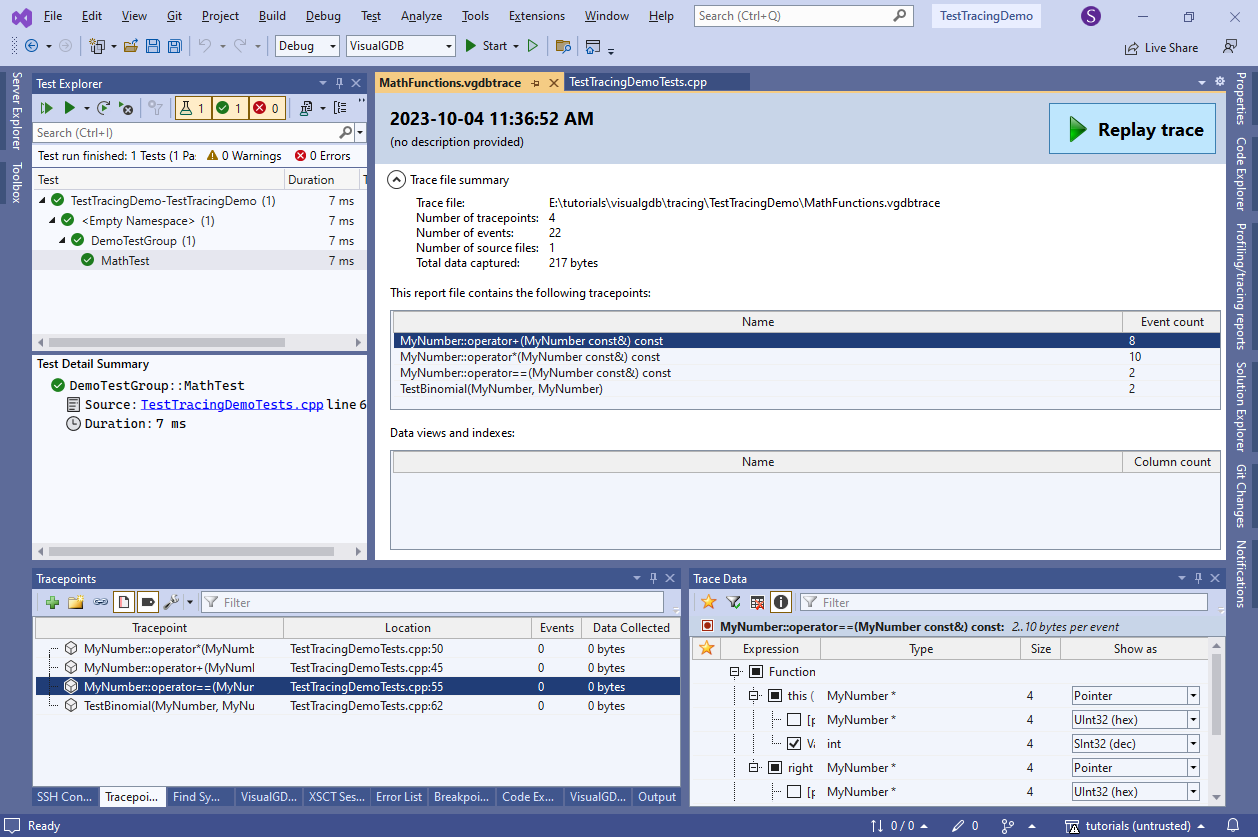
- VisualGDB will run the test and open the test report file showing which function calls were recorded:

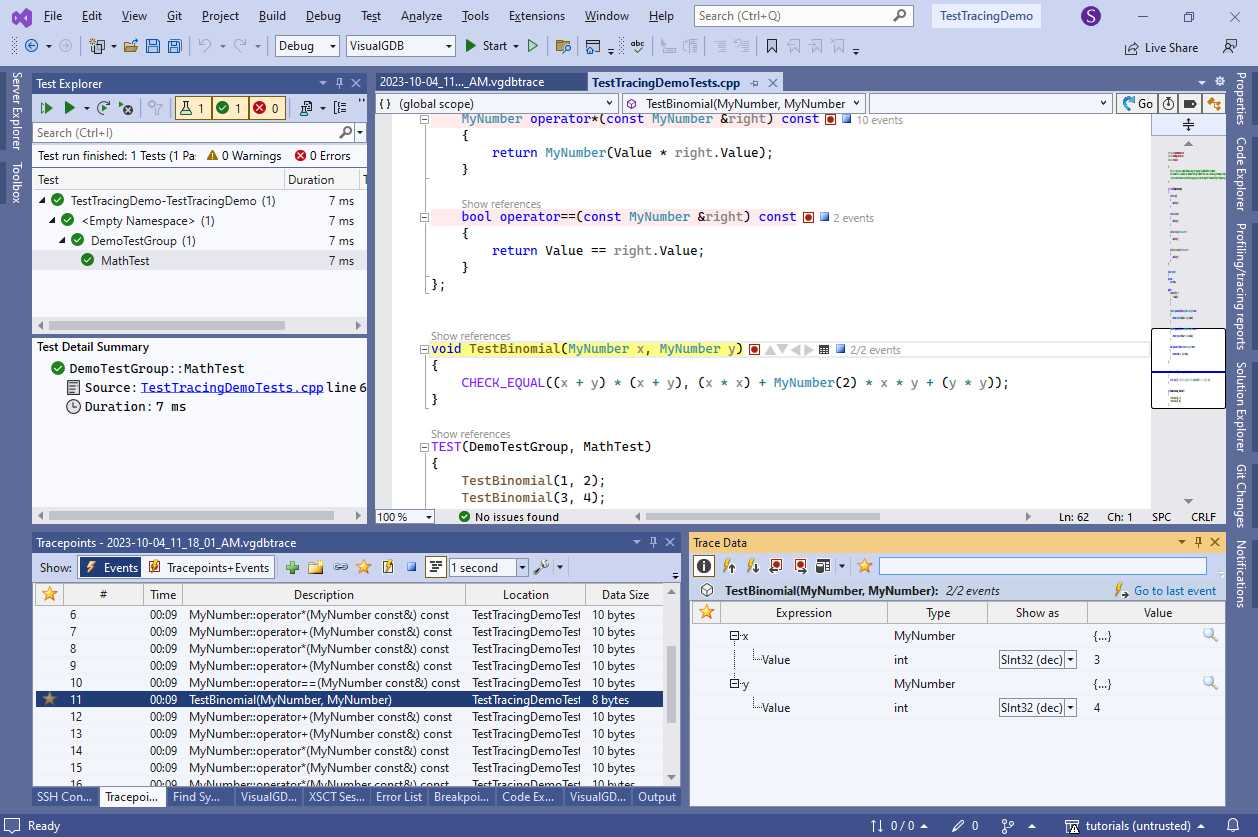
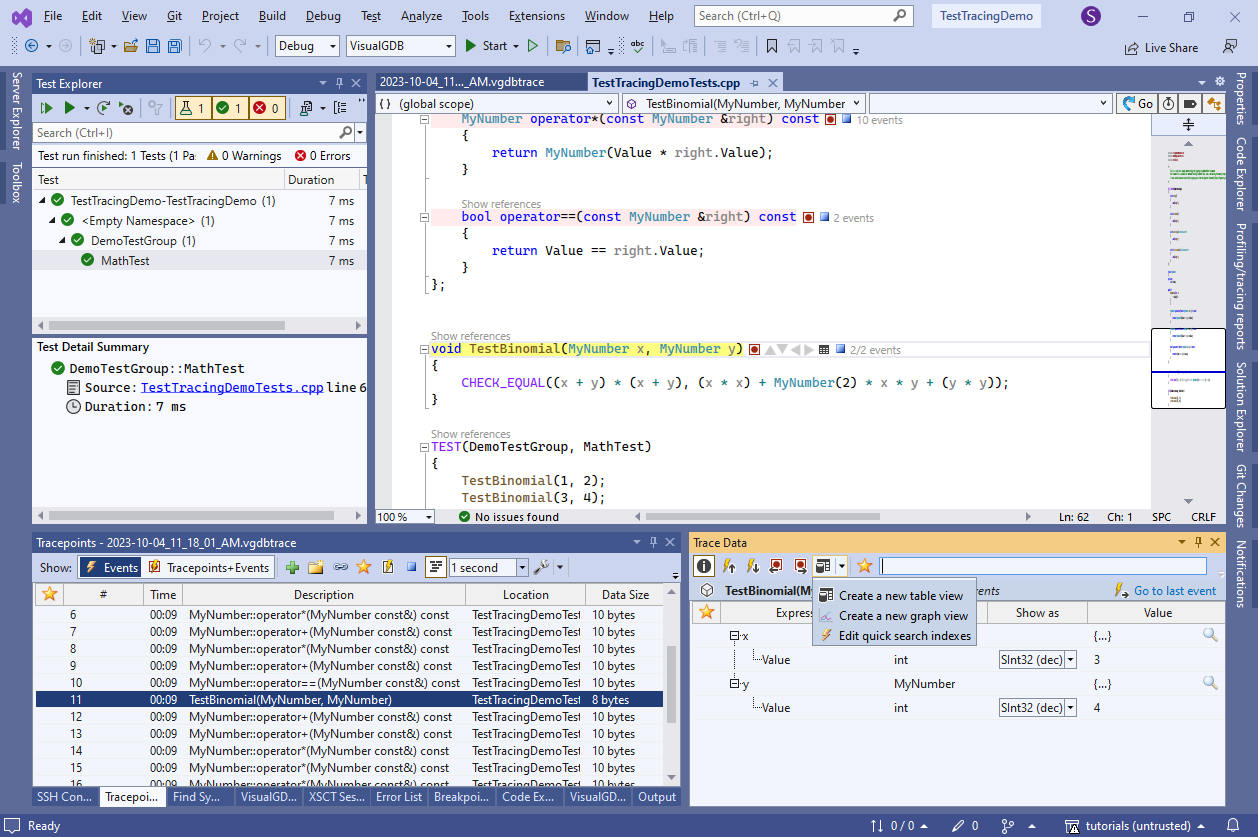
- Click “Replay trace” and go to the Tracepoints view. You will see all the recorded function calls together with their arguments:
 You can also place tracepoints anywhere in the code and record local variables, global variables, hardware registers (e.g. UART status registers) or the ARM Cortex cycle counter.
 - You can get a better overview of recorded events by creating a table view from the Trace Data window:
- Simply drag the values from different events into the lower part of the view, and VisualGDB will create a table showing the order of the calls with the arguments:
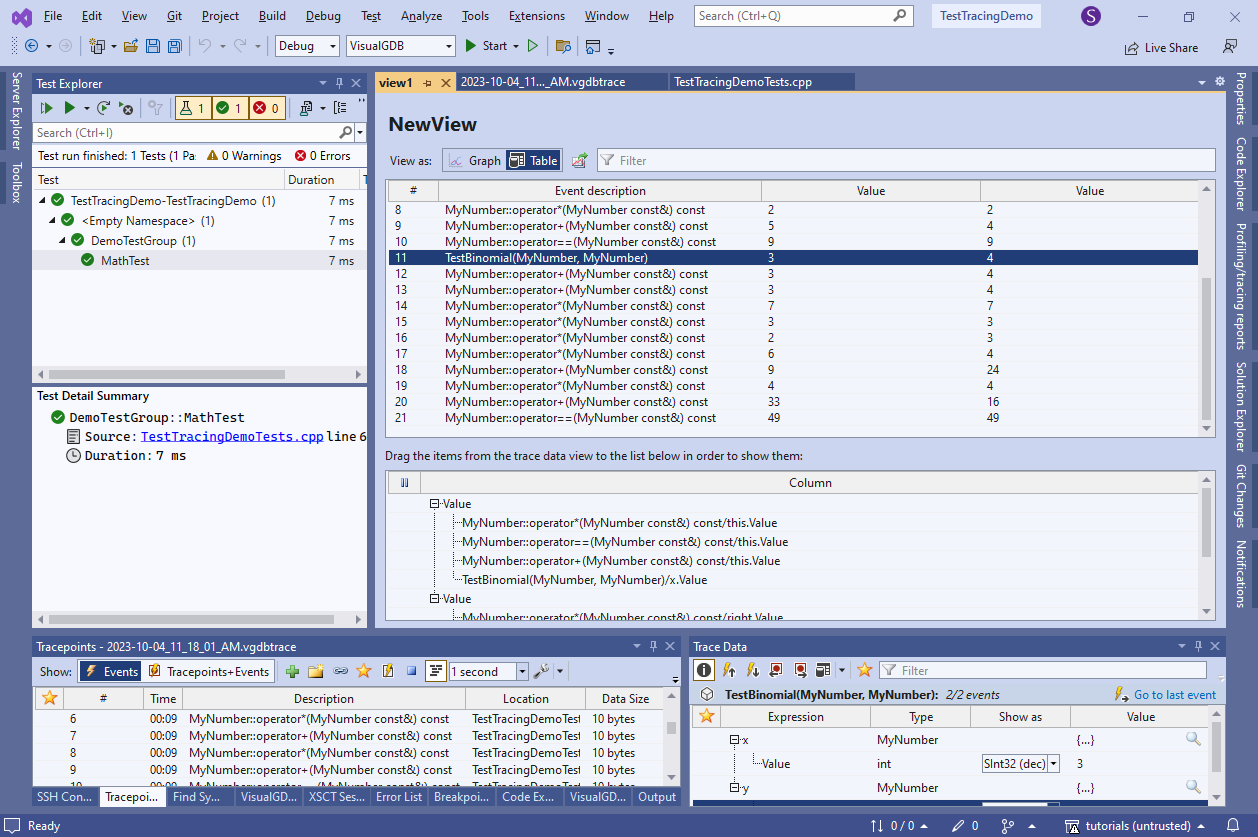 The table makes it very clear how the (x + y)2 = x2 + 2xy + y2 equation got checked:
- Computed (3 + 4) = 7 twice.
- Multiplied 7 * 7 to get the left part of the equation.
- Computed x2 for the right part (3 * 3 = 9).
- Calculated 2xy by multiplying 2 * 3 = 6 and 6 * 4 = 24.
- Added x2 to 2xy (9 + 24 = 33).
- Squared 4 to compute y2 = 16.
- Added it to the previous sum, also arriving at 49.
- Verified that both sides of the equation evaluated to 49.
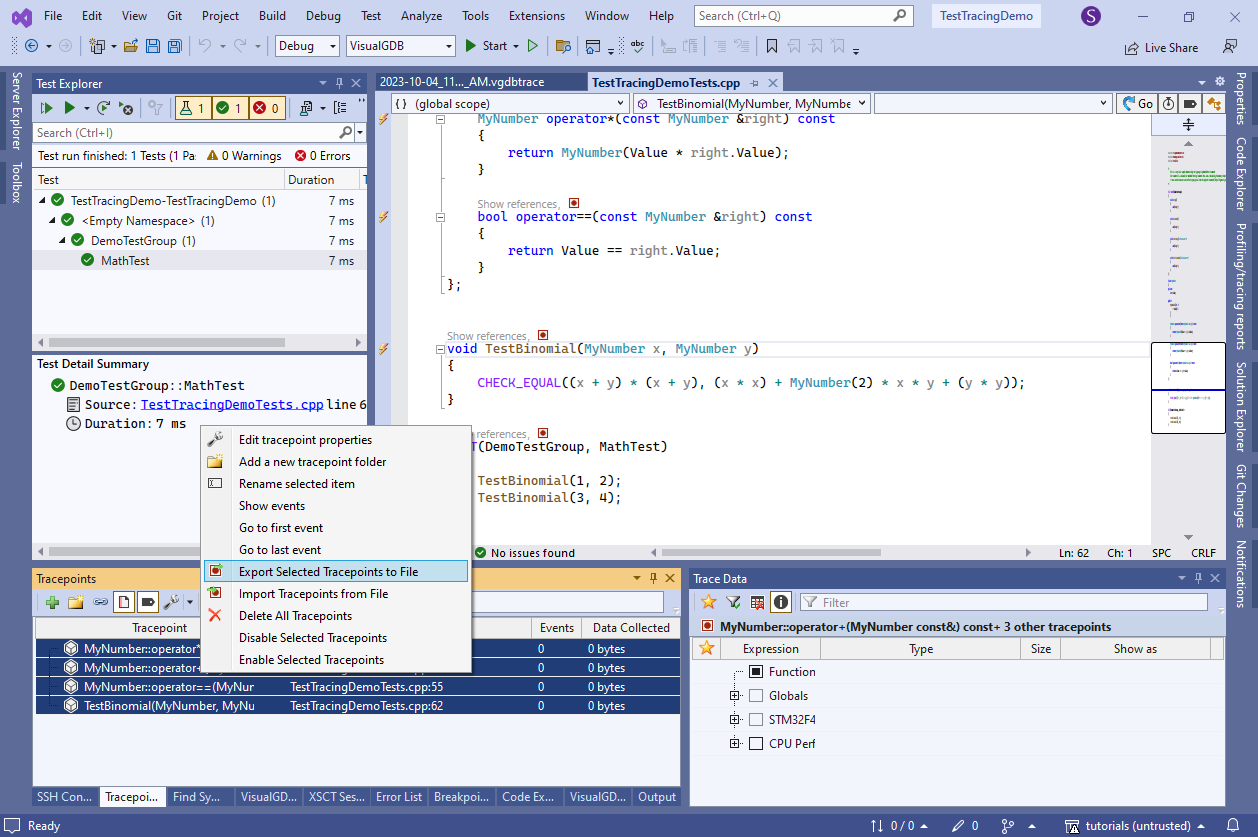
- You can create the tracing reports via command line as well. Select all tracepoints and export them into an XML file:
- Then, run the following command line:
"%VISUALGDB_DIR%\VisualGDB.exe" /runtests TestTracingDemo.vgdbcmake /output:TestTracingDemo.xml /traceconfig:TracepointSets\MathFunctions.xml /tracereport:MathFunctions.vgdbtrace /xmltracereport:MathFunctions.xml /targetpath:build\VisualGDB\Debug\TestTracingDemo
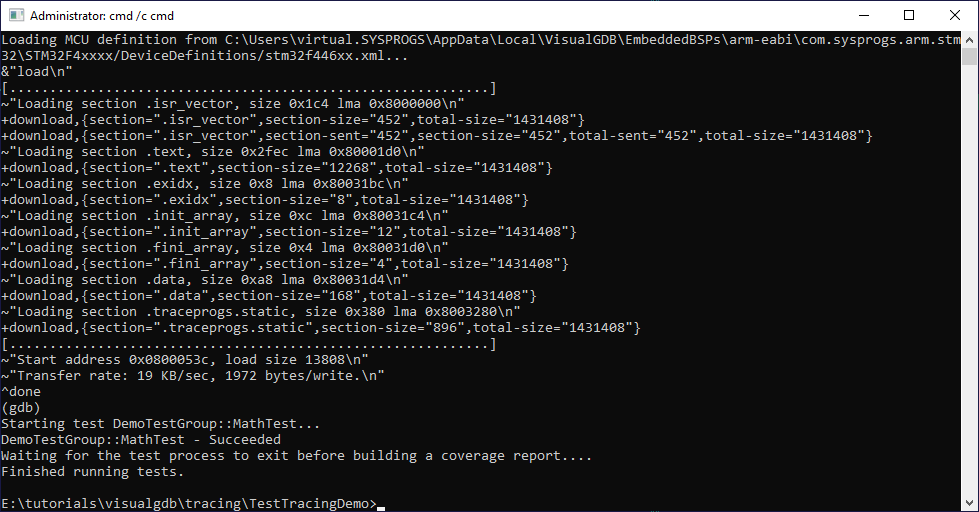
- VisualGDB will produce a browseable report (MathFunctions.vgdbtrace) and a machine-readable report (MathFunctions.xml) . You can open the regular report via File->Open command in Visual Studio:
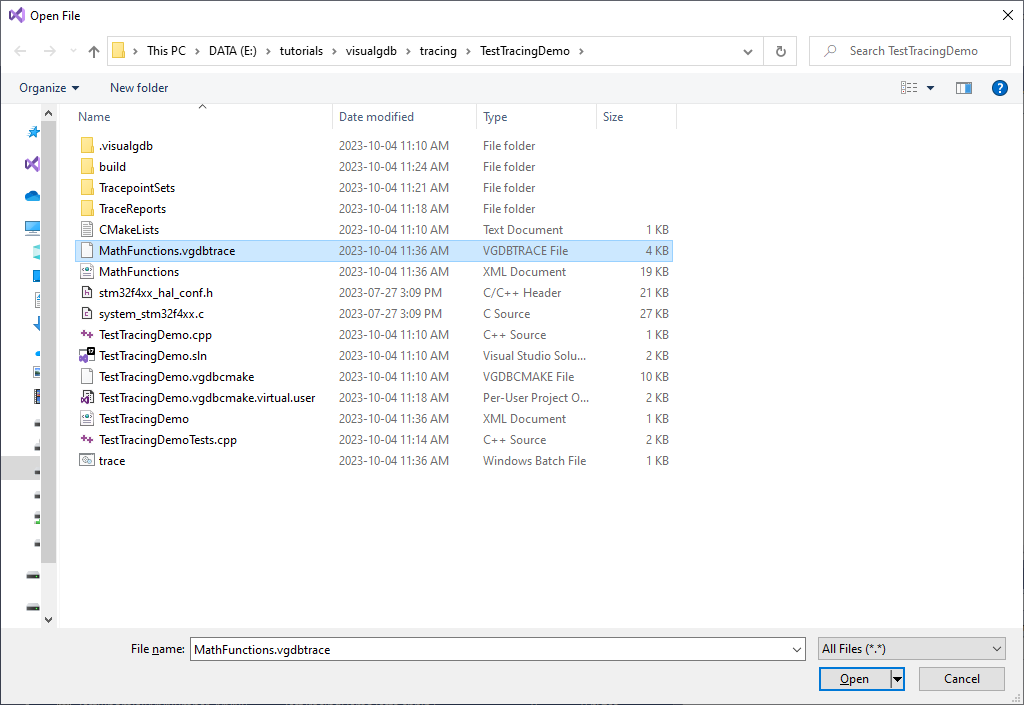
- It will look the same as the report that was generated from the VS itself. You can replay it as needed, create table/graph views, or export data from it to CSV files:
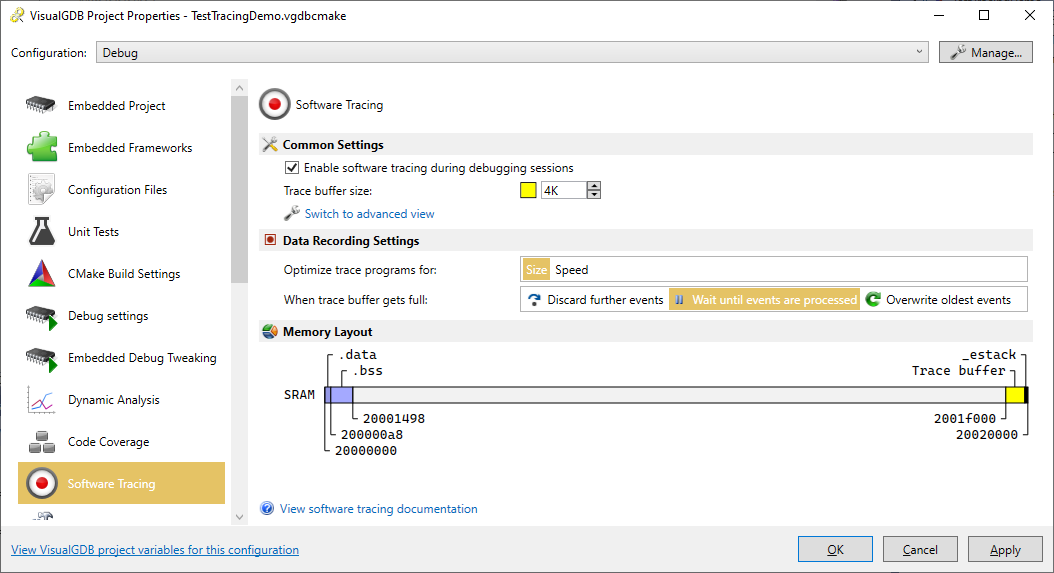
- If the test produces more tracing data than VisualGDB can read over the debugging interface, it would normally discard further data to avoid slowing down the program. You can override this behavior via VisualGDB Project Properties -> Software Tracing -> When trace buffer gets full -> Wait until events are processed:
 This way the recording won’t miss a single function call, even if the target has to wait several times for the debugger to read the generated data.